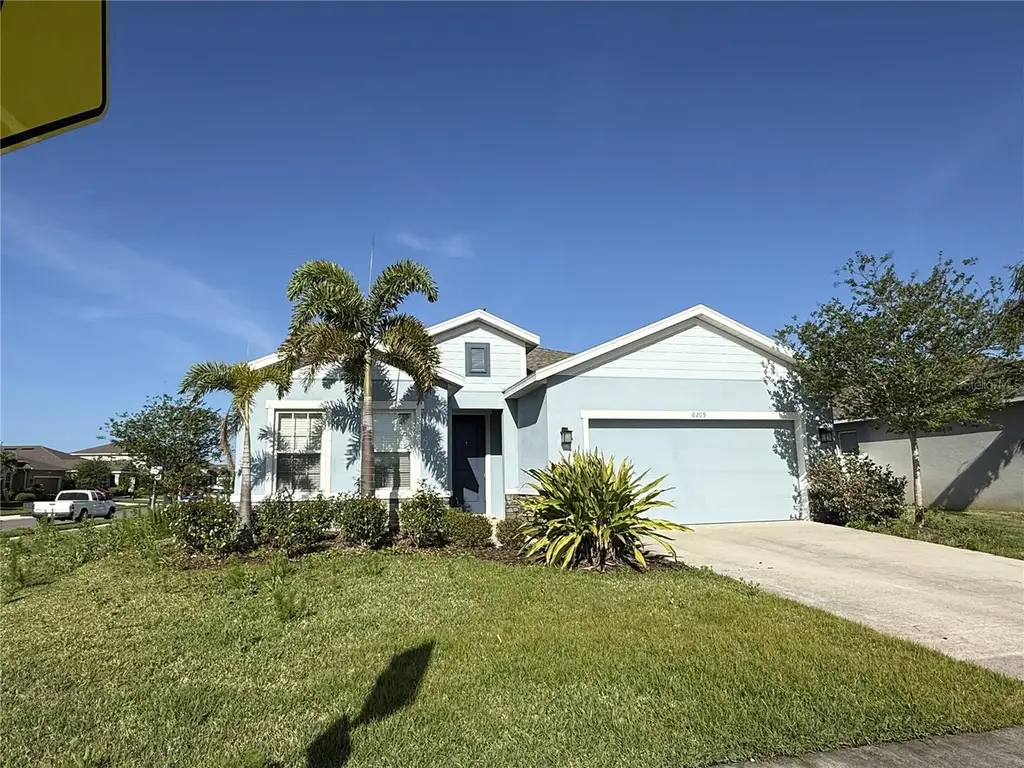
6205 114th Ave E · Bradenton, FL
Flood risk 1/10 · Minimal
- FEMA flood zone
- X (unshaded)
- Chance of flooding over 30 yrs
- 0.0%
- Est. flood insurance / yr
- $507 – $1,088
Fire risk 5/10 · Moderate
- Est. fire insurance / yr
- $947 – $1,759
Heat risk 10/10 · Severe
- Hot days now (above 107°F)
- 7 days/yr
- Hot days in 30 yrs
- 28 days/yr
Wind risk 10/10 · Severe
- Chance of severe wind over 30 yrs
- 99.0%
Air-quality risk 3/10 · Minor
- Unhealthy air days now
- 3 days/yr
- Unhealthy air days in 30 yrs
- 3 days/yr
Risk factors via First Street. Map © Google.
Why this score? — see what drove the D+ grade
The composite is a weighted blend of 9 inputs, each scored 0–100. Each bar is that input's sub-score; the figure is the points it added to the 100-point composite (weight × sub-score).
- ARV discount +13.6/15.0
- Cash flow +12.5/30.0
- Schools +4.4/10.0
- Livability +4.0/5.0
- Condition / age +4.0/5.0
- 1% rule +3.8/10.0
- DSCR +3.7/10.0
- Rent growth +2.3/5.0
- Appreciation +0.0/10.0
$320,000
🖨 Deal sheet (PDF) 📄 Offer letter ✓ Due diligence
Listing remarks
Under contract-accepting backup offers. Short Sale. Located in the Willow Bend community of Parrish, this 4-bedroom, 2-bath home built in 2021 offers approximately 1,808 square feet of living space with a two-car garage and a functional single-story layout. The home features an open floor plan with a great room design, spacious bedrooms, and modern finishes typical of newer construction. Based on available information, the property appears to be in generally good condition, providing an opportunity to acquire a newer home without the need for major renovation. Buyers are encouraged to conduct their own inspections to verify condition. Residents of Willow Bend enjoy community amenities inclu
Key facts
- Open floor plan
- Community amenities
- Modern finishes
Tags
Property features AI
Finance
- Other: Partially furnished; Homestead exempt; Zoned PD-R
- Financial info: Lease restrictions apply; Total monthly fees listed as $100; total annual fees listed as $1,200
- HOA & community: Monthly HOA: $100; HOA amenities include pool, park, playground and recreational facilities; Association fee includes pool, maintenance of grounds, common area taxes and recreational facilities; Pets allowed (cats and dogs); Golf carts allowed; Sidewalks in community
Exterior
- Parking: Attached garage; 2-car garage
- Utilities: Public water; Public sewer; Electricity connected; Cable connected; Fiber optics available; Phone available; BB/HS internet available; Sprinkler meter; Fire hydrant nearby; Water connected; Sewer connected
- Home design: Single family residence; Single-story (One level); Faces east
- Construction: Block construction; Shingle roof; Slab foundation; Built on less than 1/4 acre lot
- Exterior features: Hurricane shutters; Sliding doors; Irrigation equipment; Asphalt road access; Planned unit development
Interior
- Kitchen: Convection oven; Dishwasher; Exhaust fan; Freezer; Ice maker; Microwave; Refrigerator
- Bedrooms: 4 bedrooms
- Flooring: Laminate; Tile
- Bathrooms: 2 full bathrooms
- Heating & cooling: Baseboard heating; Central heating; Central air conditioning
- Interior features: Open floorplan; Thermostat; Window treatments; Attic; Family room
- Laundry & utility: Washer; Dryer; Electric water heater; Inside laundry
Neighborhood map
What this means for you Summary
Snapshot
- This is a 4-bed/2.0-bath single-family listed at $320k. Condition is rated good.
Deal economics
- At list price, monthly cash flow is $-44 ($-531/yr) — negative.
- To cash-flow at today's rent, offer at most $312k (2.4% below list).
- To meet the 1% rule (rent ≥ 1% of price), the offer needs to be $282k (11.7% below list).
- Recommended offer: $282k (11.7% below list) — sets the bar for 1% rule.
- Cap rate 6.1% vs local median 3.6% in Bradenton — top-decile yield for the area; either an underpriced asset or a hidden risk that comps aren't pricing in. Stress-test before assuming the spread holds.
Location & tenants
- Location reads 81/100 on livability (#101 in FL, #1,528 nationally) — a professional / high-income tenant draw. Strengths: commute A+, cost of living A+, housing A+; Watch: employment D+, crime D, amenities F.
- Manatee (suburban): math 54% / reading 50% proficiency, ranked #26 of 73 in FL (top 36%) — acceptable for families but not a draw, mixed tenant base, ~2y average lease.
- Zoned schools: Barbara A Harvey Elementary School (math 74% / reading 59%, grade B+, #473 of 2,144 statewide, top 23%, 1,069 students, 33% FRL); Buffalo Creek Middle School (math 59% / reading 51%, grade B-, #180 of 571 statewide, top 32%, 1,127 students, 44% FRL); Parrish Community High School (math 47% / reading 57%, grade D+, #160 of 667 statewide, top 25%, 2,017 students, 32% FRL).
- Market conditions: Rents soft (-0.9%/yr); 2194 active listings in the ZIP; 20 comparable units currently listed for rent nearby; rentals at typical pace (median 18d on market — plan ~3-4 weeks tenant-placement turnaround); high-income renter base; 7,472 units permitted in Manatee County in 2024 (1,782 in 5+ unit buildings).
Forward outlook
- Local home prices are declining (-3.0%/yr); year-one equity from $2k of loan paydown is wiped out by about $10k of value loss. Plan a longer hold.
- Manatee County population projected at +43% by 2050 — long-run rental-demand tailwind backs the buy-and-hold thesis.
Negotiation context
- It's been on market 54 days — a 3% lower offer ($310k) is reasonable based on typical stale-listing flexibility.
- 5 sale attempts since 6y ago; this cycle's ask has dropped $30k (9%) from the opening price — seller is motivated, your offer sets the floor, not the list.
Risks & watch-outs
- Climate carrying-cost: severe wind risk, 99% chance of damaging wind over 30y; moderate wildfire risk; extreme-heat days projected 7→28/yr by 2055 (HVAC capex compounding) — expect insurance premiums to compound above CPI over the hold.
Questions for the listing agent
- What do current leases actually rent for vs. the listed asking? Can we see a recent rent roll and the last 12 months of T-12 income?
- It's been on market 54 days. Have you received any prior offers? Is the seller open to a 12% concession, seller financing, or rate buy-down credit?
- What does the HOA fee cover, when was the last increase, and are there any pending special assessments or reserve-fund shortfalls?
- Is there a deadline driving the sale (1031 exchange, divorce, estate, relocation)? That informs how much negotiation room exists.
- Crime grade is D in this area — have there been break-ins, vandalism, or insurance claims at this property in the last 3 years? What carrier currently insures it and at what premium?
- The area grade is low — what's the realistic commute time and amenity access for the typical tenant pool here? Any planned neighborhood developments (good or bad) we should know about?
- What's the average days-on-market for RENTAL listings here right now (not sales)? A rising rental-DOM trend means longer vacancies and softer asking-rent achievability than the comps imply.
- What's the recent tenant-quality profile in this submarket — average credit score on applications, eviction rate, late-payment / NSF rate, and stable-employment percentage? A property-management company in the area should have these aggregated.
- How much new for-sale + rental construction is in the pipeline within 1–3 miles? Heavy new supply typically softens prices + rents 12–24 months out; constrained supply supports both.
Investment metrics
- 1% rule
- 0.88% ✗
- Cap rate
- 6.13%
- Cash-on-cash
- -0.59%
- DSCR
- 0.97
- GRM
- 9.4
CMA / ARV
- ARV (on-the-fly)
- $370,640
- Comps found
- 12
Show comp detail 12 sales within ~0.75 mi
| Address | Dist | Beds/Ba | Sqft | Sold | Price | $/sf | Match |
|---|---|---|---|---|---|---|---|
| 6209 116th Ave E | 0.28mi | 3/2.0 (-1) | 1,808 (0%) | 2mo | $460,000 | $254 | 81 |
| 6111 116th Ave E | 0.28mi | 3/2.0 (-1) | 1,808 (0%) | 3mo | $350,000 | $194 | 80 |
| 6217 116th Ave E | 0.28mi | 3/2.0 (-1) | 1,808 (0%) | 15mo | $439,000 | $243 | 70 |
| 11311 63rd St E | 0.11mi | 3/2.0 (-1) | 1,675 (-7%) | 13mo | $379,000 | $226 | 67 |
| 6105 114th Dr E | 0.09mi | 4/2.0 | 2,022 (+12%) | 11mo | $395,000 | $195 | 66 |
| 6307 113th Ter E | 0.17mi | 4/2.0 | 2,022 (+12%) | 8mo | $410,000 | $203 | 66 |
| 10719 55th Ct E | 0.73mi | 4/2.0 | 1,827 (+1%) | 2mo | $350,000 | $192 | 63 |
| 5720 107th Ter E | 0.62mi | 3/2.0 (-1) | 1,808 (0%) | 9mo | $380,000 | $210 | 59 |
| 6120 115th Ave E | 0.22mi | 3/2.0 (-1) | 2,018 (+12%) | 9mo | $410,000 | $203 | 58 |
| 6609 114th Ave E | 0.28mi | 3/2.0 (-1) | 2,018 (+12%) | 13mo | $425,000 | $211 | 51 |
| 10605 58th St E | 0.71mi | 3/2.0 (-1) | 1,826 (+1%) | 13mo | $374,000 | $205 | 50 |
| 11530 57th Street Cir E | 0.45mi | 3/2.0 (-1) | 2,066 (+14%) | 10mo | $335,000 | $162 | 42 |
Match score weights: distance 35% · size 25% · config 20% · recency 20%. Top-matched comps best support the ARV.
Projected returns pro-forma
-3.0% appreciation · 0.0% rent growth · sell at horizon
- IRR
- -20.8%
- Equity multiple
- 0.30×
- Total profit
- $-62,865
- Equity at exit
- $47,713
- IRR
- -23.2%
- Equity multiple
- -0.00×
- Total profit
- $-90,025
- Equity at exit
- $27,668
Cash invested: $89,600 (down + closing). Projections, not guarantees.
Landlord ↔ Tenant lean methodology
- Overall (STATE)
- 87 Strongly Landlord-Friendly
- State Florida
- 87 Strongly Landlord-Friendly · R+3
- County
- — inherits STATE
- City
- — inherits STATE
ZIP-level market 34219
- Home prices YoY
- -23.7%
- Rents YoY
- -0.9%
- Active inventory
- 2194
- Price-to-rent
- 9.4×
Monthly cashflow live
- Estimated rent
- $2,825 high interval (Pro) →
- Mortgage (P&I)
- −$1,678
- Tax from tax record
- −$364 /mo · $4,371/yr
- Insurance
- −$133
- HOA
- −$100
- Vacancy / Maint / Mgmt
- −$593
- Net cashflow
- $-44
Break-even live
Sensitivity live
| Price | -10% $137 | -5% $46 | +0% $-44 | +5% $-135 | +10% $-225 |
|---|---|---|---|---|---|
| Rent | -10% $-267 | -5% $-156 | +0% $-44 | +5% $67 | +10% $179 |
| Rate | -1.0pp $117 | -0.5pp $37 | base $-44 | +0.5pp $-127 | +1.0pp $-211 |
UW: 25.0% down · 7.5% · 30yr · 1.5% tax · 5.0% vac · 8.0% maint · 8.0% mgmt
Financing live
Cash to close
- Down payment
- $80,000
- Closing costs
- $9,600
- Reserves months
- —
- Total cash needed
- —
Loan-product check · same deal, 3 products live
Conventional
25% down · 7.5% · 30yr
- Down + closing
- —
- Monthly P&I
- —
- Monthly cashflow
- —
- DSCR
- —
- Eligible?
- —
Personal DTI + credit; lowest rate.
DSCR
20% down · 8.5% · 30yr
- Down + closing
- —
- Monthly P&I
- —
- Monthly cashflow
- —
- DSCR
- —
- Eligible?
- —
No personal income docs; deal must DSCR.
Hard money
10% down · 12.0% · 12mo
- Down + closing
- —
- Monthly P&I
- —
- Monthly cashflow
- —
- DSCR
- —
- Eligible?
- —
Short-term bridge; refi at stabilization.
Rent comps 20 comps
| Address | Beds | Baths | Sqft | Rent | $/sqft | DOM | Units | Dist |
|---|---|---|---|---|---|---|---|---|
| 6203 115th Ave E Parrish, FL | 3.0 | 3.5 | 2384 | $2,770 | $1.16 | 17d | 1 | 0.20mi |
| 5525 106th Ave E Parrish, FL | 4.0 | 2.0 | 1952 | $2,511 | $1.29 | 23d | 1 | 0.78mi |
| 10508 55th Ct E Parrish, FL | 3.0 | 2.0 | 1447 | $3,000 | $2.07 | 25d | 1 | 0.81mi |
| 11639 Old Florida Ln Parrish, FL | 3.0 | 2.5 | 1692 | $2,350 | $1.39 | 21d | 1 | 0.90mi |
| 11465 Summit Rock Ct Parrish, FL | 4.0 | 2.5 | 2434 | $2,975 | $1.22 | 25d | 1 | 1.02mi |
| 11106 Sand Pine Ln Parrish, FL | 3.0 | 2.0 | 1766 | $2,579 | $1.46 | 5d | 1 | 1.15mi |
| 11479 Walden Loop Parrish, FL | 3.0 | 2.0 | 2408 | $2,849 | $1.18 | 25d | 1 | 1.17mi |
| 10610 Eddy Cir Parrish, FL | 1.0–3.0 | 1.0–2.0 | 1082 | $2,495 | $2.30 | 4d | 89 | 1.22mi |
| 9924 59th St E Parrish, FL | 4.0 | 2.0 | 2209 | $2,456 | $1.11 | 5d | 1 | 1.27mi |
| 9922 52nd St E Parrish, FL | 3.0 | 2.0 | 1270 | $2,250 | $1.77 | 5d | 1 | 1.30mi |
| 11230 82nd St E Parrish, FL | 3.0 | 2.0 | 1758 | $2,495 | $1.42 | 17d | 1 | 1.31mi |
| 8123 Trimbelle Ter Parrish, FL | 3.0 | 2.0 | 1722 | $2,850 | $1.66 | 17d | 1 | 1.32mi |
| 11764 Shirburn Cir Parrish, FL | 4.0 | 2.0 | 1606 | $2,526 | $1.57 | 5d | 1 | 1.35mi |
| 11523 84th Street Cir E #105 Parrish, FL | 3.0 | 2.5 | 1588 | $1,950 | $1.23 | 5d | 1 | 1.35mi |
| 11522 84th Street Cir E #105 Parrish, FL | 3.0 | 2.5 | 1588 | $2,300 | $1.45 | 25d | 1 | 1.38mi |
| 8443 Canyon Creek Trl Parrish, FL | 3.0 | 2.5 | 2178 | $2,000 | $0.92 | 25d | 1 | 1.43mi |
| 8544 Canyon Creek Trl Parrish, FL | 3.0 | 2.5 | 1822 | $2,300 | $1.26 | 13d | 1 | 1.43mi |
| 8423 Canyon Creek Trl Parrish, FL | 3.0 | 2.5 | 1823 | $2,400 | $1.32 | 25d | 1 | 1.44mi |
| 8522 Canyon Creek Trl Parrish, FL | 3.0 | 2.5 | 1822 | $2,000 | $1.10 | 25d | 1 | 1.44mi |
| 11567 84th Street Cir E #105 Parrish, FL | 3.0 | 2.5 | 1420 | $1,999 | $1.41 | 5d | 1 | 1.46mi |
HOA detail
- Monthly dues
- $100 · $1,200/yr
Listing history 23 events
-
2026-06-13statusdays on market $320,000 Pending 54 DOM
-
2026-06-10days on market $320,000 Active 52 DOM
-
2026-06-09days on market $320,000 Active 51 DOM
-
2026-06-08days on market $320,000 Active 50 DOM
-
2026-06-08days on market $320,000 Active 49 DOM
-
2026-06-03days on market $320,000 Active 45 DOM
-
2026-06-02pricedays on market $320,000 Active 44 DOM
-
2026-06-01days on market $335,000 Active 43 DOM
-
2026-05-31days on market $335,000 Active 42 DOM
-
2026-05-11price $335,000
-
2026-04-19$350,000 Active
-
2026-01-07historical $2,795
-
2025-12-16$2,795
-
2025-12-16historical $2,795
-
2025-12-13$2,795
-
2022-11-02price $445,000
-
2022-10-16price $499,900
-
2022-08-21price $509,000
-
2022-07-13$525,000 Active
-
2021-03-06price $277,990
-
2021-01-09price $266,990
-
2020-12-03price $263,990
-
2020-10-28$261,990 Active
ⓘ Source: listings_history table (triggers on properties + properties_extension) + one-shot
backfill from property_details.listing_events for pre-trigger history.
Tax reassessment forecast FL · Resets to sale price
- Current annual tax
- $4,371 · $364/mo
- Projected year-2 tax
- $4,371 · $364/mo
- Expected delta
- $0/yr ($0/mo · 0.0%)
ⓘ Screening estimate from a state-policy table — verify with the county assessor before closing.
Climate risk First Street
- Flood 1/10 Low FEMA zone X (unshaded) · 0% chance over 30 yrs
- Wildfire 5/10 Major
- Heat 10/10 Extreme 7 d/yr ≥107°F today · 28 d/yr by 30 yrs out
- Wind 10/10 Extreme 99% chance of damaging wind over 30 yrs
- Air quality 3/10 Moderate 3 unhealthy d/yr today · 3 by 30 yrs out
Nearby sold comps map
Loading sold comps map…
Walkable amenities ~0.75 mi
Loading nearby amenities…
Taxation est. · year 1
- Rental income
- $33,895
- − Mortgage interest
- −$17,925
- − Property taxes
- −$4,371
- − Insurance
- −$1,600
- − Repairs & maintenance
- −$2,712
- − Management
- −$2,712
- − HOA
- −$1,200
- − Depreciation
- −$9,309
- Taxable loss
- −$5,932
- Est. tax savings @ 24.0%
- +$1,424
- After-tax cash flow
- $893/yr
For passive investors: Depreciation is non-cash, so a rental often shows a tax loss while cash-flowing — sheltering income. Rental losses are passive: they offset passive income freely, and up to $25,000/yr can offset ordinary (W-2) income if you actively participate and your MAGI is under $100k (phasing out to $0 by $150k); unused losses carry forward. On sale, claimed depreciation is recaptured at up to 25%, and gains may owe capital-gains tax (a 1031 exchange can defer both). Figures are a year-1 estimate at your 24.0% rate — not tax advice; consult a CPA.
Condition & rehab AI · 13 photos
This 2021 single-family home in Willow Bend offers a good condition with modern finishes and a functional layout. It is ready for move-in and would benefit from a fresh coat of paint and some landscaping maintenance to enhance its curb appeal.
Value-add opportunities
- Resale paint exterior — enhances curb appeal
- Rental trim landscaping — improves curb appeal and enhances property value
Renovation cost estimate screening
Value-add ROI direction
- Resale paint exterior — enhances curb appeal ↑
- Rental trim landscaping — improves curb appeal and enhances property value ↑
ⓘ Cost ranges are severity-bucket heuristics (US national rule-of-thumb). Get contractor quotes + a written scope before underwriting a rehab budget.
Schools (NCES district)
- District
- Manatee
- NCES district ID
- 1201230
- Math proficiency
- 54% ▼ -6.00%
- Reading proficiency
- 50% ▼ -2.00%
- Median HH income
- $49,607
- Composite
- 44.43/100
- National rank
- #2806
- State rank
- #26 of 73 in FL
Livability — Bradenton
- Score
- 81/100
- State rank
- #101
- US rank
- #1528
Category grades
Schools grade is shown separately in the Schools card above.
Census & demographics
- County
- Manatee County · 416,364 people
- City population
- 227,091
- Metro
- North Port-Sarasota-Bradenton, FL
- Population (ZIP)
- 33,296
- Household income
- $113,773
- Rent vs Own
- Severe rent burden
- 219.0
Population outlook (Manatee County) Hauer SSP2
- Today (2025)
- 447,342 people
- By 2030
- 488,911 · +9.3%
- By 2040
- 567,934 · +27.0%
- By 2050
- 637,995 · +42.6%
- By 2075
- 781,970 · +74.8%
- By 2100
- 848,272 · +89.6%
Race, ethnicity, and origin ACS 2023
- Neighborhood character
- Predominantly White (75%)
- Race & ethnicity
- White 75% Hispanic / Latino 11% Two or more races 8% Black 8% Asian 2%
- Hispanic origin (detail)
- Mexican 2% Puerto Rican 3%
- Common ancestry
- Romanian 4% Hispanic 2% Russian 2%
- Foreign-born
- 10% · Canada, Dominican Republic, Jamaica
- Languages at home
- 88% English-only · Spanish 7% French/Haitian/Cajun 2% Other Asian/Pacific 1%
Political lean MEDSL · Manatee
- 2024 margin
- Strong R (+23.5) · D 37.9% · R 61.4%
- 2008→2024 swing
- -16.5pp toward R · 2008: -7.0pp · 2024: -23.5pp
- All cycles
- 2024: R+23.5 2020: R+16.1 2016: R+17.1 2012: R+12.5 2008: R+7.0
Not yet ingested
- Civics
- —
Market trends
- HPI YoY
- ▼ -84.45%
- Current HPI
- 271.7131
- Rent YoY
- ▼ -0.95%
- Metro
- North Port-Sarasota-Bradenton, FL
- State GDP YoY
- ▲ 3.28%
- F500 in state
- 36
Industry mix (Fortune 500 HQ in FL)
| Industry | F500 HQs | Revenue |
|---|---|---|
| Industrial Technology | 2 | $29B |
|
||
| Insurance | 2 | $17B |
|
||
| Retail | 1 | $60B |
|
||
| Technology Distribution | 1 | $58B |
|
||
| Homebuilding | 1 | $35B |
|
||
| Technology Manufacturing | 1 | $35B |
|
||
Price history
+27.9% since first listed14 events — show timeline
- 2026-05-11 Price Changed $335,000 Stellar MLS as Distributed by MLS Grid
- 2026-04-19 Listed $350,000 Stellar MLS as Distributed by MLS Grid
- 2026-01-07 Rental Removed $2,795 STELLARMLS
- 2025-12-16 Listed for Rent $2,795 STELLARMLS
- 2025-12-16 Rental Removed $2,795 SHOWMOJO
- 2025-12-13 Listed for Rent $2,795 SHOWMOJO
- 2022-11-02 Price Changed $445,000 Stellar MLS as Distributed by MLS Grid
- 2022-10-16 Price Changed $499,900 Stellar MLS as Distributed by MLS Grid
- 2022-08-21 Price Changed $509,000 Stellar MLS as Distributed by MLS Grid
- 2022-07-13 Listed $525,000 Stellar MLS as Distributed by MLS Grid
- 2021-03-06 Price Changed $277,990 Stellar MLS as Distributed by MLS Grid
- 2021-01-09 Price Changed $266,990 Stellar MLS as Distributed by MLS Grid
- 2020-12-03 Price Changed $263,990 Stellar MLS as Distributed by MLS Grid
- 2020-10-28 Listed $261,990 Stellar MLS as Distributed by MLS Grid
Property tax history
+97.9%/yrLatest (2025): $4,371 · +15.0% YoY. Source: county tax records.
Cash-flow waterfall
monthlySold comps — $/sqft
last 12 mo · ≤1 miLoading sold comps…