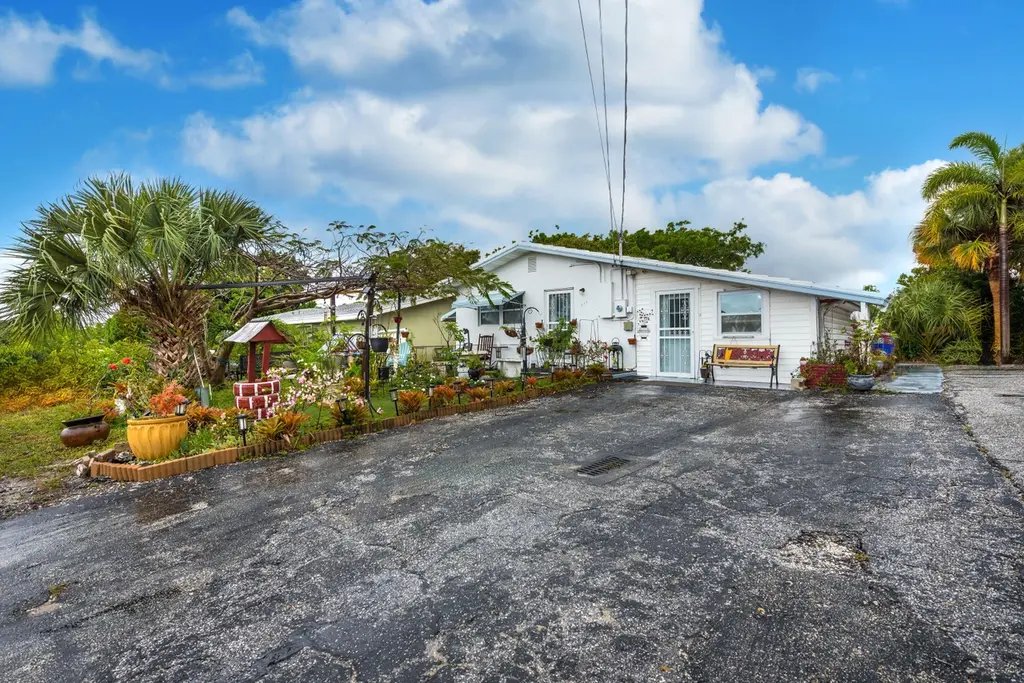
7111 Washington Ave · San Castle, FL
Flood risk 1/10 · Minimal
- FEMA flood zone
- X (unshaded)
- Chance of flooding over 30 yrs
- 0.0%
- Est. flood insurance / yr
- $507 – $1,088
Fire risk 1/10 · Minimal
- Est. fire insurance / yr
- $947 – $1,759
Heat risk 10/10 · Severe
- Hot days now (above 105°F)
- 7 days/yr
- Hot days in 30 yrs
- 27 days/yr
Wind risk 10/10 · Severe
- Chance of severe wind over 30 yrs
- 99.0%
Air-quality risk 2/10 · Minimal
- Unhealthy air days now
- 0 days/yr
- Unhealthy air days in 30 yrs
- 2 days/yr
Risk factors via First Street. Map © Google.
Why this score? — see what drove the D+ grade
The composite is a weighted blend of 9 inputs, each scored 0–100. Each bar is that input's sub-score; the figure is the points it added to the 100-point composite (weight × sub-score).
- ARV discount +15.0/15.0
- Cash flow +13.6/30.0
- Schools +4.3/10.0
- DSCR +4.1/10.0
- Rent growth +3.5/5.0
- Livability +3.4/5.0
- 1% rule +3.1/10.0
- Condition / age +2.5/5.0
- Appreciation +0.0/10.0
$360,000
🖨 Deal sheet 📄 Offer letter ✓ Due diligence
Listing remarks
Full of potential, this 3-bedroom, 2-bathroom single-family home offers a fantastic opportunity to create your dream space—with NO HOA restrictions. Ideally located in the heart of Hypoluxo, this property features tile flooring throughout, providing a solid and low-maintenance foundation. The home is ready for a new owner to add their personal touch and complete the finishing details, making it perfect for buyers looking to customize or invest. Enjoy a functional layout, ample natural light, and a spacious yard with room to enhance outdoor living or entertaining areas. Conveniently situated near major roadways, shopping, dining, and just a short drive to beautiful South Florida beache
Key facts
- Spacious yard
- Major roadways
- No hoa restrictions
Tags
Property features AI
Finance
- Other: Pets allowed with no restrictions
Exterior
- Parking: Driveway and open parking (2 total spaces)
- Security: Storm windows; Insulated windows; Window blinds
- Utilities: Public water; Septic tank sewer; Cable available; Water available
- Home design: Single family residence; One-story; Entry level living area; Faces east; Resale condition
- Construction: Built with CBS construction; Concrete and tile roof
- Exterior features: Covered and open patio; Open porch; Back yard fencing; Fenced yard; Private in-ground vinyl pool (fenced)
Interior
- Kitchen: Dishwasher; Electric range / cooktop; Electric oven; Microwave; Refrigerator; Electric water heater
- Bedrooms: 3 bedrooms on the main level
- Flooring: Carpet; Ceramic tile; Tile; Wood
- Bathrooms: 2 full bathrooms (both on the main level)
- Heating & cooling: Central electric heating; Central air conditioning; Ceiling fans; Electric cooling
- Interior features: Stacked bedroom layout; Decorative fireplace
- Laundry & utility: Laundry room and laundry closet; Washer hookup inside
Neighborhood map
What this means for you Summary
Snapshot
- This is a 3-bed/2.0-bath single-family listed at $360k.
Deal economics
- At list price, monthly cash flow is $22 ($261/yr) — positive.
- The deal already cash-flows at list — no discount required.
- To meet the 1% rule (rent ≥ 1% of price), the offer needs to be $292k (18.8% below list).
- Recommended offer: $292k (18.8% below list) — sets the bar for 1% rule.
Location & tenants
- Location reads 67/100 on livability (#560 in FL) — a middle-class / working-renter tenant base. Strengths: cost of living A+, housing A+, health & safety A; Watch: amenities F, commute F, employment F.
- Palm Beach (suburban): math 46% / reading 53% proficiency, ranked #34 of 73 in FL (top 47%) — families likely to look elsewhere, expect single-tenant / working-renter base with shorter leases.
- Zoned schools: Rolling Green Elementary School (math 21% / reading 26%, grade F, #2,061 of 2,144 statewide, top 96%, 692 students, 88% FRL); Congress Community Middle School (math 21% / reading 28%, grade F, #522 of 571 statewide, top 93%, 988 students, 72% FRL); Boynton Beach Community High (math 13% / reading 25%, grade F, #565 of 667 statewide, top 85%, 1,547 students, 65% FRL) — zoned schools average 75% FRL vs 52% district-wide (23 pts higher); higher-poverty schools than district average — tighter screening recommended.
- Zoned-school proficiency averages 22% at this address vs 50% district-wide (-27 pts) — the specific schools serving this property underperform the Palm Beach average; the district grade overstates school quality for this exact location.
- Market conditions: Rents rising fast (+4.1%/yr); 383 active listings in the ZIP; 40 comparable units currently listed for rent nearby; rentals at typical pace (median 21d on market — plan ~3-4 weeks tenant-placement turnaround); 3,974 units permitted in Palm Beach County in 2024 (1,012 in 5+ unit buildings).
- At $2,923/mo this rent would consume 47% of the median local household income ($74k/yr) (locally 1852% of renters already pay >50% of income on rent) — very limited rent-growth headroom before tenants either downsize or default.
Forward outlook
- Local home prices are declining (-3.0%/yr); year-one equity from $2k of loan paydown is wiped out by about $11k of value loss. Plan a longer hold.
- Palm Beach County population projected at +30% by 2050 — long-run rental-demand tailwind backs the buy-and-hold thesis.
Negotiation context
- It's been on market 76 days — a 6% lower offer ($338k) is reasonable based on typical stale-listing flexibility.
- 3 sale attempts since 19y ago; this cycle's ask has dropped $30k (8%) from the opening price — seller is motivated, your offer sets the floor, not the list.
- Current owner paid $136k; list at $360k implies a 164% gain — meaningful room to come down on a strong offer.
Risks & watch-outs
- Watch-outs: built in 1958 — expect roof / HVAC / electrical / plumbing capex.
- Climate carrying-cost: severe wind risk, 99% chance of damaging wind over 30y; extreme-heat days projected 7→27/yr by 2055 (HVAC capex compounding) — expect insurance premiums to compound above CPI over the hold.
Questions for the listing agent
- It's been on market 76 days. Have you received any prior offers? Is the seller open to a 19% concession, seller financing, or rate buy-down credit?
- Built in 1958 — when were the roof, HVAC, electrical panel, plumbing, and water heater last replaced?
- Why hasn't it sold? Are there any deal-killer items the seller is aware of (foundation, flood, title, zoning, code violations)?
- Is there a deadline driving the sale (1031 exchange, divorce, estate, relocation)? That informs how much negotiation room exists.
- Schools are D-rated, which usually means shorter tenancies and higher turnover. Who's the typical renter profile here, and what's been the actual vacancy rate?
- The area grade is low — what's the realistic commute time and amenity access for the typical tenant pool here? Any planned neighborhood developments (good or bad) we should know about?
- What's the average days-on-market for RENTAL listings here right now (not sales)? A rising rental-DOM trend means longer vacancies and softer asking-rent achievability than the comps imply.
- What's the recent tenant-quality profile in this submarket — average credit score on applications, eviction rate, late-payment / NSF rate, and stable-employment percentage? A property-management company in the area should have these aggregated.
- How much new for-sale + rental construction is in the pipeline within 1–3 miles? Heavy new supply typically softens prices + rents 12–24 months out; constrained supply supports both.
Investment metrics
- 1% rule
- 0.81% ✗
- Cap rate
- 6.37%
- Cash-on-cash
- 0.26%
- DSCR
- 1.01
- GRM
- 10.3
CMA / ARV
- ARV (on-the-fly)
- $494,802
- Comps found
- 1
Show comp detail 1 sale within ~0.75 mi
| Address | Dist | Beds/Ba | Sqft | Sold | Price | $/sf | Match |
|---|---|---|---|---|---|---|---|
| 1402 W Trammell St | 0.47mi | 3/2.0 | 1,508 (+9%) | 22mo | $539,000 | $357 | 45 |
Match score weights: distance 35% · size 25% · config 20% · recency 20%. Top-matched comps best support the ARV.
Projected returns pro-forma
-3.0% appreciation · 4.09% rent growth · sell at horizon
- IRR
- -14.8%
- Equity multiple
- 0.47×
- Total profit
- $-53,789
- Equity at exit
- $53,677
- IRR
- -4.6%
- Equity multiple
- 0.68×
- Total profit
- $-31,782
- Equity at exit
- $31,126
Cash invested: $100,800 (down + closing). Projections, not guarantees.
Landlord ↔ Tenant lean methodology
- Overall (STATE)
- 87 Strongly Landlord-Friendly
- State Florida
- 87 Strongly Landlord-Friendly · R+3
- County
- — inherits STATE
- City
- — inherits STATE
ZIP-level market 33462
- Rents YoY
- 4.1%
- Active inventory
- 383
- Price-to-rent
- 10.3×
Monthly cashflow live
- Estimated rent
- $2,923 high interval (Pro) →
- Mortgage (P&I)
- −$1,888
- Tax from tax record
- −$249 /mo · $2,993/yr
- Insurance
- −$150
- HOA
- −$0
- Vacancy / Maint / Mgmt
- −$614
- Net cashflow
- $22
Break-even live
UW: 25.0% down · 7.5% · 30yr · 1.5% tax · 5.0% vac · 8.0% maint · 8.0% mgmt
Financing live
Cash to close
- Down payment
- $90,000
- Closing costs
- $10,800
- Reserves months
- —
- Total cash needed
- —
Loan-product check · same deal, 3 products live
Conventional
25% down · 7.5% · 30yr
- Down + closing
- —
- Monthly P&I
- —
- Monthly cashflow
- —
- DSCR
- —
- Eligible?
- —
Personal DTI + credit; lowest rate.
DSCR
20% down · 8.5% · 30yr
- Down + closing
- —
- Monthly P&I
- —
- Monthly cashflow
- —
- DSCR
- —
- Eligible?
- —
No personal income docs; deal must DSCR.
Hard money
10% down · 12.0% · 12mo
- Down + closing
- —
- Monthly P&I
- —
- Monthly cashflow
- —
- DSCR
- —
- Eligible?
- —
Short-term bridge; refi at stabilization.
Rent comps 40 comps
| Address | Beds | Baths | Sqft | Rent | $/sqft | DOM | Units | Dist |
|---|---|---|---|---|---|---|---|---|
| 3890 Seacrest Blvd Lantana, FL | 3.0 | 1.0 | 1248 | $2,750 | $2.20 | 24d | 1 | 0.41mi |
| 1400 S Dixie Hwy Lantana, FL | 1.0–3.0 | 1.0–2.0 | 1166 | $4,827 | $4.14 | 3d | 16 | 0.48mi |
| 117 Yacht Club Way #110 Hypoluxo, FL | 2.0 | 2.5 | 1030 | $2,295 | $2.23 | 3d | 1 | 0.49mi |
| 103 Yacht Club Way Hypoluxo, FL | 2.0 | 1.0 | 922 | $2,175 | $2.36 | 7d | 2 | 0.50mi |
| 120 Yacht Club Way #305 Hypoluxo, FL | 2.0 | 2.0 | 1105 | $2,350 | $2.13 | 24d | 1 | 0.53mi |
| 113 Park Ln E Hypoluxo, FL | 3.0 | 2.0 | 1646 | $4,000 | $2.43 | 24d | 1 | 0.53mi |
| 111 Yacht Club Way Hypoluxo, FL | 2.0 | 2.0 | 1036 | $2,275 | $2.20 | 3d | 2 | 0.54mi |
| 123 Yacht Club Way #206 Hypoluxo, FL | 2.0 | 1.0 | 922 | $2,250 | $2.44 | 24d | 1 | 0.54mi |
| 127 Yacht Club Way #109 Hypoluxo, FL | 2.0 | 2.5 | 1030 | $2,500 | $2.43 | 24d | 1 | 0.56mi |
| 110 Half Moon Cir Unit E2 Hypoluxo, FL | 2.0 | 2.0 | 1414 | $2,750 | $1.94 | 24d | 1 | 0.57mi |
| 1036 S 14th St Lantana, FL | 3.0 | 2.0 | 1362 | $3,500 | $2.57 | 24d | 1 | 0.57mi |
| 887 W Perry St Lantana, FL | 3.0 | 1.0 | 1055 | $3,000 | $2.84 | 24d | 1 | 0.57mi |
| 140 Yacht Club Way #206 Hypoluxo, FL | 2.0 | 2.0 | 1036 | $2,450 | $2.36 | 7d | 1 | 0.59mi |
| 135 Yacht Club Way #204 Hypoluxo, FL | 2.0 | 1.0 | 922 | $2,600 | $2.82 | 2d | 1 | 0.59mi |
| 145 Yacht Club Way #112 Hypoluxo, FL | 2.0 | 1.0 | 945 | $2,400 | $2.54 | 24d | 1 | 0.61mi |
| 160 Yacht Club Way #206 Hypoluxo, FL | 2.0 | 2.0 | 1036 | $4,500 | $4.34 | 24d | 1 | 0.62mi |
| 887 Duval St Lantana, FL | 3.0 | 1.0 | 1261 | $3,100 | $2.46 | 17d | 1 | 0.62mi |
| 887 Duval St Lantana, FL | 3.0 | 1.0 | 1261 | $3,100 | $2.46 | 7d | 1 | 0.62mi |
| 157 Yacht Club Way #206 Hypoluxo, FL | 2.0 | 2.0 | 1036 | $2,500 | $2.41 | 13d | 1 | 0.63mi |
| 157 Yacht Club Way Hypoluxo, FL | 2.0 | 1.0–2.0 | 979 | $2,450 | $2.50 | 2d | 2 | 0.63mi |
| 157 Yacht Club Way Hypoluxo, FL | 2.0 | 1.0–2.0 | 979 | $2,350 | $2.40 | 24d | 2 | 0.63mi |
| 129 E Hart St Lantana, FL | 4.0 | 2.0 | 1480 | $6,000 | $4.05 | 24d | 1 | 0.63mi |
| 531 W Perry St Lantana, FL | 2.0 | 1.0 | 1000 | $2,400 | $2.40 | 19d | 1 | 0.64mi |
| 112 Milton St Unit 114 Lantana, FL | 2.0 | 1.0 | 1245 | $2,500 | $2.01 | 7d | 1 | 0.67mi |
| 112 Milton St Unit 114 Lantana, FL | 2.0 | 1.0 | 1245 | $2,500 | $2.01 | 24d | 1 | 0.67mi |
| 917 W Drew St Lantana, FL | 3.0 | 2.0 | 1427 | $3,800 | $2.66 | 24d | 1 | 0.67mi |
| 1202 S Lake Dr #501 Lantana, FL | 2.0 | 2.0 | 1351 | $2,800 | $2.07 | 24d | 1 | 0.68mi |
| 609 S Arnold Ave Lantana, FL | 2.0 | 2.0 | 1076 | $2,900 | $2.70 | 17d | 1 | 0.68mi |
| 200 Scotia Dr #202 Hypoluxo, FL | 3.0 | 2.0 | 1144 | $2,800 | $2.45 | 24d | 1 | 0.69mi |
| 1236 Peak Rd Lantana, FL | 2.0 | 1.0 | 1170 | $2,150 | $1.84 | 24d | 1 | 0.69mi |
| 112 Prospect Rd Lantana, FL | 2.0 | 2.0 | 1377 | $2,500 | $1.82 | 17d | 1 | 0.70mi |
| 900 W Bloxham St Lantana, FL | 3.0 | 1.0 | 925 | $2,141 | $2.31 | 22d | 1 | 0.74mi |
| 814 S Lake Dr Lantana, FL | 3.0 | 2.0 | 1020 | $2,500 | $2.45 | 14d | 1 | 0.75mi |
| 400 Scotia Dr #203 Hypoluxo, FL | 3.0 | 2.0 | 1144 | $2,800 | $2.45 | 7d | 1 | 0.75mi |
| 1000 Scotia Dr #605 Hypoluxo, FL | 2.0 | 1.0 | 901 | $2,190 | $2.43 | 7d | 1 | 0.75mi |
| 611 E Coast Ave Unit B Lantana, FL | 2.0 | 2.0 | 1125 | $2,100 | $1.87 | 20d | 1 | 0.75mi |
| 611 E Coast Ave Unit 2 Lantana, FL | 2.0 | 2.0 | 1125 | $2,050 | $1.82 | 5d | 1 | 0.75mi |
| 422 S Arnold Ave Lantana, FL | 2.0 | 1.0 | 948 | $2,400 | $2.53 | 20d | 1 | 0.80mi |
| 129 Euclid Blvd Lantana, FL | 3.0 | 3.0 | 1280 | $3,300 | $2.58 | 24d | 1 | 0.81mi |
| 977 Miner Rd Lantana, FL | 3.0 | 1.0 | 1100 | $3,195 | $2.90 | 2d | 1 | 0.85mi |
Listing history 23 events
-
2026-06-18days on market $360,000 Active 76 DOM
-
2026-06-17days on market $360,000 Active 75 DOM
-
2026-06-16days on market $360,000 Active 74 DOM
-
2026-06-15days on market $360,000 Active 73 DOM
-
2026-06-13days on market $360,000 Active 71 DOM
-
2026-06-09days on market $360,000 Active 67 DOM
-
2026-06-08days on market $360,000 Active 66 DOM
-
2026-06-07days on market $360,000 Active 65 DOM
-
2026-06-04days on market $360,000 Active 62 DOM
-
2026-06-03days on market $360,000 Active 61 DOM
-
2026-06-02days on market $360,000 Active 60 DOM
-
2026-06-01days on market $360,000 Active 59 DOM
-
2026-06-01price $360,000 Active 58 DOM
-
2026-05-31days on market $370,000 Active 58 DOM
-
2026-05-02price $370,000
-
2026-04-23price $380,000
-
2026-04-03$390,000 Active
-
2016-07-05soldstatus $136,400
-
2016-04-08status Pending
-
2016-04-06historical
-
2016-04-01$139,900 Active
-
2014-10-13historical
-
2007-02-11$224,900
ⓘ Source: listings_history table (triggers on properties + properties_extension) + one-shot
backfill from property_details.listing_events for pre-trigger history.
Tax reassessment forecast FL · Resets to sale price
- Current annual tax
- $2,993 · $249/mo
- Projected year-2 tax
- $2,993 · $249/mo
- Expected delta
- $0/yr ($0/mo · 0.0%)
ⓘ Screening estimate from a state-policy table — verify with the county assessor before closing.
Climate risk First Street
- Flood 1/10 Low FEMA zone X (unshaded) · 0% chance over 30 yrs
- Wildfire 1/10 Low
- Heat 10/10 Extreme 7 d/yr ≥105°F today · 27 d/yr by 30 yrs out
- Wind 10/10 Extreme 99% chance of damaging wind over 30 yrs
- Air quality 2/10 Low 0 unhealthy d/yr today · 2 by 30 yrs out
Nearby sold comps map
Loading sold comps map…
Walkable amenities ~0.75 mi
Loading nearby amenities…
Taxation est. · year 1
- Rental income
- $35,074
- − Mortgage interest
- −$20,166
- − Property taxes
- −$2,993
- − Insurance
- −$1,800
- − Repairs & maintenance
- −$2,806
- − Management
- −$2,806
- − Depreciation
- −$10,473
- Taxable loss
- −$5,969
- Est. tax savings @ 24.0%
- +$1,433
- After-tax cash flow
- $1,694/yr
For passive investors: Depreciation is non-cash, so a rental often shows a tax loss while cash-flowing — sheltering income. Rental losses are passive: they offset passive income freely, and up to $25,000/yr can offset ordinary (W-2) income if you actively participate and your MAGI is under $100k (phasing out to $0 by $150k); unused losses carry forward. On sale, claimed depreciation is recaptured at up to 25%, and gains may owe capital-gains tax (a 1031 exchange can defer both). Figures are a year-1 estimate at your 24.0% rate — not tax advice; consult a CPA.
Schools (NCES district)
- District
- Palm Beach
- NCES district ID
- 1201500
- Math proficiency
- 46% ▼ -16.00%
- Reading proficiency
- 53% ▼ -4.00%
- Median HH income
- $53,943
- Composite
- 42.72/100
- National rank
- #3160
- State rank
- #34 of 73 in FL
Livability — San Castle
- Score
- 67/100
- State rank
- #560
- US rank
- #10706
Category grades
Schools grade is shown separately in the Schools card above.
Census & demographics
- Census place
- San Castle, FL
- County
- Palm Beach County · 1,438,312 people
- Metro
- Miami-Fort Lauderdale-Pompano Beach, FL
- Population (ZIP)
- 33,371
- Household income
- $73,997
- Rent vs Own
- Severe rent burden
- 1852.0
Population outlook (Palm Beach County) Hauer SSP2
- Today (2025)
- 1,637,487 people
- By 2030
- 1,743,255 · +6.5%
- By 2040
- 1,948,712 · +19.0%
- By 2050
- 2,132,979 · +30.3%
- By 2075
- 2,530,027 · +54.5%
- By 2100
- 2,706,979 · +65.3%
Race, ethnicity, and origin ACS 2023
- Neighborhood character
- Diverse neighborhood (Simpson 0.68)
- Race & ethnicity
- White 44% Black 26% Hispanic / Latino 26% Two or more races 11% Asian 2%
- Hispanic origin (detail)
- Mexican 8% Puerto Rican 5% Cuban 3%
- Common ancestry
- Hispanic 14% Romanian 2% Scotch-Irish 2%
- Foreign-born
- 31% · Canada, Jamaica, Dominican Republic
- Languages at home
- 60% English-only · Spanish 20% French/Haitian/Cajun 16% Other Indo-European 1%
Political lean MEDSL · Palm Beach
- 2024 margin
- Toss-up / Even · D 50.0% · R 49.2%
- 2008→2024 swing
- -22.1pp toward R · 2008: 22.9pp · 2024: 0.8pp
- All cycles
- 2024: D+0.8 2020: D+12.8 2016: D+15.3 2012: D+17.0 2008: D+22.9
Not yet ingested
- Civics
- —
Market trends
- HPI YoY
- ▼ -295.48%
- Current HPI
- 361.5391
- Rent YoY
- ▲ 4.09%
- Metro
- Miami-Fort Lauderdale-Pompano Beach, FL
- State GDP YoY
- ▲ 3.28%
- F500 in state
- 36
Industry mix (Fortune 500 HQ in FL)
| Industry | F500 HQs | Revenue |
|---|---|---|
| Industrial Technology | 2 | $29B |
|
||
| Insurance | 2 | $17B |
|
||
| Retail | 1 | $60B |
|
||
| Technology Distribution | 1 | $58B |
|
||
| Homebuilding | 1 | $35B |
|
||
| Technology Manufacturing | 1 | $35B |
|
||
Price history
+64.5% since first listed9 events — show timeline
- 2026-05-02 Price Changed $370,000 Beaches MLS
- 2026-04-23 Price Changed $380,000 Beaches MLS
- 2026-04-03 Listed $390,000 Beaches MLS
- 2016-07-05 Sold (Public Records) $136,400 Public Records
- 2016-04-08 Pending — Beaches MLS
- 2016-04-06 Listing Removed — Beaches MLS
- 2016-04-01 Listed $139,900 Beaches MLS
- 2014-10-13 Listing Removed — Beaches MLS
- 2007-02-11 Listed $224,900 Beaches MLS
Property tax history
+15.1%/yrLatest (2025): $2,993 · +3.4% YoY. Source: county tax records.
Cash-flow waterfall
monthlySold comps — $/sqft
last 12 mo · ≤1 miLoading sold comps…