1850 Mildred St · North Muskegon, MI
Flood risk 1/10 · Minimal
- FEMA flood zone
- X (unshaded)
- Chance of flooding over 30 yrs
- 0.0%
- Est. flood insurance / yr
- $473 – $860
Fire risk 1/10 · Minimal
- Est. fire insurance / yr
- $784 – $1,456
Heat risk 1/10 · Minimal
- Hot days now (above 94°F)
- 7 days/yr
- Hot days in 30 yrs
- 15 days/yr
Wind risk 1/10 · Minimal
- Chance of severe wind over 30 yrs
- —
Air-quality risk 4/10 · Minor
- Unhealthy air days now
- 4 days/yr
- Unhealthy air days in 30 yrs
- 5 days/yr
Risk factors via First Street. Map © Google.
Why this score? — see what drove the D+ grade
The composite is a weighted blend of 9 inputs, each scored 0–100. Each bar is that input's sub-score; the figure is the points it added to the 100-point composite (weight × sub-score).
- Cash flow +12.0/30.0
- Appreciation +10.0/10.0
- ARV discount +8.2/15.0
- 1% rule +4.0/10.0
- Livability +3.9/5.0
- DSCR +3.6/10.0
- Schools +3.2/10.0
- Rent growth +2.5/5.0
- Condition / age +2.5/5.0
$220,000
🖨 Deal sheet 📄 Offer letter ✓ Due diligence
Listing remarks MLS
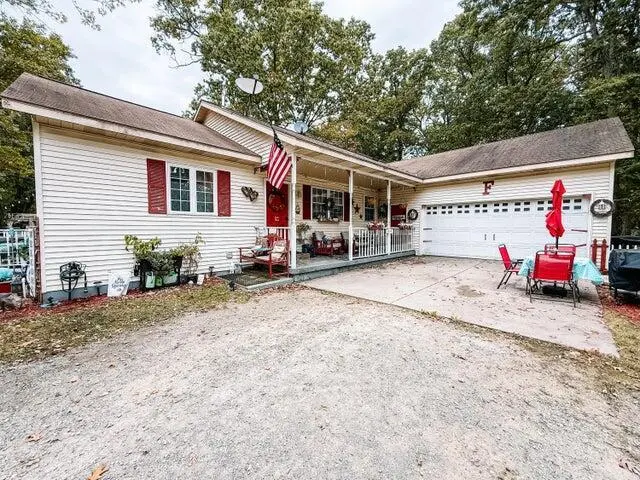
Located in the desirable Reeths-Puffer School District, this home features an open-concept living and dining area with vaulted ceilings that create a bright and welcoming atmosphere. It includes three bedrooms, including a comfortable primary suite, and three full bathrooms. The partially finished basement provides additional living space with an egress window, an office area, and potential for a fourth bedroom. Built with convenience and accessibility in mind, the home includes several features designed to make everyday living easier and more comfortable.
Key facts
- Egress window
- Office area
- 0.25 acre lot
Tags
Property features AI
Exterior
- Parking: Attached 2-car garage
- Utilities: Natural gas connected
- Home design: Ranch-style single-family home; Built in 1996; Public water
- Construction: Vinyl siding; Shingle roof
- Exterior features: Quarter-acre lot
Interior
- Bathrooms: Three full bathrooms
- Heating & cooling: Forced air heating; Has cooling
- Interior features: Insulated windows; Full basement; Seven total rooms
Neighborhood map
What this means for you Summary
Snapshot
- This is a 3-bed/3.0-bath single-family listed at $220k.
Deal economics
- At list price, monthly cash flow is $-51 ($-615/yr) — negative.
- To cash-flow at today's rent, offer at most $211k (4.1% below list).
- To meet the 1% rule (rent ≥ 1% of price), the offer needs to be $198k (10.2% below list).
- Recommended offer: $198k (10.2% below list) — sets the bar for 1% rule.
- Cap rate 6.0% vs local median 4.1% in North Muskegon — top-decile yield for the area; either an underpriced asset or a hidden risk that comps aren't pricing in. Stress-test before assuming the spread holds.
Location & tenants
- Location reads 77/100 on livability (#129 in MI, #3,195 nationally) — a middle-class / working-renter tenant base. Strengths: crime A+, employment A+, cost of living A+; Watch: amenities F, commute F, health & safety F.
- Reeths-Puffer Schools (suburban): math 28% / reading 44% proficiency, ranked #254 of 540 in MI (top 47%) — families likely to look elsewhere, expect single-tenant / working-renter base with shorter leases.
- Market conditions: 142 active listings in the ZIP; 1 comparable units currently listed for rent nearby; 438 units permitted in Muskegon County in 2024 (115 in 5+ unit buildings).
Forward outlook
- In year one you build about $24k of equity ($2k loan paydown + $22k appreciation (10.0% local appreciation)).
- Muskegon County population projected to shrink 8% by 2050 — rents likely to lag national; underwrite the cash flow, not the appreciation.
- At projected returns (10.0% appreciation + 3.0% rent growth), your $62k cash investment doubles in ~3 years — after that, you're playing with house money.
- By year 2, paydown + projected appreciation supports a ~$38k cash-out refi (75% LTV) — recoverable capital for the next deal without selling this one.
Negotiation context
- Only 8 days on market — expect competitive offers; lowballing is unlikely to land.
- 11 sale attempts since 17y ago with the ask held roughly flat each time — persistent listings suggest the price (not the market) is what's stuck; bring a comps-based counter.
- Current owner paid $101k; list at $220k implies a 119% gain — meaningful room to come down on a strong offer.
Questions for the listing agent
- What do current leases actually rent for vs. the listed asking? Can we see a recent rent roll and the last 12 months of T-12 income?
- Is there a deadline driving the sale (1031 exchange, divorce, estate, relocation)? That informs how much negotiation room exists.
- Schools are A-rated — typically a magnet for longer-tenancy family renters. What's the average tenant stay here, and is there a school-zone premium baked into asking?
- The area grade is low — what's the realistic commute time and amenity access for the typical tenant pool here? Any planned neighborhood developments (good or bad) we should know about?
- What's the average days-on-market for RENTAL listings here right now (not sales)? A rising rental-DOM trend means longer vacancies and softer asking-rent achievability than the comps imply.
- What's the recent tenant-quality profile in this submarket — average credit score on applications, eviction rate, late-payment / NSF rate, and stable-employment percentage? A property-management company in the area should have these aggregated.
- How much new for-sale + rental construction is in the pipeline within 1–3 miles? Heavy new supply typically softens prices + rents 12–24 months out; constrained supply supports both.
Investment metrics
- 1% rule
- 0.90% ✗
- Cap rate
- 6.01%
- Cash-on-cash
- -1.00%
- DSCR
- 0.96
- GRM
- 9.3
CMA / ARV
- ARV (median comp)
- $223,411
- List price
- $220,000
- Delta
- -1.53%
- Verdict
- FAIR
- Comps
- 20 within 1.0 mi
Show comp detail 2 sales within ~0.75 mi
| Address | Dist | Beds/Ba | Sqft | Sold | Price | $/sf | Match |
|---|---|---|---|---|---|---|---|
| 571 E River Rd | 0.74mi | 3/2.0 | 1,584 (+2%) | 22mo | $236,100 | $149 | 41 |
| 2288 Central Ave | 0.69mi | 4/2.5 (+1) | 1,766 (+13%) | 15mo | $292,000 | $165 | 26 |
Match score weights: distance 35% · size 25% · config 20% · recency 20%. Top-matched comps best support the ARV.
Projected returns pro-forma
10.0% appreciation · 3.0% rent growth · sell at horizon
- IRR
- 23.6%
- Equity multiple
- 2.89×
- Total profit
- $116,638
- Equity at exit
- $198,193
- IRR
- 21.0%
- Equity multiple
- 6.62×
- Total profit
- $346,218
- Equity at exit
- $427,412
Cash invested: $61,600 (down + closing). Projections, not guarantees.
Landlord ↔ Tenant lean methodology
- Overall (STATE)
- 62 Landlord-Friendly
- State Michigan
- 62 Landlord-Friendly · EVEN
- County
- — inherits STATE
- City
- — inherits STATE
ZIP-level market 49445
- Home prices YoY
- 7.2%
- Active inventory
- 142
- Price-to-rent
- 9.3×
Monthly cashflow live
- Estimated rent
- $1,975 medium interval (Pro) →
- Mortgage (P&I)
- −$1,154
- Tax from tax record
- −$366 /mo · $4,394/yr
- Insurance
- −$92
- HOA
- −$0
- Vacancy / Maint / Mgmt
- −$415
- Net cashflow
- $-51
Break-even live
UW: 25.0% down · 7.5% · 30yr · 1.5% tax · 5.0% vac · 8.0% maint · 8.0% mgmt
Financing live
Cash to close
- Down payment
- $55,000
- Closing costs
- $6,600
- Reserves months
- —
- Total cash needed
- —
Loan-product check · same deal, 3 products live
Conventional
25% down · 7.5% · 30yr
- Down + closing
- —
- Monthly P&I
- —
- Monthly cashflow
- —
- DSCR
- —
- Eligible?
- —
Personal DTI + credit; lowest rate.
DSCR
20% down · 8.5% · 30yr
- Down + closing
- —
- Monthly P&I
- —
- Monthly cashflow
- —
- DSCR
- —
- Eligible?
- —
No personal income docs; deal must DSCR.
Hard money
10% down · 12.0% · 12mo
- Down + closing
- —
- Monthly P&I
- —
- Monthly cashflow
- —
- DSCR
- —
- Eligible?
- —
Short-term bridge; refi at stabilization.
Rent comps 1 comps
| Address | Beds | Baths | Sqft | Rent | $/sqft | DOM | Units | Dist |
|---|---|---|---|---|---|---|---|---|
| 1990 Pappas Rd Muskegon, MI | 3.0 | 2.0 | 1468 | $1,975 | $1.35 | 21d | 1 | 1.24mi |
Listing history 31 events
-
2026-05-11$220,000 Active 562-char remark
Show marketing remark (562 chars)
Located in the desirable Reeths-Puffer School District, this home features an open-concept living and dining area with vaulted ceilings that create a bright and welcoming atmosphere. It includes three bedrooms, including a comfortable primary suite, and three full bathrooms. The partially finished basement provides additional living space with an egress window, an office area, and potential for a fourth bedroom. Built with convenience and accessibility in mind, the home includes several features designed to make everyday living easier and more comfortable.
-
2026-05-11$220,000 Active
Show marketing remark (562 chars)
Located in the desirable Reeths-Puffer School District, this home features an open-concept living and dining area with vaulted ceilings that create a bright and welcoming atmosphere. It includes three bedrooms, including a comfortable primary suite, and three full bathrooms. The partially finished basement provides additional living space with an egress window, an office area, and potential for a fourth bedroom. Built with convenience and accessibility in mind, the home includes several features designed to make everyday living easier and more comfortable.
-
2026-01-12status Pending
-
2026-01-12status Pending
-
2026-01-09historical
-
2026-01-09historical
-
2026-01-07price $215,000
-
2026-01-06price $215,000
-
2026-01-06price $215,000
-
2025-11-03price $230,000
-
2025-11-03price $230,000
-
2025-11-03price $230,000
-
2025-10-10$240,000 Active
-
2025-10-10$240,000 Active
-
2016-09-07soldstatus $100,600
-
2016-09-01historical
-
2016-08-31soldstatus $100,600
-
2016-08-31soldstatus $100,600 Sold
-
2016-06-20status Pending
-
2016-05-09$99,900 Active
-
2016-05-09$99,900
-
2015-10-16historical
-
2015-09-08status Pending
-
2015-09-03historical
-
2015-09-03$99,900 Active
-
2015-03-25$99,900
-
2014-09-26historical
-
2010-12-14historical
-
2009-12-14$99,900
-
2009-12-14$99,900
ⓘ Source: listings_history table (triggers on properties + properties_extension) + one-shot
backfill from property_details.listing_events for pre-trigger history.
Tax reassessment forecast MI · Partial reset (capped growth)
- Current annual tax
- $4,394 · $366/mo
- Projected year-2 tax
- $4,394 · $366/mo
- Expected delta
- $0/yr ($0/mo · 0.0%)
ⓘ Screening estimate from a state-policy table — verify with the county assessor before closing.
Climate risk First Street
- Flood 1/10 Low FEMA zone X (unshaded) · 0% chance over 30 yrs
- Wildfire 1/10 Low
- Heat 1/10 Low 7 d/yr ≥94°F today · 15 d/yr by 30 yrs out
- Wind 1/10 Low
- Air quality 4/10 Moderate 4 unhealthy d/yr today · 5 by 30 yrs out
Nearby sold comps map
Loading sold comps map…
Walkable amenities ~0.75 mi
Loading nearby amenities…
Taxation est. · year 1
- Rental income
- $23,700
- − Mortgage interest
- −$12,323
- − Property taxes
- −$4,394
- − Insurance
- −$1,100
- − Repairs & maintenance
- −$1,896
- − Management
- −$1,896
- − Depreciation
- −$6,400
- Taxable loss
- −$4,309
- Est. tax savings @ 24.0%
- +$1,034
- After-tax cash flow
- $419/yr
For passive investors: Depreciation is non-cash, so a rental often shows a tax loss while cash-flowing — sheltering income. Rental losses are passive: they offset passive income freely, and up to $25,000/yr can offset ordinary (W-2) income if you actively participate and your MAGI is under $100k (phasing out to $0 by $150k); unused losses carry forward. On sale, claimed depreciation is recaptured at up to 25%, and gains may owe capital-gains tax (a 1031 exchange can defer both). Figures are a year-1 estimate at your 24.0% rate — not tax advice; consult a CPA.
Schools (NCES district)
- District
- Reeths-Puffer Schools
- NCES district ID
- 2629540
- Math proficiency
- 28% ▼ -9.00%
- Reading proficiency
- 44% ▼ -4.00%
- Median HH income
- $55,223
- Composite
- 31.62/100
- National rank
- #5942
- State rank
- #254 of 540 in MI
Livability — North Muskegon
- Score
- 77/100
- State rank
- #129
- US rank
- #3195
Category grades
Schools grade is shown separately in the Schools card above.
Census & demographics
- Population (ZIP)
- 21,090
Population outlook (Muskegon County) Hauer SSP2
- Today (2025)
- 174,032 people
- By 2030
- 173,365 · -0.4%
- By 2040
- 168,877 · -3.0%
- By 2050
- 160,306 · -7.9%
- By 2075
- 134,426 · -22.8%
- By 2100
- 98,836 · -43.2%
Race, ethnicity, and origin ACS 2023
- Neighborhood character
- Predominantly White (86%)
- Race & ethnicity
- White 86% Two or more races 8% Hispanic / Latino 6% Black 2%
- Hispanic origin (detail)
- Mexican 5%
- Common ancestry
- Iranian 10% Romanian 4% Italian 3%
- Foreign-born
- 2% · Canada
- Languages at home
- 96% English-only · Spanish 4%
Political lean MEDSL · Muskegon
- 2024 margin
- Toss-up / Even · D 48.4% · R 50.2% · Other 1.5%
- 2008→2024 swing
- -31.1pp toward R · 2008: 29.3pp · 2024: -1.8pp
- All cycles
- 2024: R+1.8 2020: D+0.6 2016: D+0.9 2012: D+17.8 2008: D+29.3
Not yet ingested
- Civics
- —
Market trends
- HPI YoY
- ▲ 40.82%
- Current HPI
- 605.31
- Rent YoY
- —
- Metro
- —
- State GDP YoY
- ▲ 1.37%
- F500 in state
- 28
Industry mix (Fortune 500 HQ in MI)
| Industry | F500 HQs | Revenue |
|---|---|---|
| Automotive Parts | 3 | $48B |
|
||
| Automotive | 2 | $372B |
|
||
| Chemicals | 1 | $45B |
|
||
| Automotive Retail | 1 | $29B |
|
||
| Healthcare / Medical Devices | 1 | $23B |
|
||
| Automotive Technology | 1 | $20B |
|
||
Price history
+120.2% since first listed34 events — show timeline
- 2026-05-19 Pending — MiRealSource-MiMLS
- 2026-05-19 Pending — REALCOMP
- 2026-05-19 Pending — SW Michigan MLS
- 2026-05-11 Listed $220,000 REALCOMP
- 2026-05-11 Listed $220,000 SW Michigan MLS
- 2026-05-11 Listed $220,000 MiRealSource-MiMLS
- 2026-01-12 Pending — REALCOMP
- 2026-01-12 Pending — MiRealSource-MiMLS
- 2026-01-09 Listing Removed — MiRealSource-MiMLS
- 2026-01-09 Listing Removed — REALCOMP
- 2026-01-07 Price Changed $215,000 MiRealSource-MiMLS
- 2026-01-06 Price Changed $215,000 REALCOMP
- 2026-01-06 Price Changed $215,000 SW Michigan MLS
- 2025-11-03 Price Changed $230,000 MiRealSource-MiMLS
- 2025-11-03 Price Changed $230,000 REALCOMP
- 2025-11-03 Price Changed $230,000 SW Michigan MLS
- 2025-10-10 Listed $240,000 REALCOMP
- 2025-10-10 Listed $240,000 MiRealSource-MiMLS
- 2016-09-07 Sold (Public Records) $100,600 Public Records
- 2016-09-01 Listing Removed — SW Michigan MLS
- 2016-08-31 Sold (MLS) $100,600 SW Michigan MLS
- 2016-08-31 Sold (MLS) $100,600 REALCOMP
- 2016-06-20 Pending — SW Michigan MLS
- 2016-05-09 Listed $99,900 SW Michigan MLS
- 2016-05-09 Listed $99,900 REALCOMP
- 2015-10-16 Listing Removed — REALCOMP
- 2015-09-08 Pending — SW Michigan MLS
- 2015-09-03 Listing Removed — SW Michigan MLS
- 2015-09-03 Listed $99,900 SW Michigan MLS
- 2015-03-25 Listed $99,900 REALCOMP
- 2014-09-26 Listing Removed — SW Michigan MLS
- 2010-12-14 Listing Removed — REALCOMP
- 2009-12-14 Listed $99,900 REALCOMP
- 2009-12-14 Listed $99,900 SW Michigan MLS
Property tax history
+3.7%/yrLatest (2025): $4,394 · +16.5% YoY. Source: county tax records.
Cash-flow waterfall
monthlySold comps — $/sqft
last 12 mo · ≤1 miLoading sold comps…