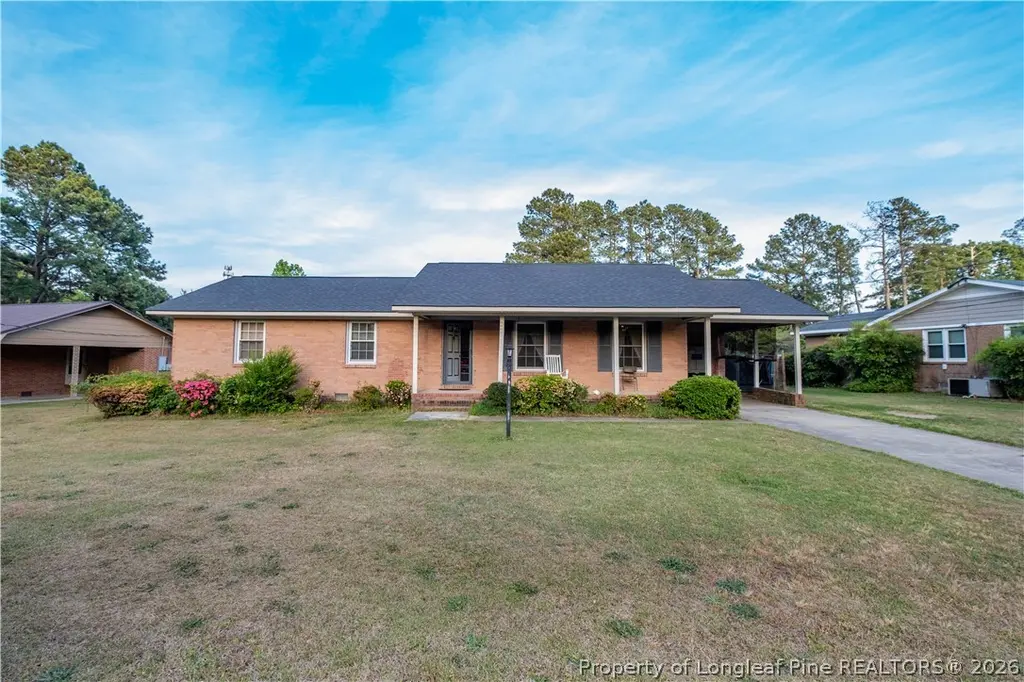
518 College Dr · Raeford, NC
Flood risk 1/10 · Minimal
- FEMA flood zone
- X (unshaded)
- Chance of flooding over 30 yrs
- 0.0%
- Est. flood insurance / yr
- $507 – $1,088
Fire risk 5/10 · Moderate
- Est. fire insurance / yr
- $906 – $1,684
Heat risk 7/10 · Major
- Hot days now (above 106°F)
- 7 days/yr
- Hot days in 30 yrs
- 16 days/yr
Wind risk 6/10 · Moderate
- Chance of severe wind over 30 yrs
- 72.0%
Air-quality risk 1/10 · Minimal
- Unhealthy air days now
- 0 days/yr
- Unhealthy air days in 30 yrs
- 0 days/yr
Risk factors via First Street. Map © Google.
Why this score? — see what drove the B- grade
The composite is a weighted blend of 9 inputs, each scored 0–100. Each bar is that input's sub-score; the figure is the points it added to the 100-point composite (weight × sub-score).
- Cash flow +26.1/30.0
- ARV discount +15.0/15.0
- DSCR +8.8/10.0
- 1% rule +5.8/10.0
- Livability +3.8/5.0
- Schools +3.2/10.0
- Rent growth +3.0/5.0
- Condition / age +2.5/5.0
- Appreciation +0.0/10.0
$160,000
🖨 Deal sheet 📄 Offer letter ✓ Due diligence
Listing remarks MLS
Property sold 'AS IS, WHERE IS WITH ALL FAULTS'. House has Living room and Dining room combination. House has 'Concrete Driveway'. *** PRICE REDUCED $10,000 *** Seller will pay up to $2,000 in closing costs Turn Right onto Cole Avenue (Just past W Central Avenue and a CVS Pharmacy is on the corner) go 0.2 miles. Take the 1st Right onto College Drive; 518 College Drive is 0.3 miles on the right (If you reach Diehl Street you've gone about 0.1 mile too far).
Key facts
- 0.54 acre lot
- Parking
- Built 1966
Property features AI
Exterior
- Parking: Attached carport; 1 covered parking space; 1 carport space
- Utilities: Public water; Holding tank or septic sewer
- Home design: Single family residence; One-story
- Construction: Brick construction
- Exterior features: Deck; Covered patio/porch; Porch; Storm doors; Back yard fencing; Level topography/lot
Interior
- Kitchen: Refrigerator; Microwave; Cooktop; Range; Range hood; Stainless steel appliances
- Bedrooms: 4 total rooms (includes bedrooms and living areas)
- Flooring: Carpet; Hardwood; Tile; Vinyl
- Bathrooms: 1 full bathroom; 1 half bathroom
- Heating & cooling: Central air (electric); Electric forced air heating
- Interior features: Eat-in kitchen; Storage; Window coverings and blinds; Crawl space basement
- Laundry & utility: Washer and dryer in unit
Neighborhood map
What this means for you Summary
Snapshot
- This is a 3-bed/1.5-bath single-family listed at $160k.
Deal economics
- At list price, monthly cash flow is $404 ($5k/yr) — positive.
- The deal already cash-flows at list — no discount required.
- Meets the 1% rule at list price ($2k rent vs $160k).
- Recommended offer: $155k (3.0% below list) — sets the bar for market timing.
- Cap rate 9.3% vs local median 5.4% in Raeford — top-decile yield for the area; either an underpriced asset or a hidden risk that comps aren't pricing in. Stress-test before assuming the spread holds.
Location & tenants
- Location reads 76/100 on livability (#39 in NC, #3,562 nationally) — a middle-class / working-renter tenant base. Strengths: cost of living A+, housing A+, health & safety A+; Watch: amenities D, commute F, employment F.
- Hoke County Schools (suburban): math 35% / reading 40% proficiency, ranked #123 of 178 in NC (top 69%) — families likely to look elsewhere, expect single-tenant / working-renter base with shorter leases.
- Zoned schools: West Hoke Middle (math 23% / reading 32%, grade F, #368 of 475 statewide, top 78%, 576 students, 100% FRL); Hoke County High (math 42% / reading 44%, grade F, #372 of 535 statewide, top 69%, 2,060 students, 100% FRL) — zoned schools average 100% FRL vs 57% district-wide (43 pts higher); higher-poverty schools than district average — tighter screening recommended.
- Market conditions: Rents rising (+1.9%/yr); 566 active listings in the ZIP; 6 comparable units currently listed for rent nearby; rentals at typical pace (median 24d on market — plan ~3-4 weeks tenant-placement turnaround); 685 units permitted in Hoke County in 2024 (0 in 5+ unit buildings).
- This rent runs 31% of the median local income ($66k/yr) — at the standard rent-burdened threshold; future hikes will face affordability resistance.
Forward outlook
- Local home prices are declining (-3.0%/yr); year-one equity from $1k of loan paydown is wiped out by about $5k of value loss. Plan a longer hold.
- Hoke County population projected at +36% by 2050 — long-run rental-demand tailwind backs the buy-and-hold thesis.
Negotiation context
- It's been on market 42 days — a 3% lower offer ($155k) is reasonable based on typical stale-listing flexibility.
- 2 sale attempts since 13y ago; this cycle's ask has dropped $10k (6%) from the opening price — seller is motivated, your offer sets the floor, not the list.
- Current owner paid $75k; list at $160k implies a 113% gain — meaningful room to come down on a strong offer.
Risks & watch-outs
- Climate carrying-cost: major wind risk, 72% chance of damaging wind over 30y; moderate wildfire risk; extreme-heat days projected 7→16/yr by 2055 (HVAC capex compounding) — expect insurance premiums to compound above CPI over the hold.
Questions for the listing agent
- It's been on market 42 days. Have you received any prior offers? Is the seller open to a 3% concession, seller financing, or rate buy-down credit?
- Built in 1966 — when were the roof, HVAC, electrical panel, plumbing, and water heater last replaced?
- Is there a deadline driving the sale (1031 exchange, divorce, estate, relocation)? That informs how much negotiation room exists.
- Schools are D-rated, which usually means shorter tenancies and higher turnover. Who's the typical renter profile here, and what's been the actual vacancy rate?
- What's the average days-on-market for RENTAL listings here right now (not sales)? A rising rental-DOM trend means longer vacancies and softer asking-rent achievability than the comps imply.
- What's the recent tenant-quality profile in this submarket — average credit score on applications, eviction rate, late-payment / NSF rate, and stable-employment percentage? A property-management company in the area should have these aggregated.
- How much new for-sale + rental construction is in the pipeline within 1–3 miles? Heavy new supply typically softens prices + rents 12–24 months out; constrained supply supports both.
Investment metrics
- 1% rule
- 1.08% ✓
- Cap rate
- 9.32%
- Cash-on-cash
- 10.81%
- DSCR
- 1.48
- GRM
- 7.7
CMA / ARV
- ARV (on-the-fly)
- $232,560
- Comps found
- 12
Show comp detail 12 sales within ~0.75 mi
| Address | Dist | Beds/Ba | Sqft | Sold | Price | $/sf | Match |
|---|---|---|---|---|---|---|---|
| 833 W Prospect Ave | 0.25mi | 3/2.0 | 1,377 (+1%) | 6mo | $65,000 | $47 | 80 |
| 125 W Palmer St | 0.57mi | 3/2.0 | 1,352 (-1%) | 2mo | $175,000 | $129 | 68 |
| 281 Apple Tree Cir | 0.23mi | 3/2.0 | 1,524 (+12%) | 6mo | $260,000 | $171 | 62 |
| 245 Apple Tree Cir | 0.22mi | 3/2.0 | 1,554 (+14%) | 6mo | $255,000 | $164 | 59 |
| 109 N Dickson St | 0.49mi | 3/1.5 | 1,483 (+9%) | 7mo | $203,000 | $137 | 56 |
| 102 Will Johnson Rd | 0.19mi | 3/2.0 | 1,550 (+14%) | 13mo | $260,000 | $168 | 55 |
| 393 Gable Dr | 0.57mi | 3/2.0 | 1,468 (+8%) | 4mo | $259,900 | $177 | 55 |
| 261 W Palmer St | 0.43mi | 3/2.5 | 1,533 (+13%) | 2mo | $270,000 | $176 | 53 |
| 242 Westminster Dr | 0.73mi | 3/2.0 | 1,421 (+4%) | 8mo | $255,000 | $179 | 50 |
| 150 Mayor Ct | 0.64mi | 3/2.0 | 1,450 (+7%) | 13mo | $263,900 | $182 | 46 |
| 212 N Roberts St | 0.56mi | 2/1.0 (-1) | 1,468 (+8%) | 11mo | $175,000 | $119 | 44 |
| 167 Westminster Dr | 0.65mi | 3/2.0 | 1,500 (+10%) | 10mo | $267,000 | $178 | 42 |
Match score weights: distance 35% · size 25% · config 20% · recency 20%. Top-matched comps best support the ARV.
Projected returns pro-forma
-3.0% appreciation · 1.92% rent growth · sell at horizon
- IRR
- -1.3%
- Equity multiple
- 0.95×
- Total profit
- $-2,136
- Equity at exit
- $23,857
- IRR
- 7.3%
- Equity multiple
- 1.53×
- Total profit
- $23,530
- Equity at exit
- $13,834
Cash invested: $44,800 (down + closing). Projections, not guarantees.
Landlord ↔ Tenant lean methodology
- Overall (STATE)
- 85 Strongly Landlord-Friendly
- State North Carolina
- 85 Strongly Landlord-Friendly · R+3
- County
- — inherits STATE
- City
- — inherits STATE
ZIP-level market 28376
- Home prices YoY
- -24.0%
- Rents YoY
- 1.9%
- Active inventory
- 566
- Price-to-rent
- 7.7×
Monthly cashflow live
- Estimated rent
- $1,730 high interval (Pro) →
- Mortgage (P&I)
- −$839
- Tax from tax record
- −$57 /mo · $688/yr
- Insurance
- −$67
- HOA
- −$0
- Vacancy / Maint / Mgmt
- −$363
- Net cashflow
- $404
Break-even live
UW: 25.0% down · 7.5% · 30yr · 1.5% tax · 5.0% vac · 8.0% maint · 8.0% mgmt
Financing live
Cash to close
- Down payment
- $40,000
- Closing costs
- $4,800
- Reserves months
- —
- Total cash needed
- —
Loan-product check · same deal, 3 products live
Conventional
25% down · 7.5% · 30yr
- Down + closing
- —
- Monthly P&I
- —
- Monthly cashflow
- —
- DSCR
- —
- Eligible?
- —
Personal DTI + credit; lowest rate.
DSCR
20% down · 8.5% · 30yr
- Down + closing
- —
- Monthly P&I
- —
- Monthly cashflow
- —
- DSCR
- —
- Eligible?
- —
No personal income docs; deal must DSCR.
Hard money
10% down · 12.0% · 12mo
- Down + closing
- —
- Monthly P&I
- —
- Monthly cashflow
- —
- DSCR
- —
- Eligible?
- —
Short-term bridge; refi at stabilization.
Rent comps 6 comps
| Address | Beds | Baths | Sqft | Rent | $/sqft | DOM | Units | Dist |
|---|---|---|---|---|---|---|---|---|
| 113 N Wright St Raeford, NC | 3.0 | 2.0 | 1585 | $1,550 | $0.98 | 14d | 1 | 0.43mi |
| 211 N Roberts St Raeford, NC | 2.0 | 1.0 | 965 | $1,475 | $1.53 | 23d | 1 | 0.51mi |
| 110 E 7th Ave Raeford, NC | 2.0 | 2.0 | 1064 | $1,200 | $1.13 | 14d | 1 | 1.06mi |
| 125 Burgess Ln Raeford, NC | 3.0 | 2.5 | 1460 | $1,600 | $1.10 | 23d | 1 | 1.22mi |
| 122 Sherman Ct Unit 122 Raeford, NC | 3.0 | 2.5 | 1400 | $1,600 | $1.14 | 23d | 1 | 1.25mi |
| 916 Stevens St Raeford, NC | 3.0 | 2.5 | 1646 | $1,900 | $1.15 | 23d | 1 | 1.37mi |
Listing history 6 events
-
2026-05-30status $160,000 Pending 42 DOM
-
2026-05-17price $160,000
-
2026-04-17$170,000 Active
-
2013-11-01soldstatus $75,000
-
2013-10-31soldstatus $75,000 460-char remark
Show marketing remark (460 chars)
Property sold 'AS IS, WHERE IS WITH ALL FAULTS'. House has Living room and Dining room combination. House has 'Concrete Driveway'. *** PRICE REDUCED $10,000 *** Seller will pay up to $2,000 in closing costs Turn Right onto Cole Avenue (Just past W Central Avenue and a CVS Pharmacy is on the corner) go 0.2 miles. Take the 1st Right onto College Drive; 518 College Drive is 0.3 miles on the right (If you reach Diehl Street you've gone about 0.1 mile too far).
-
2013-04-30$75,000 460-char remark
Show marketing remark (460 chars)
Property sold 'AS IS, WHERE IS WITH ALL FAULTS'. House has Living room and Dining room combination. House has 'Concrete Driveway'. *** PRICE REDUCED $10,000 *** Seller will pay up to $2,000 in closing costs Turn Right onto Cole Avenue (Just past W Central Avenue and a CVS Pharmacy is on the corner) go 0.2 miles. Take the 1st Right onto College Drive; 518 College Drive is 0.3 miles on the right (If you reach Diehl Street you've gone about 0.1 mile too far).
ⓘ Source: listings_history table (triggers on properties + properties_extension) + one-shot
backfill from property_details.listing_events for pre-trigger history.
Tax reassessment forecast NC · Resets to sale price
- Current annual tax
- $688 · $57/mo
- Projected year-2 tax
- $1,312 · $109/mo
- Expected delta
- +$624/yr (+$52/mo · 90.6%)
ⓘ Screening estimate from a state-policy table — verify with the county assessor before closing.
Climate risk First Street
- Flood 1/10 Low FEMA zone X (unshaded) · 0% chance over 30 yrs
- Wildfire 5/10 Major
- Heat 7/10 Severe 7 d/yr ≥106°F today · 16 d/yr by 30 yrs out
- Wind 6/10 Major 72% chance of damaging wind over 30 yrs
- Air quality 1/10 Low 0 unhealthy d/yr today · 0 by 30 yrs out
Nearby sold comps map
Loading sold comps map…
Walkable amenities ~0.75 mi
Loading nearby amenities…
Taxation est. · year 1
- Rental income
- $20,762
- − Mortgage interest
- −$8,962
- − Property taxes
- −$688
- − Insurance
- −$800
- − Repairs & maintenance
- −$1,661
- − Management
- −$1,661
- − Depreciation
- −$4,655
- Taxable income
- $2,334
- Est. tax owed @ 24.0%
- −$560
- After-tax cash flow
- $4,284/yr
For passive investors: Depreciation is non-cash, so a rental often shows a tax loss while cash-flowing — sheltering income. Rental losses are passive: they offset passive income freely, and up to $25,000/yr can offset ordinary (W-2) income if you actively participate and your MAGI is under $100k (phasing out to $0 by $150k); unused losses carry forward. On sale, claimed depreciation is recaptured at up to 25%, and gains may owe capital-gains tax (a 1031 exchange can defer both). Figures are a year-1 estimate at your 24.0% rate — not tax advice; consult a CPA.
Schools (NCES district)
- District
- Hoke County Schools
- NCES district ID
- 3702250
- Math proficiency
- 35% ▼ -1.00%
- Reading proficiency
- 40% ▲ 1.00%
- Median HH income
- $43,896
- Composite
- 31.82/100
- National rank
- #5880
- State rank
- #123 of 178 in NC
Livability — Raeford
- Score
- 76/100
- State rank
- #39
- US rank
- #3562
Category grades
Schools grade is shown separately in the Schools card above.
Census & demographics
- Census place
- Raeford, NC
- County
- Hoke County · 44,880 people
- City population
- 44,880
- Metro
- Fayetteville, NC
- Population (ZIP)
- 44,880
- Household income
- $66,471
- Rent vs Own
- Severe rent burden
- 897.0
Population outlook (Hoke County) Hauer SSP2
- Today (2025)
- 63,354 people
- By 2030
- 68,361 · +7.9%
- By 2040
- 78,074 · +23.2%
- By 2050
- 86,384 · +36.4%
- By 2075
- 99,517 · +57.1%
- By 2100
- 98,939 · +56.2%
Race, ethnicity, and origin ACS 2023
- Neighborhood character
- Highly diverse neighborhood (Simpson 0.71)
- Race & ethnicity
- White 38% Black 35% Hispanic / Latino 15% Two or more races 9% Native American 3% Asian 1%
- Hispanic origin (detail)
- Mexican 7% Puerto Rican 4%
- Common ancestry
- Slovak 2% Romanian 1% Italian 1%
- Foreign-born
- 6% · Canada, Vietnam
- Languages at home
- 89% English-only · Spanish 8% French/Haitian/Cajun 1%
Political lean MEDSL · Hoke
- 2024 margin
- Lean D (+5.9) · D 52.4% · R 46.4% · Other 1.2%
- 2008→2024 swing
- -12.8pp toward R · 2008: 18.8pp · 2024: 5.9pp
- All cycles
- 2024: D+5.9 2020: D+10.9 2016: D+10.8 2012: D+19.0 2008: D+18.8
Not yet ingested
- Civics
- —
Market trends
- HPI YoY
- ▼ -53.30%
- Current HPI
- 169.1801
- Rent YoY
- ▲ 1.92%
- Metro
- Fayetteville, NC
- State GDP YoY
- ▲ 3.28%
- F500 in state
- 26
Industry mix (Fortune 500 HQ in NC)
| Industry | F500 HQs | Revenue |
|---|---|---|
| Financial Services | 2 | $213B |
|
||
| Retail | 2 | $95B |
|
||
| Industrial Conglomerate | 1 | $38B |
|
||
| Metals / Steel | 1 | $35B |
|
||
| Utilities | 1 | $30B |
|
||
| Industrial Machinery | 1 | $19B |
|
||
Price history
+113.3% since first listed5 events — show timeline
- 2026-05-17 Price Changed $160,000 LPRMLS
- 2026-04-17 Listed $170,000 LPRMLS
- 2013-11-01 Sold (Public Records) $75,000 Public Records
- 2013-10-31 Sold (MLS) $75,000 Hive MLS
- 2013-04-30 Listed $75,000 Hive MLS
Property tax history
+0.8%/yrLatest (2025): $688 · +0.0% YoY. Source: county tax records.
Cash-flow waterfall
monthlySold comps — $/sqft
last 12 mo · ≤1 miLoading sold comps…