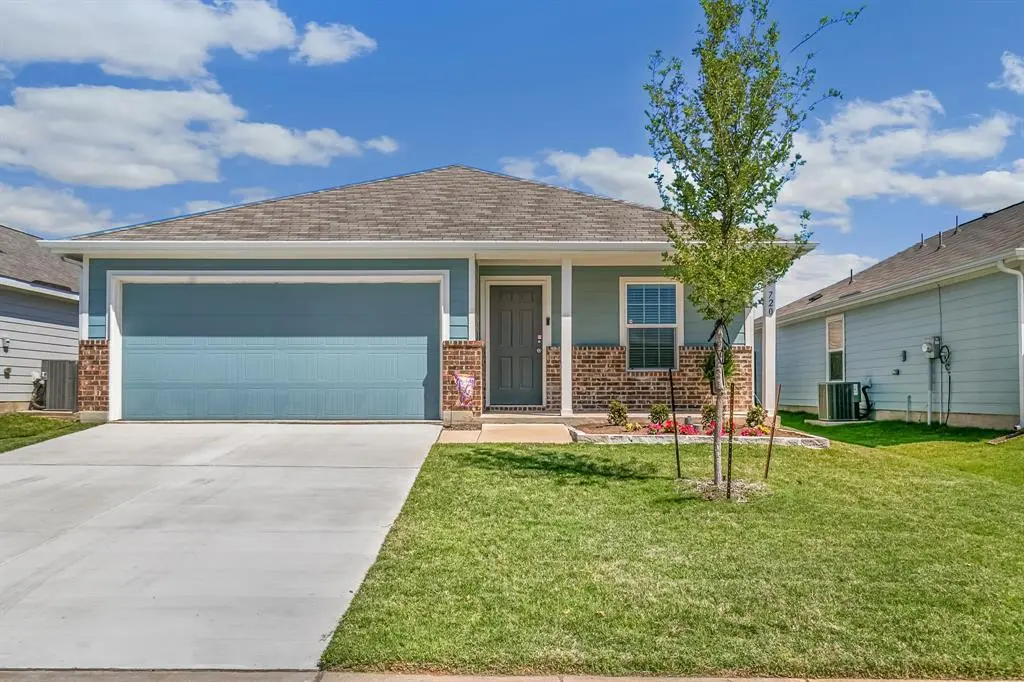
720 Autumnwood Way · Wylie, TX
Flood risk 1/10 · Minimal
- FEMA flood zone
- X (unshaded)
- Chance of flooding over 30 yrs
- 0.0%
- Est. flood insurance / yr
- $507 – $1,088
Fire risk 2/10 · Minimal
- Est. fire insurance / yr
- $1,222 – $2,270
Heat risk 8/10 · Major
- Hot days now (above 110°F)
- 7 days/yr
- Hot days in 30 yrs
- 25 days/yr
Wind risk 6/10 · Moderate
- Chance of severe wind over 30 yrs
- 27.0%
Air-quality risk 3/10 · Minor
- Unhealthy air days now
- 3 days/yr
- Unhealthy air days in 30 yrs
- 3 days/yr
Risk factors via First Street. Map © Google.
Why this score? — see what drove the D+ grade
The composite is a weighted blend of 9 inputs, each scored 0–100. Each bar is that input's sub-score; the figure is the points it added to the 100-point composite (weight × sub-score).
- ARV discount +15.0/15.0
- Cash flow +11.0/30.0
- 1% rule +5.3/10.0
- Schools +4.2/10.0
- Condition / age +3.8/5.0
- Livability +3.5/5.0
- DSCR +3.2/10.0
- Rent growth +2.2/5.0
- Appreciation +0.0/10.0
$180,000
🖨 Deal sheet 📄 Offer letter ✓ Due diligence
Listing remarks
Tucked into a quiet, welcoming neighborhood of Bridgewater in Princeton, this beautifully maintained home at 720 Autumnwood Way offers the perfect blend of comfort, style, and everyday functionality. From the moment you arrive, you’ll appreciate the inviting curb appeal with a charming front porch and well-kept exterior including brand new driveway that set the tone for what’s inside. Step through the front door into a light-filled interior featuring an open-concept layout designed for modern living. The spacious living area flows seamlessly into the kitchen and dining spaces, creating an ideal setting for both entertaining and daily life. Kitchen includes ample counter space, n
Key facts
- Ample counter space
- Charming front porch
- Walk-in closet
Tags
Property features AI
Finance
- Other: Community amenities include clubhouse, community pool, pool, fitness center, park, playground, fishing, greenbelt, jogging/bike path, and sidewalks
- Financial info: Association fee collected annually
- HOA & community: Mandatory HOA; Annual association fee; HOA provides full use of facilities, grounds maintenance, and management services; HOA management: Insight Association Management AAMC
Exterior
- Parking: Attached 2-car garage; Covered parking for 2 vehicles; Driveway
- Utilities: MUD water; MUD sewer; Municipal Utility District service
- Home design: Single family residence; Attached property; One story; Composition roof; Slab foundation; Built in 2020
- Construction: Composition roof; Slab foundation; Built in 2020
- Exterior features: Front covered porch; Covered patio; Wood privacy fencing in back yard
Interior
- Kitchen: Built-in cabinets; Granite countertops; Pantry; Water line to refrigerator; Dishwasher; Disposal; Electric range; Microwave; Refrigerator
- Bedrooms: 2 bedrooms (both on the main level); Primary bedroom includes walk-in closet
- Flooring: Luxury vinyl plank flooring
- Bathrooms: 1 full bathroom
- Heating & cooling: Central air; Electric heating; Electric cooling
- Interior features: Open floorplan; Pantry; High-speed internet available; Window coverings; One living area; One dining area; Total of 6 rooms; Levels: One
- Laundry & utility: Full-size washer/dryer area; Washer hookup; Washer and dryer included; Utility closet in laundry
Neighborhood map
What this means for you Summary
Snapshot
- This is a 2-bed/1.0-bath single-family listed at $180k. Condition is rated good.
Deal economics
- At list price, monthly cash flow is $-75 ($-898/yr) — negative.
- To cash-flow at today's rent, offer at most $167k (7.3% below list).
- Meets the 1% rule at list price ($2k rent vs $180k).
- Recommended offer: $167k (7.3% below list) — sets the bar for cash-flow.
- Cap rate 5.8% vs local median 4.0% in Wylie — top-decile yield for the area; either an underpriced asset or a hidden risk that comps aren't pricing in. Stress-test before assuming the spread holds.
Location & tenants
- Location reads 69/100 on livability (#419 in TX) — a middle-class / working-renter tenant base. Strengths: crime A+, employment A+, housing A+; Watch: amenities F, commute F, health & safety F.
- Princeton ISD (suburban): math 51% / reading 47% proficiency, ranked #188 of 826 in TX (top 23%) — families likely to look elsewhere, expect single-tenant / working-renter base with shorter leases.
- Zoned schools: Mayfield El (609 students, 73% FRL) — zoned schools average 73% FRL vs 56% district-wide (17 pts higher); higher-poverty schools than district average — tighter screening recommended.
- Market conditions: Rents soft (-1.0%/yr); 1404 active listings in the ZIP; 40 comparable units currently listed for rent nearby; rentals at typical pace (median 21d on market — plan ~3-4 weeks tenant-placement turnaround); solid renter incomes; 19,194 units permitted in Collin County in 2024 (3,988 in 5+ unit buildings).
Forward outlook
- Local home prices are declining (-3.0%/yr); year-one equity from $1k of loan paydown is wiped out by about $5k of value loss. Plan a longer hold.
- Collin County population projected at +60% by 2050 — long-run rental-demand tailwind backs the buy-and-hold thesis.
Negotiation context
- It's been on market 48 days — a 3% lower offer ($175k) is reasonable based on typical stale-listing flexibility.
- 2 sale attempts; this cycle's ask is 12314% above the opening price — seller raised mid-cycle; expect resistance to lowballs.
Risks & watch-outs
- Watch-outs: property tax is 3.1% of price.
- Climate carrying-cost: major wind risk, 27% chance of damaging wind over 30y; extreme-heat days projected 7→25/yr by 2055 (HVAC capex compounding) — expect insurance premiums to compound above CPI over the hold.
Questions for the listing agent
- What do current leases actually rent for vs. the listed asking? Can we see a recent rent roll and the last 12 months of T-12 income?
- It's been on market 48 days. Have you received any prior offers? Is the seller open to a 7% concession, seller financing, or rate buy-down credit?
- Property tax is high relative to price — has the assessment been appealed recently, and will the sale trigger a re-assessment?
- What does the HOA fee cover, when was the last increase, and are there any pending special assessments or reserve-fund shortfalls?
- Is there a deadline driving the sale (1031 exchange, divorce, estate, relocation)? That informs how much negotiation room exists.
- Schools are B-rated — typically a magnet for longer-tenancy family renters. What's the average tenant stay here, and is there a school-zone premium baked into asking?
- The area grade is low — what's the realistic commute time and amenity access for the typical tenant pool here? Any planned neighborhood developments (good or bad) we should know about?
- What's the average days-on-market for RENTAL listings here right now (not sales)? A rising rental-DOM trend means longer vacancies and softer asking-rent achievability than the comps imply.
- What's the recent tenant-quality profile in this submarket — average credit score on applications, eviction rate, late-payment / NSF rate, and stable-employment percentage? A property-management company in the area should have these aggregated.
- How much new for-sale + rental construction is in the pipeline within 1–3 miles? Heavy new supply typically softens prices + rents 12–24 months out; constrained supply supports both.
Investment metrics
- 1% rule
- 1.03% ✓
- Cap rate
- 5.79%
- Cash-on-cash
- -1.78%
- DSCR
- 0.92
- GRM
- 8.1
CMA / ARV
- ARV (median comp)
- $252,515
- List price
- $180,000
- Delta
- -28.72%
- Verdict
- UNDERPRICED
- Comps
- 20 within 1.0 mi
Show comp detail 7 sales within ~0.75 mi
| Address | Dist | Beds/Ba | Sqft | Sold | Price | $/sf | Match |
|---|---|---|---|---|---|---|---|
| 702 Slocum Way | 0.03mi | 2/1.0 | 1,012 (-3%) | 1mo | $179,000 | $177 | 93 |
| 733 Slocum Way | 0.08mi | 2/1.0 | 1,012 (-3%) | 6mo | $193,500 | $191 | 86 |
| 769 Slocum Way | 0.10mi | 2/1.0 | 1,012 (-3%) | 23mo | $240,000 | $237 | 72 |
| 318 Moray Dr | 0.48mi | 2/1.0 | 1,047 (+1%) | 8mo | $210,000 | $201 | 70 |
| 5509 Timber Point Dr | 0.67mi | 2/1.0 | 1,039 (0%) | 4mo | $199,000 | $192 | 65 |
| 207 Lemongrass | 0.68mi | 2/1.0 | 1,039 (0%) | 8mo | $187,900 | $181 | 62 |
| 115 Lemongrass Dr | 0.73mi | 2/1.0 | 1,039 (0%) | 13mo | $215,000 | $207 | 55 |
Match score weights: distance 35% · size 25% · config 20% · recency 20%. Top-matched comps best support the ARV.
Projected returns pro-forma
-3.0% appreciation · 0.0% rent growth · sell at horizon
- IRR
- -23.4%
- Equity multiple
- 0.22×
- Total profit
- $-39,155
- Equity at exit
- $26,839
- IRR
- -33.4%
- Equity multiple
- -0.20×
- Total profit
- $-60,364
- Equity at exit
- $15,563
Cash invested: $50,400 (down + closing). Projections, not guarantees.
Landlord ↔ Tenant lean methodology
- Overall (STATE)
- 87 Strongly Landlord-Friendly
- State Texas
- 87 Strongly Landlord-Friendly · R+5
- County
- — inherits STATE
- City
- — inherits STATE
ZIP-level market 75407
- Home prices YoY
- -30.3%
- Rents YoY
- -1.0%
- Active inventory
- 1404
- Price-to-rent
- 8.1×
Monthly cashflow live
- Estimated rent
- $1,852 high interval (Pro) →
- Mortgage (P&I)
- −$944
- Tax from tax record
- −$461 /mo · $5,533/yr
- Insurance
- −$75
- HOA
- −$58
- Vacancy / Maint / Mgmt
- −$389
- Net cashflow
- $-75
Break-even live
UW: 25.0% down · 7.5% · 30yr · 1.5% tax · 5.0% vac · 8.0% maint · 8.0% mgmt
Financing live
Cash to close
- Down payment
- $45,000
- Closing costs
- $5,400
- Reserves months
- —
- Total cash needed
- —
Loan-product check · same deal, 3 products live
Conventional
25% down · 7.5% · 30yr
- Down + closing
- —
- Monthly P&I
- —
- Monthly cashflow
- —
- DSCR
- —
- Eligible?
- —
Personal DTI + credit; lowest rate.
DSCR
20% down · 8.5% · 30yr
- Down + closing
- —
- Monthly P&I
- —
- Monthly cashflow
- —
- DSCR
- —
- Eligible?
- —
No personal income docs; deal must DSCR.
Hard money
10% down · 12.0% · 12mo
- Down + closing
- —
- Monthly P&I
- —
- Monthly cashflow
- —
- DSCR
- —
- Eligible?
- —
Short-term bridge; refi at stabilization.
Rent comps 40 comps
| Address | Beds | Baths | Sqft | Rent | $/sqft | DOM | Units | Dist |
|---|---|---|---|---|---|---|---|---|
| 5213 Longshadow Dr Princeton, TX | 3.0 | 2.0 | 1260 | $2,035 | $1.62 | 5d | 1 | 0.09mi |
| 718 Trestle Dr Princeton, TX | 2.0 | 1.0 | 1012 | $1,750 | $1.73 | 17d | 1 | 0.13mi |
| 5322 Longshadow Dr Princeton, TX | 3.0 | 2.0 | 1407 | $1,699 | $1.21 | 2d | 1 | 0.16mi |
| 5322 Longshadow Dr Princeton, TX | 3.0 | 2.0 | 1407 | $1,899 | $1.35 | 20d | 1 | 0.16mi |
| 5318 Curwood Dr Princeton, TX | 3.0 | 2.0 | 1440 | $1,650 | $1.15 | 43d | 1 | 0.20mi |
| 5324 Vinebrook Way Princeton, TX | 3.0 | 2.0 | 1262 | $1,695 | $1.34 | 43d | 1 | 0.20mi |
| 510 Olmstead Dr Princeton, TX | 3.0 | 2.0 | 1260 | $2,395 | $1.90 | 5d | 1 | 0.27mi |
| 617 Dashwood Dr Princeton, TX | 3.0 | 2.0 | 1440 | $1,619 | $1.12 | 3d | 1 | 0.35mi |
| 5105 Greywing Dr Princeton, TX | 3.0 | 2.0 | 1438 | $1,895 | $1.32 | 17d | 1 | 0.38mi |
| 320 Dewberry St Princeton, TX | 3.0 | 2.0 | 1481 | $1,745 | $1.18 | 12d | 1 | 0.56mi |
| 427 Ashbrook Way Princeton, TX | 3.0 | 2.0 | 1482 | $1,800 | $1.21 | 4d | 1 | 0.59mi |
| 330 Ashbrook Way Princeton, TX | 3.0 | 2.0 | 1479 | $1,800 | $1.22 | 18d | 1 | 0.60mi |
| 403 Ashbrook Way Princeton, TX | 3.0 | 2.0 | 1485 | $1,849 | $1.25 | 24d | 1 | 0.61mi |
| 403 Ashbrook Way Princeton, TX | 3.0 | 2.0 | 1485 | $1,749 | $1.18 | 5d | 1 | 0.61mi |
| 136 Honeysuckle St Princeton, TX | 3.0 | 2.0 | 1267 | $1,700 | $1.34 | 43d | 1 | 0.67mi |
| 5808 Cherry Hollow Way Princeton, TX | 3.0 | 2.0 | 1260 | $1,749 | $1.39 | 17d | 1 | 0.69mi |
| 318 Mahogany Ln Princeton, TX | 3.0 | 2.0 | 1479 | $1,800 | $1.22 | 24d | 1 | 0.70mi |
| 108 Wyndemere Ln Princeton, TX | 3.0 | 2.0 | 1438 | $2,100 | $1.46 | 43d | 1 | 0.70mi |
| 5504 Rockrose Ln Princeton, TX | 3.0 | 2.0 | 1479 | $1,999 | $1.35 | 4d | 1 | 0.74mi |
| 119 Cypress Ln Princeton, TX | 3.0 | 2.0 | 1260 | $1,750 | $1.39 | 43d | 1 | 0.77mi |
| 5836 Crystal Water Way Princeton, TX | 3.0 | 2.0 | 1481 | $1,799 | $1.21 | 5d | 1 | 0.79mi |
| 5847 Rock Maple Dr Princeton, TX | 3.0 | 2.0 | 1481 | $1,785 | $1.21 | 7d | 1 | 0.79mi |
| 5847 Rock Maple Dr Princeton, TX | 3.0 | 2.0 | 1481 | $1,785 | $1.21 | 17d | 1 | 0.79mi |
| 5644 Rockrose Ln Princeton, TX | 3.0 | 2.0 | 1262 | $1,800 | $1.43 | 43d | 1 | 0.83mi |
| 5708 Rockrose Ln Princeton, TX | 3.0 | 2.0 | 1440 | $1,925 | $1.34 | 43d | 1 | 0.86mi |
| 228 Rubylace Dr Princeton, TX | 3.0 | 2.0 | 1436 | $1,700 | $1.18 | 43d | 1 | 0.87mi |
| 5836 Timber Point Dr Princeton, TX | 3.0 | 2.0 | 1440 | $1,875 | $1.30 | 18d | 1 | 0.88mi |
| 5724 Rockrose Ln Princeton, TX | 3.0 | 2.0 | 1266 | $2,050 | $1.62 | 24d | 1 | 0.88mi |
| 5733 Rockrose Ln Princeton, TX | 3.0 | 2.0 | 1266 | $1,720 | $1.36 | 43d | 1 | 0.92mi |
| 6018 Primrose Rd , TX | 3.0–4.0 | 2.5 | 1484 | $1,800 | $1.21 | 3d | 5 | 0.93mi |
| 5817 Rockrose Ln Princeton, TX | 3.0 | 2.0 | 1411 | $1,624 | $1.15 | 20d | 1 | 0.95mi |
| 5825 Rockrose Ln Princeton, TX | 3.0 | 2.0 | 1440 | $1,780 | $1.24 | 43d | 1 | 0.96mi |
| 6102 Pinion Trl , TX | 3.0 | 2.5 | 1419 | $1,600 | $1.13 | 43d | 1 | 0.97mi |
| 623 Linden Rd Princeton, TX | 3.0 | 2.5 | 1419 | $1,650 | $1.16 | 43d | 1 | 1.00mi |
| 241 Boxberry Way Princeton, TX | 3.0 | 2.0 | 1411 | $1,725 | $1.22 | 43d | 1 | 1.05mi |
| 143 Plumcove Dr Princeton, TX | 3.0 | 3.0 | 1376 | $2,150 | $1.56 | 43d | 1 | 1.07mi |
| 910 Wood Stork Way Princeton, TX | 2.0 | 2.5 | 1022 | $1,700 | $1.66 | 18d | 1 | 1.15mi |
| 6222 Sandpiper Ln Unit NA Princeton, TX | 3.0 | 2.5 | 1400 | $1,750 | $1.25 | 7d | 1 | 1.16mi |
| 926 Wood Stork Way Princeton, TX | 3.0 | 2.5 | 1285 | $1,700 | $1.32 | 24d | 1 | 1.16mi |
| 6225 Kingfisher Way Princeton, TX | 3.0 | 2.5 | 1290 | $1,625 | $1.26 | 4d | 1 | 1.17mi |
HOA detail
- Monthly dues
- $58 · $696/yr
- Likely covers
- water
Listing history 17 events
-
2026-06-18days on market $180,000 Active 48 DOM
-
2026-06-17days on market $180,000 Active 47 DOM
-
2026-06-16days on market $180,000 Active 46 DOM
-
2026-06-15days on market $180,000 Active 45 DOM
-
2026-06-13days on market $180,000 Active 43 DOM
-
2026-06-13pricedays on market $180,000 Active 42 DOM
-
2026-06-09days on market $189,900 Active 39 DOM
-
2026-06-08days on market $189,900 Active 38 DOM
-
2026-06-07days on market $189,900 Active 37 DOM
-
2026-06-04days on market $189,900 Active 34 DOM
-
2026-06-03days on market $189,900 Active 33 DOM
-
2026-06-02days on market $189,900 Active 32 DOM
-
2026-06-02price $189,900 Active 31 DOM
-
2026-06-01days on market $195,000 Active 31 DOM
-
2026-05-31days on market $195,000 Active 30 DOM
-
2026-05-12price $195,000 1671-char remark
-
2026-05-01$200,000 Active 1671-char remark
ⓘ Source: listings_history table (triggers on properties + properties_extension) + one-shot
backfill from property_details.listing_events for pre-trigger history.
Tax reassessment forecast TX · Resets to sale price
- Current annual tax
- $5,533 · $461/mo
- Projected year-2 tax
- $5,533 · $461/mo
- Expected delta
- $0/yr ($0/mo · 0.0%)
ⓘ Screening estimate from a state-policy table — verify with the county assessor before closing.
Climate risk First Street
- Flood 1/10 Low FEMA zone X (unshaded) · 0% chance over 30 yrs
- Wildfire 2/10 Low
- Heat 8/10 Severe 7 d/yr ≥110°F today · 25 d/yr by 30 yrs out
- Wind 6/10 Major 27% chance of damaging wind over 30 yrs
- Air quality 3/10 Moderate 3 unhealthy d/yr today · 3 by 30 yrs out
Nearby sold comps map
Loading sold comps map…
Walkable amenities ~0.75 mi
Loading nearby amenities…
Taxation est. · year 1
- Rental income
- $22,225
- − Mortgage interest
- −$10,083
- − Property taxes
- −$5,533
- − Insurance
- −$900
- − Repairs & maintenance
- −$1,778
- − Management
- −$1,778
- − HOA
- −$696
- − Depreciation
- −$5,236
- Taxable loss
- −$3,779
- Est. tax savings @ 24.0%
- +$907
- After-tax cash flow
- $9/yr
For passive investors: Depreciation is non-cash, so a rental often shows a tax loss while cash-flowing — sheltering income. Rental losses are passive: they offset passive income freely, and up to $25,000/yr can offset ordinary (W-2) income if you actively participate and your MAGI is under $100k (phasing out to $0 by $150k); unused losses carry forward. On sale, claimed depreciation is recaptured at up to 25%, and gains may owe capital-gains tax (a 1031 exchange can defer both). Figures are a year-1 estimate at your 24.0% rate — not tax advice; consult a CPA.
Condition & rehab AI · 1 photo
This single-family home in Wylie, TX, is in good condition with a well-maintained exterior and interior. It offers a good return on investment with minor updates that can significantly enhance its resale and rental value.
Value-add opportunities
- Both Painting the exterior and interior walls — Fresh paint enhances curb appeal and interior aesthetics.
- Both Landscaping improvements — Enhances curb appeal and adds value to the property.
- Resale Kitchen backsplash — A backsplash can add visual interest and functionality to the kitchen.
Renovation cost estimate screening
Value-add ROI direction
- Both Painting the exterior and interior walls — Fresh paint enhances curb appeal and interior aesthetics. ↑
- Both Landscaping improvements — Enhances curb appeal and adds value to the property. ↑
- Resale Kitchen backsplash — A backsplash can add visual interest and functionality to the kitchen. ↑
ⓘ Cost ranges are severity-bucket heuristics (US national rule-of-thumb). Get contractor quotes + a written scope before underwriting a rehab budget.
Schools (NCES district)
- District
- Princeton ISD
- NCES district ID
- 4835850
- Math proficiency
- 51% ▼ -8.00%
- Reading proficiency
- 47% ▬ 0.00%
- Median HH income
- $54,827
- Composite
- 42.44/100
- National rank
- #3226
- State rank
- #188 of 826 in TX
Livability — Wylie
- Score
- 69/100
- State rank
- #419
- US rank
- #8623
Category grades
Schools grade is shown separately in the Schools card above.
Census & demographics
- County
- Collin County · 1,159,394 people
- City population
- 69,325
- Metro
- Dallas-Fort Worth-Arlington, TX
- Population (ZIP)
- 34,171
- Household income
- $100,037
- Rent vs Own
- Severe rent burden
- 368.0
Population outlook (Collin County) Hauer SSP2
- Today (2025)
- 1,210,074 people
- By 2030
- 1,358,201 · +12.2%
- By 2040
- 1,654,061 · +36.7%
- By 2050
- 1,937,359 · +60.1%
- By 2075
- 2,567,039 · +112.1%
- By 2100
- 2,952,048 · +144.0%
Race, ethnicity, and origin ACS 2023
- Neighborhood character
- Diverse neighborhood (Simpson 0.66)
- Race & ethnicity
- White 47% Hispanic / Latino 30% Black 17% Two or more races 10% Asian 4% Native American 1%
- Hispanic origin (detail)
- Mexican 26%
- Common ancestry
- Lithuanian 2% Romanian 1% Russian 1%
- Foreign-born
- 15% · Canada, China, Mexico
- Languages at home
- 70% English-only · Spanish 22% Other Indo-European 2% Other Asian/Pacific 1%
Political lean MEDSL · Collin
- 2024 margin
- R (+11.1) · D 43.1% · R 54.3% · Other 2.6%
- 2008→2024 swing
- +14.4pp toward D · 2008: -25.6pp · 2024: -11.1pp
- All cycles
- 2024: R+11.1 2020: R+4.3 2016: R+17.0 2012: R+31.6 2008: R+25.6
Not yet ingested
- Civics
- —
Market trends
- HPI YoY
- ▼ -103.99%
- Current HPI
- 238.9373
- Rent YoY
- ▼ -1.02%
- Metro
- Dallas-Fort Worth-Arlington, TX
- State GDP YoY
- ▲ 3.95%
- F500 in state
- 110
Industry mix (Fortune 500 HQ in TX)
| Industry | F500 HQs | Revenue |
|---|---|---|
| Energy | 16 | $1,198B |
|
||
| Technology | 5 | $198B |
|
||
| Engineering / Construction | 4 | $72B |
|
||
| Energy Services | 3 | $60B |
|
||
| Utilities | 3 | $41B |
|
||
| Healthcare | 2 | $330B |
|
||
Price history
-99.3% since first listed5 events — show timeline
- 2026-06-16 Listed for Rent $1,450 NTREIS
- 2026-06-11 Price Changed $180,000 NTREIS
- 2026-06-01 Price Changed $189,900 NTREIS
- 2026-05-12 Price Changed $195,000 NTREIS
- 2026-05-01 Listed $200,000 NTREIS
Property tax history
+55.8%/yrLatest (2025): $5,533 · -2.6% YoY. Source: county tax records.
Cash-flow waterfall
monthlySold comps — $/sqft
last 12 mo · ≤1 miLoading sold comps…