 Triplex
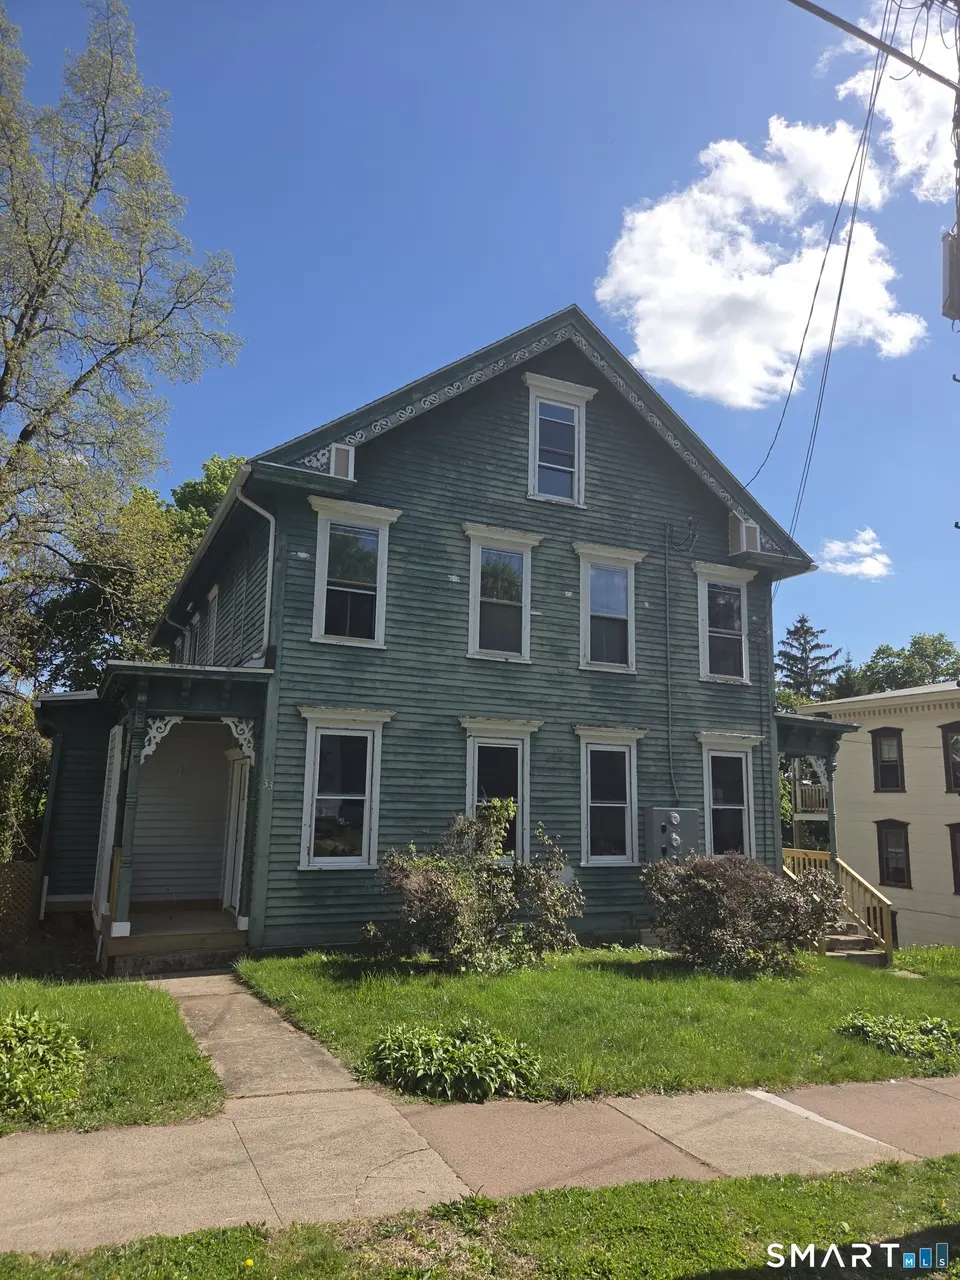
33 Talcott Ave · Rockville, CT
Flood risk 1/10 · Minimal
- FEMA flood zone
- X
- Chance of flooding over 30 yrs
- 0.0%
- Est. flood insurance / yr
- $473 – $860
Fire risk 1/10 · Minimal
- Est. fire insurance / yr
- $829 – $1,539
Heat risk 4/10 · Minor
- Hot days now (above 94°F)
- 7 days/yr
- Hot days in 30 yrs
- 17 days/yr
Wind risk 6/10 · Moderate
- Chance of severe wind over 30 yrs
- 27.0%
Air-quality risk 3/10 · Minor
- Unhealthy air days now
- 3 days/yr
- Unhealthy air days in 30 yrs
- 4 days/yr
Risk factors via First Street. Map © Google.
Why this score? — see what drove the B+ grade
The composite is a weighted blend of 9 inputs, each scored 0–100. Each bar is that input's sub-score; the figure is the points it added to the 100-point composite (weight × sub-score).
- Cash flow +30.0/30.0
- ARV discount +15.0/15.0
- 1% rule +10.0/10.0
- DSCR +10.0/10.0
- Rent growth +3.7/5.0
- Livability +3.7/5.0
- Schools +3.6/10.0
- Condition / age +2.5/5.0
- Appreciation +0.0/10.0
$250,000
🖨 Deal sheet 📄 Offer letter ✓ Due diligence
Multi-family units
County records classify this as Multi-Family (2-4 Unit). Listing-text estimate: 3 units. confirmed
Listing remarks MLS
Investor opportunity -- needs interior-exterior-mechanical renovations Two huge side by side units each with 3-4 bedrooms, walk up attics. Square footage for the two main units. Lower level apartment has 2 bedrooms. 2-c detached garage. Conventional or CASH ONLY! Sold as-is --seller will not make any repairs. Buyers agent to do due diligence. This is an estate. Water is turned off at street -- do not turn any faucets on or flush any toilets!!
Key facts
- Spacious layouts
- Multifamily property
- Bright living areas
Tags
Property features AI
Finance
- Financial info: Assessment value available
Exterior
- Utilities: Public water connected; Public sewer connected; No hot water on property
- Home design: Multi-family property (3-family)
- Construction: Frame construction; Block and stone foundation
- Exterior features: Level lot; Shingle and wood siding; Asphalt shingle roof
Interior
- Bedrooms: 10 bedrooms
- Bathrooms: 5 full bathrooms
- Heating & cooling: Hot water heat; Natural gas fuel
- Interior features: 15 total rooms; Full unfinished basement; Walk-up attic
Neighborhood map
What this means for you Summary
Snapshot
- This is a 3 × 3-bed/1.7-bath units multifamily listed at $250k.
Deal economics
- At list price, monthly cash flow is $3k ($39k/yr) — positive. Per door: $1k/mo.
- The deal already cash-flows at list — no discount required.
- Meets the 1% rule at list price ($7k rent vs $250k).
- Cap rate 22.0% vs local median 3.4% in Rockville — top-decile yield for the area; either an underpriced asset or a hidden risk that comps aren't pricing in. Stress-test before assuming the spread holds.
Location & tenants
- Location reads 73/100 on livability (#73 in CT) — a middle-class / working-renter tenant base. Strengths: health & safety A+, cost of living A, crime B+; Watch: employment D, amenities F, commute F.
- Vernon School District (suburban): math 34% / reading 48% proficiency, ranked #97 of 153 in CT (top 63%) — families likely to look elsewhere, expect single-tenant / working-renter base with shorter leases.
- Zoned schools: Maple Street School (math 22% / reading 32%, grade F, #401 of 553 statewide, top 74%, 257 students, 72% FRL); Rockville High School (math 22% / reading 52%, grade F, #112 of 194 statewide, top 60%, 932 students, 48% FRL) — zoned schools average 60% FRL vs 35% district-wide (25 pts higher); higher-poverty schools than district average — tighter screening recommended.
- Market conditions: Rents rising fast (+4.7%/yr); 81 active listings in the ZIP; solid renter incomes; 1,867 units permitted in Capitol Planning Region in 2024 (1,399 in 5+ unit buildings).
- At $6,564/mo this rent would consume 92% of the median local household income ($85k/yr) (locally 1140% of renters already pay >50% of income on rent) — very limited rent-growth headroom before tenants either downsize or default.
Forward outlook
- Local home prices are declining (-3.0%/yr); year-one equity from $2k of loan paydown is wiped out by about $8k of value loss. Plan a longer hold.
- At projected returns (-3.0% appreciation + 4.7% rent growth), your $70k cash investment doubles in ~3 years — after that, you're playing with house money.
Negotiation context
- Only 2 days on market — expect competitive offers; lowballing is unlikely to land.
- 2 sale attempts since 2y ago with the ask held roughly flat each time — persistent listings suggest the price (not the market) is what's stuck; bring a comps-based counter.
- Current owner paid $95k; list at $250k implies a 163% gain — meaningful room to come down on a strong offer.
Risks & watch-outs
- Watch-outs: built in 1900 — expect roof / HVAC / electrical / plumbing capex.
- Climate carrying-cost: major wind risk, 27% chance of damaging wind over 30y — expect insurance premiums to compound above CPI over the hold.
Questions for the listing agent
- Can we see the unit-by-unit rent roll, current vacancy, and any below-market leases? What's the average tenancy length?
- What capital expenditures (roof, boiler, parking lot, exteriors) have been made in the last 5 years, and what's planned in the next 2?
- Built in 1900 — when were the roof, HVAC, electrical panel, plumbing, and water heater last replaced?
- Is there a deadline driving the sale (1031 exchange, divorce, estate, relocation)? That informs how much negotiation room exists.
- What's the average days-on-market for RENTAL listings here right now (not sales)? A rising rental-DOM trend means longer vacancies and softer asking-rent achievability than the comps imply.
- What's the recent tenant-quality profile in this submarket — average credit score on applications, eviction rate, late-payment / NSF rate, and stable-employment percentage? A property-management company in the area should have these aggregated.
- How much new apartment / multifamily construction is in the pipeline within 1–3 miles? Heavy new supply (>2% of stock underway) typically softens rents 12–24 months out; light construction supports rent growth.
Investment metrics
- 1% rule
- 2.63% ✓
- Cap rate
- 21.98%
- Cash-on-cash
- 56.01%
- DSCR
- 3.49
- GRM
- 3.2
CMA / ARV
- ARV (median comp)
- $383,274
- List price
- $250,000
- Delta
- -34.77%
- Verdict
- UNDERPRICED
- Comps
- 20 within 1.0 mi
Show comp detail 1 sale within ~0.75 mi
| Address | Dist | Beds/Ba | Sqft | Sold | Price | $/sf | Match |
|---|---|---|---|---|---|---|---|
| 22 N Park St | 0.26mi | 5/2.0 (-1) | 3,201 (-13%) | 2mo | $330,000 | $103 | 56 |
Match score weights: distance 35% · size 25% · config 20% · recency 20%. Top-matched comps best support the ARV.
Projected returns pro-forma
-3.0% appreciation · 4.73% rent growth · sell at horizon
- IRR
- 56.4%
- Equity multiple
- 3.56×
- Total profit
- $179,412
- Equity at exit
- $37,276
- IRR
- 62.0%
- Equity multiple
- 7.78×
- Total profit
- $474,457
- Equity at exit
- $21,615
Cash invested: $70,000 (down + closing). Projections, not guarantees.
Landlord ↔ Tenant lean methodology
- Overall (STATE)
- 27 Tenant-Leaning
- State Connecticut
- 27 Tenant-Leaning · D+7
- County
- — inherits STATE
- City
- — inherits STATE
ZIP-level market 06066
- Rents YoY
- 4.7%
- Active inventory
- 81
- Price-to-rent
- 9.5×
Monthly cashflow live
- Estimated rent
- $6,564 high interval (Pro) →
- Mortgage (P&I)
- −$1,311
- Tax from tax record
- −$503 /mo · $6,039/yr
- Insurance
- −$104
- HOA
- −$0
- Vacancy / Maint / Mgmt
- −$1,378
- Net cashflow
- $3,267
Break-even live
3-unit breakdown (identical units grouped — click to expand)
| Units | Beds | Baths | Est. rent |
|---|---|---|---|
| 3× units | 3 | 1.7 | $6,564 |
| #1 | 3 | 1.7 | $2,188 |
| #2 | 3 | 1.7 | $2,188 |
| #3 | 3 | 1.7 | $2,188 |
| Total (3 units) | $6,564 | ||
UW: 25.0% down · 7.5% · 30yr · 1.5% tax · 5.0% vac · 8.0% maint · 8.0% mgmt
Financing live
Cash to close
- Down payment
- $62,500
- Closing costs
- $7,500
- Reserves months
- —
- Total cash needed
- —
Loan-product check · same deal, 3 products live
Conventional
25% down · 7.5% · 30yr
- Down + closing
- —
- Monthly P&I
- —
- Monthly cashflow
- —
- DSCR
- —
- Eligible?
- —
Personal DTI + credit; lowest rate.
DSCR
20% down · 8.5% · 30yr
- Down + closing
- —
- Monthly P&I
- —
- Monthly cashflow
- —
- DSCR
- —
- Eligible?
- —
No personal income docs; deal must DSCR.
Hard money
10% down · 12.0% · 12mo
- Down + closing
- —
- Monthly P&I
- —
- Monthly cashflow
- —
- DSCR
- —
- Eligible?
- —
Short-term bridge; refi at stabilization.
Listing history 5 events
-
2026-05-15status Under Contract 593-char remark
-
2026-05-12$250,000 Active 593-char remark
-
2024-02-07soldstatus $95,000 Closed 446-char remark
Show marketing remark (446 chars)
Investor opportunity -- needs interior-exterior-mechanical renovations Two huge side by side units each with 3-4 bedrooms, walk up attics. Square footage for the two main units. Lower level apartment has 2 bedrooms. 2-c detached garage. Conventional or CASH ONLY! Sold as-is --seller will not make any repairs. Buyers agent to do due diligence. This is an estate. Water is turned off at street -- do not turn any faucets on or flush any toilets!!
-
2024-01-10status Under Contract 446-char remark
Show marketing remark (446 chars)
Investor opportunity -- needs interior-exterior-mechanical renovations Two huge side by side units each with 3-4 bedrooms, walk up attics. Square footage for the two main units. Lower level apartment has 2 bedrooms. 2-c detached garage. Conventional or CASH ONLY! Sold as-is --seller will not make any repairs. Buyers agent to do due diligence. This is an estate. Water is turned off at street -- do not turn any faucets on or flush any toilets!!
-
2024-01-10$99,900 Active 446-char remark
Show marketing remark (446 chars)
Investor opportunity -- needs interior-exterior-mechanical renovations Two huge side by side units each with 3-4 bedrooms, walk up attics. Square footage for the two main units. Lower level apartment has 2 bedrooms. 2-c detached garage. Conventional or CASH ONLY! Sold as-is --seller will not make any repairs. Buyers agent to do due diligence. This is an estate. Water is turned off at street -- do not turn any faucets on or flush any toilets!!
ⓘ Source: listings_history table (triggers on properties + properties_extension) + one-shot
backfill from property_details.listing_events for pre-trigger history.
Tax reassessment forecast CT · Partial reset (capped growth)
- Current annual tax
- $6,039 · $503/mo
- Projected year-2 tax
- $6,039 · $503/mo
- Expected delta
- $0/yr ($0/mo · 0.0%)
ⓘ Screening estimate from a state-policy table — verify with the county assessor before closing.
Climate risk First Street
- Flood 1/10 Low FEMA zone X · 0% chance over 30 yrs
- Wildfire 1/10 Low
- Heat 4/10 Moderate 7 d/yr ≥94°F today · 17 d/yr by 30 yrs out
- Wind 6/10 Major 27% chance of damaging wind over 30 yrs
- Air quality 3/10 Moderate 3 unhealthy d/yr today · 4 by 30 yrs out
Nearby sold comps map
Loading sold comps map…
Walkable amenities ~0.75 mi
Loading nearby amenities…
Taxation est. · year 1
- Rental income
- $78,768
- − Mortgage interest
- −$14,004
- − Property taxes
- −$6,039
- − Insurance
- −$1,250
- − Repairs & maintenance
- −$6,301
- − Management
- −$6,301
- − Depreciation
- −$7,273
- Taxable income
- $37,600
- Est. tax owed @ 24.0%
- −$9,024
- After-tax cash flow
- $30,182/yr
For passive investors: Depreciation is non-cash, so a rental often shows a tax loss while cash-flowing — sheltering income. Rental losses are passive: they offset passive income freely, and up to $25,000/yr can offset ordinary (W-2) income if you actively participate and your MAGI is under $100k (phasing out to $0 by $150k); unused losses carry forward. On sale, claimed depreciation is recaptured at up to 25%, and gains may owe capital-gains tax (a 1031 exchange can defer both). Figures are a year-1 estimate at your 24.0% rate — not tax advice; consult a CPA.
Schools (NCES district)
- District
- Vernon School District
- NCES district ID
- 0904680
- Math proficiency
- 34% ▼ -11.00%
- Reading proficiency
- 48% ▼ -6.00%
- Median HH income
- $60,342
- Composite
- 36.26/100
- National rank
- #4704
- State rank
- #97 of 153 in CT
Livability — Rockville
- Score
- 73/100
- State rank
- #73
- US rank
- #5355
Category grades
Schools grade is shown separately in the Schools card above.
Census & demographics
- Census place
- Rockville, CT
- County
- Tolland County · 46,815 people
- Metro
- Hartford-East Hartford-Middletown, CT
- Population (ZIP)
- 30,577
- Household income
- $85,356
- Rent vs Own
- Severe rent burden
- 1140.0
Population outlook (Capitol County) Hauer SSP2
- By 2040
- 1,063,519
Race, ethnicity, and origin ACS 2023
- Neighborhood character
- Predominantly White (71%)
- Race & ethnicity
- White 71% Hispanic / Latino 12% Two or more races 7% Asian 6% Black 5%
- Hispanic origin (detail)
- Mexican 1% Puerto Rican 9%
- Common ancestry
- Lithuanian 8% Romanian 7% Slovak 2%
- Foreign-born
- 11% · Canada, China, South Korea
- Languages at home
- 84% English-only · Spanish 6% Other Indo-European 5% Russian/Polish/Slavic 1%
Political lean MEDSL · Capitol
- 2024 margin
- Strong D (+21.9) · D 60.1% · R 38.2% · Other 1.7%
- All cycles
- 2024: D+21.9
Not yet ingested
- Civics
- —
Market trends
- HPI YoY
- ▼ -136.25%
- Current HPI
- 249.7888
- Rent YoY
- ▲ 4.73%
- Metro
- Hartford-East Hartford-Middletown, CT
- State GDP YoY
- ▲ 1.06%
- F500 in state
- 38
Industry mix (Fortune 500 HQ in CT)
| Industry | F500 HQs | Revenue |
|---|---|---|
| Industrial Machinery | 4 | $38B |
|
||
| Insurance | 3 | $71B |
|
||
| Financial Services | 2 | $25B |
|
||
| Transportation / Logistics | 2 | $18B |
|
||
| Healthcare | 1 | $247B |
|
||
| Telecommunications | 1 | $55B |
|
||
Price history
+150.3% since first listed5 events — show timeline
- 2026-05-15 Pending — Smart MLS
- 2026-05-12 Listed $250,000 Smart MLS
- 2024-02-07 Sold (MLS) $95,000 Smart MLS
- 2024-01-10 Pending — Smart MLS
- 2024-01-10 Listed $99,900 Smart MLS
Property tax history
+2.1%/yrLatest (2023): $6,039 · +0.0% YoY. Source: county tax records.
Cash-flow waterfall
monthlySold comps — $/sqft
last 12 mo · ≤1 miLoading sold comps…