 🏗️ New Construction
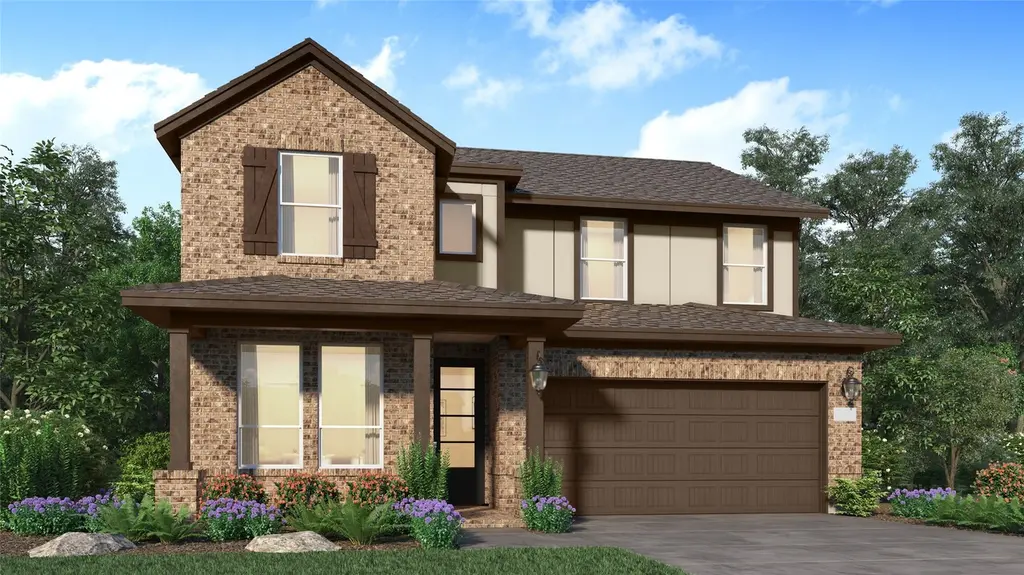
3515 Atlas Point Ln · Angleton, TX
Flood risk 7/10 · Major
- FEMA flood zone
- X (unshaded)
- Chance of flooding over 30 yrs
- 0.99%
- Est. flood insurance / yr
- $507 – $1,088
Fire risk 4/10 · Minor
- Est. fire insurance / yr
- $1,222 – $2,270
Heat risk 9/10 · Severe
- Hot days now (above 111°F)
- 6 days/yr
- Hot days in 30 yrs
- 22 days/yr
Wind risk 9/10 · Severe
- Chance of severe wind over 30 yrs
- 99.0%
Air-quality risk 2/10 · Minimal
- Unhealthy air days now
- 1 days/yr
- Unhealthy air days in 30 yrs
- 1 days/yr
Risk factors via First Street. Map © Google.
Why this score? — see what drove the F grade
The composite is a weighted blend of 9 inputs, each scored 0–100. Each bar is that input's sub-score; the figure is the points it added to the 100-point composite (weight × sub-score).
- Cash flow +7.9/30.0
- ARV discount +7.5/15.0
- Condition / age +4.0/5.0
- Livability +3.7/5.0
- Schools +3.5/10.0
- 1% rule +2.7/10.0
- Rent growth +2.5/5.0
- DSCR +2.0/10.0
- Appreciation +0.0/10.0
$251,001
🖨 Deal sheet (PDF) 📄 Offer letter ✓ Due diligence
Listing remarks
The Pelham Floor Plan - This two-story home has a versatile layout that is perfect for families who need privacy. Two bedrooms are on the first floor, including the owner’s suite which features a private bathroom and walk-in closet. Also on the first floor is the open concept living area, which offers access to a back patio. Upstairs are two additional bedrooms, which center around a game room loft. The completion date, prices and features may vary and are subject to change. Please verify with Lennar directly. Photos are for illustrative purposes only.
Key facts
- Game room loft
- Pelham floor plan
- Two story home
Tags
Property features AI
Finance
- HOA & community: Association managed by Preferred Management Services; Annual association fee of $825
Exterior
- Parking: Attached 2-car garage
- Utilities: Public water; Public sewer
- Home design: Residential property; Under construction (new construction); Built in 2026; Slab foundation; Composition roof
- Construction: Brick and stucco construction; New construction by Lennar Homes
- Exterior features: Back yard fence; Subdivision setting
Interior
- Kitchen: Dishwasher; Electric oven; Electric range; Gas oven; Gas range
- Bedrooms: Primary bedroom on the first floor; Additional bedroom on the first floor; Two bedrooms on the second floor; Total of 4 bedrooms
- Flooring: Carpet; Vinyl
- Bathrooms: 3 full bathrooms
- Heating & cooling: Central heating (electric and gas); Central air conditioning (electric and gas)
- Interior features: Breakfast bar; Double vanity; Kitchen/family room combo; Separate shower; Tub/shower
- Laundry & utility: Washer hookup; Electric dryer hookup; Gas dryer hookup
Neighborhood map
What this means for you Summary
Snapshot
- This is a 4-bed/3.0-bath single-family listed at $251k. Condition is rated good.
Deal economics
- At list price, monthly cash flow is $-392 ($-5k/yr) — negative.
- The deal already cash-flows at list — no discount required.
- To meet the 1% rule (rent ≥ 1% of price), the offer needs to be $237k (5.4% below list).
- Recommended offer: $237k (5.4% below list) — sets the bar for 1% rule.
- Cap rate 5.0% vs local median 4.0% in Angleton — meaningfully above typical; check what's discounted (condition, days-on-market, listing class) to confirm the premium yield is real.
Location & tenants
- Location reads 74/100 on livability (#171 in TX, #4,520 nationally) — a middle-class / working-renter tenant base. Strengths: cost of living A+, housing A+, employment A-; Watch: amenities F, commute F.
- Angleton ISD (suburban): math 36% / reading 44% proficiency, ranked #375 of 826 in TX (top 45%) — families likely to look elsewhere, expect single-tenant / working-renter base with shorter leases.
- Zoned schools: Rancho Isabella El (math 42% / reading 47%, grade F, #1,155 of 4,322 statewide, top 29%, 418 students, 68% FRL); Angleton J H School (math 26% / reading 41%, grade F, #911 of 1,662 statewide, top 56%, 1,561 students, 68% FRL); Angleton H S (math 22% / reading 45%, grade F, #1,011 of 1,632 statewide, top 63%, 2,066 students, 67% FRL).
- Market conditions: 932 active listings in the ZIP; 2 comparable units currently listed for rent nearby; solid renter incomes; 3,960 units permitted in Brazoria County in 2024 (593 in 5+ unit buildings).
- This rent runs 32% of the median local income ($89k/yr) — at the standard rent-burdened threshold; future hikes will face affordability resistance.
Forward outlook
- Local home prices are declining (-3.0%/yr); year-one equity from $2k of loan paydown is wiped out by about $9k of value loss. Plan a longer hold.
- Brazoria County population projected at +44% by 2050 — long-run rental-demand tailwind backs the buy-and-hold thesis.
Negotiation context
- It's been on market 31 days — a 3% lower offer ($243k) is reasonable based on typical stale-listing flexibility.
- 2 sale attempts with the ask held roughly flat each time — persistent listings suggest the price (not the market) is what's stuck; bring a comps-based counter.
Risks & watch-outs
- Watch-outs: flood insurance adds $66/mo.
- Climate carrying-cost: major flood risk; severe wind risk, 99% chance of damaging wind over 30y; extreme-heat days projected 6→22/yr by 2055 (HVAC capex compounding) — expect insurance premiums to compound above CPI over the hold.
Questions for the listing agent
- What do current leases actually rent for vs. the listed asking? Can we see a recent rent roll and the last 12 months of T-12 income?
- It's been on market 31 days. Have you received any prior offers? Is the seller open to a 5% concession, seller financing, or rate buy-down credit?
- What's the actual annual flood-insurance premium (NFIP or private), and is the property in a SFHA with mandatory coverage?
- What does the HOA fee cover, when was the last increase, and are there any pending special assessments or reserve-fund shortfalls?
- Is there a deadline driving the sale (1031 exchange, divorce, estate, relocation)? That informs how much negotiation room exists.
- Schools are D-rated, which usually means shorter tenancies and higher turnover. Who's the typical renter profile here, and what's been the actual vacancy rate?
- The area grade is low — what's the realistic commute time and amenity access for the typical tenant pool here? Any planned neighborhood developments (good or bad) we should know about?
- What's the average days-on-market for RENTAL listings here right now (not sales)? A rising rental-DOM trend means longer vacancies and softer asking-rent achievability than the comps imply.
- What's the recent tenant-quality profile in this submarket — average credit score on applications, eviction rate, late-payment / NSF rate, and stable-employment percentage? A property-management company in the area should have these aggregated.
- How much new for-sale + rental construction is in the pipeline within 1–3 miles? Heavy new supply typically softens prices + rents 12–24 months out; constrained supply supports both.
Investment metrics
- 1% rule
- 0.77% ✗
- Cap rate
- 5.03%
- Cash-on-cash
- -4.52%
- DSCR
- 0.80
- GRM
- 10.8
CMA / ARV
- ARV (median comp)
- $308,490
- List price
- $251,001
- Delta
- -18.64%
- Verdict
- UNDERPRICED
- Comps
- 20 within 1.0 mi
Show comp detail 12 sales within ~0.75 mi
| Address | Dist | Beds/Ba | Sqft | Sold | Price | $/sf | Match |
|---|---|---|---|---|---|---|---|
| 2130 Mosaic Valley Ct | 0.09mi | 4/3.0 | 2,410 (0%) | 2mo | $352,990 | $146 | 94 |
| 28815 Golden Wheat Ct | 0.05mi | 4/2.5 | 2,263 (-6%) | 1mo | $350,990 | $155 | 85 |
| 2103 Mosaic Valley Ct | 0.05mi | 4/2.5 | 2,263 (-6%) | 1mo | $313,990 | $139 | 85 |
| 2010 Starlight St | 0.06mi | 5/2.5 (+1) | 2,488 (+3%) | 2mo | $319,990 | $129 | 84 |
| 3507 Atlas Point Ln | 0.02mi | 3/2.5 (-1) | 2,539 (+5%) | 0mo | $265,790 | $105 | 83 |
| 2119 Mosaic Valley Ct | 0.08mi | 4/2.5 | 2,263 (-6%) | 2mo | $310,990 | $137 | 83 |
| 1935 Stargazer Ln | 0.10mi | 4/3.0 | 2,229 (-8%) | 0mo | $252,990 | $113 | 83 |
| 3623 Atlas Point Ln | 0.13mi | 4/2.5 | 2,263 (-6%) | 1mo | $311,990 | $138 | 81 |
| 3552 Atlas Point Ln | 0.09mi | 4/2.5 | 2,073 (-14%) | 1mo | $279,990 | $135 | 70 |
| 1523 Windrose Bnd | 0.56mi | 4/2.5 | 2,388 (-1%) | 1mo | $299,500 | $125 | 70 |
| 2943 Summer Breeze Way | 0.67mi | 4/2.5 | 2,066 (-14%) | 2mo | $292,990 | $142 | 42 |
| 2931 Summer Breeze Way | 0.68mi | 4/2.5 | 2,066 (-14%) | 2mo | $292,990 | $142 | 41 |
Match score weights: distance 35% · size 25% · config 20% · recency 20%. Top-matched comps best support the ARV.
Projected returns pro-forma
-3.0% appreciation · 3.0% rent growth · sell at horizon
- IRR
- -25.5%
- Equity multiple
- 0.13×
- Total profit
- $-74,818
- Equity at exit
- $45,997
- IRR
- -21.7%
- Equity multiple
- -0.12×
- Total profit
- $-96,791
- Equity at exit
- $26,673
Cash invested: $86,377 (down + closing). Projections, not guarantees.
Landlord ↔ Tenant lean methodology
- Overall (STATE)
- 87 Strongly Landlord-Friendly
- State Texas
- 87 Strongly Landlord-Friendly · R+5
- County
- — inherits STATE
- City
- — inherits STATE
ZIP-level market 77515
- Home prices YoY
- -5.1%
- Active inventory
- 932
- Price-to-rent
- 8.8×
Monthly cashflow live
- Estimated rent
- $2,374 medium interval (Pro) →
- Mortgage (P&I)
- −$1,618
- Tax est. 1.5%
- −$386 /mo · $4,627/yr
- Insurance
- −$129
- Flood insurance flood zone
- −$66 /mo · $798/yr
- HOA
- −$69
- Vacancy / Maint / Mgmt
- −$499
- Net cashflow
- $-392
Break-even live
Sensitivity live
| Price | -10% $-179 | -5% $-285 | +0% $-392 | +5% $-498 | +10% $-605 |
|---|---|---|---|---|---|
| Rent | -10% $-579 | -5% $-485 | +0% $-392 | +5% $-298 | +10% $-204 |
| Rate | -1.0pp $-236 | -0.5pp $-313 | base $-392 | +0.5pp $-472 | +1.0pp $-553 |
UW: 25.0% down · 7.5% · 30yr · 1.5% tax · 5.0% vac · 8.0% maint · 8.0% mgmt
Financing live
Cash to close
- Down payment
- $77,122
- Closing costs
- $9,255
- Reserves months
- —
- Total cash needed
- —
Loan-product check · same deal, 3 products live
Conventional
25% down · 7.5% · 30yr
- Down + closing
- —
- Monthly P&I
- —
- Monthly cashflow
- —
- DSCR
- —
- Eligible?
- —
Personal DTI + credit; lowest rate.
DSCR
20% down · 8.5% · 30yr
- Down + closing
- —
- Monthly P&I
- —
- Monthly cashflow
- —
- DSCR
- —
- Eligible?
- —
No personal income docs; deal must DSCR.
Hard money
10% down · 12.0% · 12mo
- Down + closing
- —
- Monthly P&I
- —
- Monthly cashflow
- —
- DSCR
- —
- Eligible?
- —
Short-term bridge; refi at stabilization.
Rent comps 2 comps
| Address | Beds | Baths | Sqft | Rent | $/sqft | DOM | Units | Dist |
|---|---|---|---|---|---|---|---|---|
| 3606 Atlas Point Ln Angleton, TX | 3.0 | 2.0 | 1876 | $2,250 | $1.20 | 0d | 1 | 0.12mi |
| 513 Robin St Angleton, TX | 4.0 | 2.0 | 1900 | $2,495 | $1.31 | 24d | 1 | 1.18mi |
HOA detail
- Monthly dues
- $69 · $828/yr
Listing history 26 events
-
2026-06-13statusdays on market $251,001 Pending 31 DOM
-
2026-06-09days on market $251,001 Active 29 DOM
-
2026-06-08days on market $251,001 Active 28 DOM
-
2026-06-07days on market $251,001 Active 27 DOM
-
2026-06-04days on market $251,001 Active 24 DOM
-
2026-06-03days on market $251,001 Active 23 DOM
-
2026-06-02days on market $251,001 Active 22 DOM
-
2026-06-01days on market $251,001 Active 21 DOM
-
2026-05-31days on market $251,001 Active 20 DOM
-
2026-05-13price $251,001 373-char remark
-
2026-05-11$251,001 Active 564-char remark
-
2026-05-11historical
-
2026-05-08price $262,140 373-char remark
-
2026-05-05price $271,990 373-char remark
-
2026-05-04price $271,990
-
2026-05-01price $275,340 373-char remark
-
2026-04-30price $275,340
-
2026-04-28price $284,990
-
2026-04-28price $284,990 373-char remark
-
2026-04-10price $292,940 373-char remark
-
2026-04-09price $292,940
-
2026-04-04price $297,940 373-char remark
-
2026-04-03price $297,940
-
2026-03-28price $303,090 373-char remark
-
2026-03-24$350,990 Active
-
2026-03-23$350,990 Active 373-char remark
ⓘ Source: listings_history table (triggers on properties + properties_extension) + one-shot
backfill from property_details.listing_events for pre-trigger history.
Climate risk First Street
- Flood 7/10 Severe FEMA zone X (unshaded) · 99% chance over 30 yrs
- Wildfire 4/10 Moderate
- Heat 9/10 Extreme 6 d/yr ≥111°F today · 22 d/yr by 30 yrs out
- Wind 9/10 Extreme 99% chance of damaging wind over 30 yrs
- Air quality 2/10 Low 1 unhealthy d/yr today · 1 by 30 yrs out
Nearby sold comps map
Loading sold comps map…
Walkable amenities ~0.75 mi
Loading nearby amenities…
Taxation est. · year 1
- Rental income
- $28,491
- − Mortgage interest
- −$17,280
- − Property taxes
- −$4,627
- − Insurance
- −$2,340
- − Repairs & maintenance
- −$2,279
- − Management
- −$2,279
- − HOA
- −$828
- − Depreciation
- −$8,974
- Taxable loss
- −$10,117
- Est. tax savings @ 24.0%
- +$2,428
- After-tax cash flow
- $-2,272/yr
For passive investors: Depreciation is non-cash, so a rental often shows a tax loss while cash-flowing — sheltering income. Rental losses are passive: they offset passive income freely, and up to $25,000/yr can offset ordinary (W-2) income if you actively participate and your MAGI is under $100k (phasing out to $0 by $150k); unused losses carry forward. On sale, claimed depreciation is recaptured at up to 25%, and gains may owe capital-gains tax (a 1031 exchange can defer both). Figures are a year-1 estimate at your 24.0% rate — not tax advice; consult a CPA.
Condition & rehab AI · 6 photos
This two-story home is in good condition with a modern and well-maintained interior and exterior. It offers a good investment opportunity with potential for minor updates to enhance its resale and rental value.
Value-add opportunities
- Both Painting the exterior and interior walls — Fresh paint enhances curb appeal and interior aesthetics
- Both Landscaping improvements — Enhances curb appeal and adds value
- Resale Kitchen appliances — Modern appliances improve the home's appeal to potential buyers
- Resale Bathroom fixtures — Upgraded fixtures can increase the home's value
- Resale Flooring — New flooring can improve the home's overall appearance and value
Renovation cost estimate screening
Value-add ROI direction
- Both Painting the exterior and interior walls — Fresh paint enhances curb appeal and interior aesthetics ↑
- Both Landscaping improvements — Enhances curb appeal and adds value ↑
- Resale Kitchen appliances — Modern appliances improve the home's appeal to potential buyers ↑
- Resale Bathroom fixtures — Upgraded fixtures can increase the home's value ↑
- Resale Flooring — New flooring can improve the home's overall appearance and value ↑
ⓘ Cost ranges are severity-bucket heuristics (US national rule-of-thumb). Get contractor quotes + a written scope before underwriting a rehab budget.
Schools (NCES district)
- District
- Angleton ISD
- NCES district ID
- 4808310
- Math proficiency
- 36% ▼ -8.00%
- Reading proficiency
- 44% ▲ 1.00%
- Median HH income
- $55,670
- Composite
- 35.01/100
- National rank
- #5046
- State rank
- #375 of 826 in TX
Livability — Angleton
- Score
- 74/100
- State rank
- #171
- US rank
- #4520
Category grades
Schools grade is shown separately in the Schools card above.
Census & demographics
- County
- Brazoria County · 374,982 people
- City population
- 34,088
- Metro
- Houston-The Woodlands-Sugar Land, TX
- Population (ZIP)
- 34,088
- Household income
- $88,787
- Rent vs Own
- Severe rent burden
- 785.0
Population outlook (Brazoria County) Hauer SSP2
- Today (2025)
- 420,414 people
- By 2030
- 457,585 · +8.8%
- By 2040
- 532,232 · +26.6%
- By 2050
- 605,399 · +44.0%
- By 2075
- 779,358 · +85.4%
- By 2100
- 883,759 · +110.2%
Race, ethnicity, and origin ACS 2023
- Neighborhood character
- Diverse neighborhood (Simpson 0.58)
- Race & ethnicity
- White 55% Hispanic / Latino 33% Two or more races 18% Black 8% Asian 2%
- Hispanic origin (detail)
- Mexican 28%
- Common ancestry
- Lithuanian 3% Romanian 2% Slovak 1%
- Foreign-born
- 8% · Canada, Vietnam
- Languages at home
- 78% English-only · Spanish 20% Other Asian/Pacific 1%
Political lean MEDSL · Brazoria
- 2024 margin
- R (+19.7) · D 39.5% · R 59.2% · Other 1.3%
- 2008→2024 swing
- +9.9pp toward D · 2008: -29.6pp · 2024: -19.7pp
- All cycles
- 2024: R+19.7 2020: R+18.2 2016: R+24.6 2012: R+34.2 2008: R+29.6
Not yet ingested
- Civics
- —
Market trends
- HPI YoY
- ▼ -15.59%
- Current HPI
- 288.7286
- Rent YoY
- —
- Metro
- Houston-The Woodlands-Sugar Land, TX
- State GDP YoY
- ▲ 3.95%
- F500 in state
- 110
Industry mix (Fortune 500 HQ in TX)
| Industry | F500 HQs | Revenue |
|---|---|---|
| Energy | 16 | $1,198B |
|
||
| Technology | 5 | $198B |
|
||
| Engineering / Construction | 4 | $72B |
|
||
| Energy Services | 3 | $60B |
|
||
| Utilities | 3 | $41B |
|
||
| Healthcare | 2 | $330B |
|
||
Price history
-28.5% since first listed9 events — show timeline
- 2026-06-11 Pending — HARMLS
- 2026-05-11 Listing Removed — HARMLS
- 2026-05-11 Listed $251,001 HARMLS
- 2026-05-04 Price Changed $271,990 HARMLS
- 2026-04-30 Price Changed $275,340 HARMLS
- 2026-04-28 Price Changed $284,990 HARMLS
- 2026-04-09 Price Changed $292,940 HARMLS
- 2026-04-03 Price Changed $297,940 HARMLS
- 2026-03-24 Listed $350,990 HARMLS
Cash-flow waterfall
monthlySold comps — $/sqft
last 12 mo · ≤1 miLoading sold comps…