1420 14th St · Auburn, NE
Flood risk 1/10 · Minimal
- FEMA flood zone
- X (unshaded)
- Chance of flooding over 30 yrs
- 0.0%
- Est. flood insurance / yr
- $507 – $1,088
Fire risk 2/10 · Minimal
- Est. fire insurance / yr
- $1,161 – $2,155
Heat risk 3/10 · Minor
- Hot days now (above 107°F)
- 7 days/yr
- Hot days in 30 yrs
- 16 days/yr
Wind risk 2/10 · Minimal
- Chance of severe wind over 30 yrs
- —
Air-quality risk 1/10 · Minimal
- Unhealthy air days now
- 0 days/yr
- Unhealthy air days in 30 yrs
- 0 days/yr
Risk factors via First Street. Map © Google.
Why this score? — see what drove the A- grade
The composite is a weighted blend of 9 inputs, each scored 0–100. Each bar is that input's sub-score; the figure is the points it added to the 100-point composite (weight × sub-score).
- Cash flow +30.0/30.0
- ARV discount +15.0/15.0
- 1% rule +10.0/10.0
- DSCR +10.0/10.0
- Appreciation +5.0/10.0
- Schools +4.4/10.0
- Livability +3.9/5.0
- Rent growth +2.5/5.0
- Condition / age +2.5/5.0
$60,000
🖨 Deal sheet 📄 Offer letter ✓ Due diligence
Listing remarks
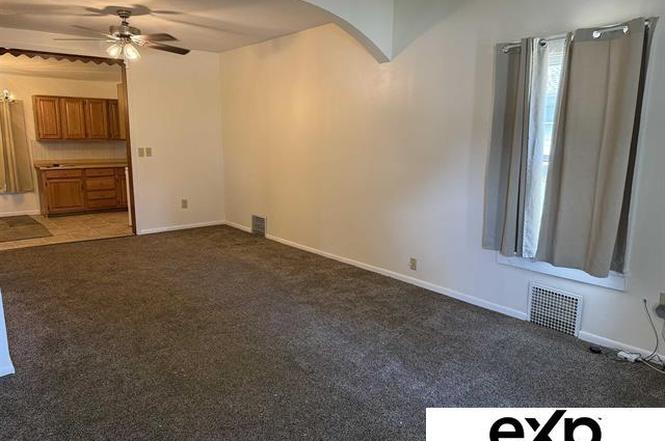
Charming and move-in ready 2-bedroom home with delightful updates and cozy appeal! Step inside and be welcomed by a spacious living room filled with natural light - perfect for relaxing or entertaining. The generously sized kitchen offers plenty of cabinet and counter space, making meal prep a breeze. Two comfortable bedrooms provide peaceful retreats at the end of the day. Outside, you'll find a handy storage shed and a low-maintenance yard - ideal for gardening, weekend barbecues, or simply enjoying your own private outdoor space. Whether you're a first-time buyer, downsizing, or looking for a turnkey investment, this home offers comfort, convenience, and charm in every corner. Don't miss
Key facts
- Extra cabinets
- Counter space
- Adjacent room
Tags
Neighborhood map
What this means for you Summary
Snapshot
- This is a 2-bed/1.0-bath single-family listed at $60k.
Deal economics
- At list price, monthly cash flow is $495 ($6k/yr) — positive.
- The deal already cash-flows at list — no discount required.
- Meets the 1% rule at list price ($1k rent vs $60k).
Location & tenants
- Location reads 77/100 on livability (#68 in NE, #3,032 nationally) — a middle-class / working-renter tenant base. Strengths: crime A+, cost of living A+, health & safety A+; Watch: amenities F, commute F.
- Auburn Public Schools (town): math 49% / reading 56% proficiency, ranked #58 of 111 in NE (top 52%) — acceptable for families but not a draw, mixed tenant base, ~2y average lease.
- Zoned schools: Auburn Middle School (math 52% / reading 57%, grade B-, #32 of 128 statewide, top 28%, 190 students, 42% FRL); Auburn High School (math 44% / reading 64%, grade C-, #80 of 261 statewide, top 37%, 247 students, 42% FRL).
- Market conditions: 3 active listings in the ZIP; 13 units permitted in Nemaha County in 2024 (0 in 5+ unit buildings).
Forward outlook
- In year one you build about $2k of equity ($415 loan paydown + $2k appreciation (3.0% local appreciation)).
- Nemaha County population projected to shrink 4% by 2050 — rents likely to lag national; underwrite the cash flow, not the appreciation.
- At projected returns (3.0% appreciation + 3.0% rent growth), your $17k cash investment doubles in ~3 years — after that, you're playing with house money.
Negotiation context
- Only 9 days on market — expect competitive offers; lowballing is unlikely to land.
- Current owner paid $12k; list at $60k implies a 390% gain — meaningful room to come down on a strong offer.
Risks & watch-outs
- Watch-outs: built in 1900 — expect roof / HVAC / electrical / plumbing capex.
Questions for the listing agent
- Built in 1900 — when were the roof, HVAC, electrical panel, plumbing, and water heater last replaced?
- Is there a deadline driving the sale (1031 exchange, divorce, estate, relocation)? That informs how much negotiation room exists.
- Schools are A-rated — typically a magnet for longer-tenancy family renters. What's the average tenant stay here, and is there a school-zone premium baked into asking?
- What's the average days-on-market for RENTAL listings here right now (not sales)? A rising rental-DOM trend means longer vacancies and softer asking-rent achievability than the comps imply.
- What's the recent tenant-quality profile in this submarket — average credit score on applications, eviction rate, late-payment / NSF rate, and stable-employment percentage? A property-management company in the area should have these aggregated.
- How much new for-sale + rental construction is in the pipeline within 1–3 miles? Heavy new supply typically softens prices + rents 12–24 months out; constrained supply supports both.
Investment metrics
- 1% rule
- 1.88% ✓
- Cap rate
- 16.20%
- Cash-on-cash
- 35.38%
- DSCR
- 2.57
- GRM
- 4.4
CMA / ARV
- ARV (on-the-fly)
- $119,448
- Comps found
- 8
Show comp detail 8 sales within ~0.75 mi
| Address | Dist | Beds/Ba | Sqft | Sold | Price | $/sf | Match |
|---|---|---|---|---|---|---|---|
| 1218 14th St | 0.14mi | 2/1.0 | 988 (+4%) | 22mo | $160,000 | $162 | 69 |
| 1120 6th St | 0.61mi | 2/1.0 | 960 (+1%) | 7mo | $179,000 | $186 | 64 |
| 1906 P St | 0.41mi | 2/2.0 | 936 (-1%) | 17mo | $117,500 | $126 | 60 |
| 1422 I St | 0.40mi | 3/1.0 (+1) | 967 (+2%) | 22mo | $73,500 | $76 | 55 |
| 1114 13th St | 0.23mi | 2/1.0 | 1,046 (+10%) | 21mo | $88,500 | $85 | 55 |
| 622 14 St | 0.56mi | 2/1.0 | 868 (-8%) | 16mo | $16,000 | $18 | 46 |
| 1112 10th St | 0.36mi | 3/2.0 (+1) | 1,088 (+15%) | 11mo | $150,000 | $138 | 40 |
| 2115 M St | 0.57mi | 2/1.0 | 815 (-14%) | 14mo | $100,000 | $123 | 38 |
Match score weights: distance 35% · size 25% · config 20% · recency 20%. Top-matched comps best support the ARV.
Projected returns pro-forma
3.0% appreciation · 3.0% rent growth · sell at horizon
- IRR
- 41.0%
- Equity multiple
- 3.31×
- Total profit
- $38,777
- Equity at exit
- $26,979
- IRR
- 40.9%
- Equity multiple
- 6.59×
- Total profit
- $93,855
- Equity at exit
- $41,577
Cash invested: $16,800 (down + closing). Projections, not guarantees.
Landlord ↔ Tenant lean methodology
- Overall (STATE)
- 83 Strongly Landlord-Friendly
- State Nebraska
- 83 Strongly Landlord-Friendly · R+13
- County
- — inherits STATE
- City
- — inherits STATE
ZIP-level market 68035
- Active inventory
- 3
- Price-to-rent
- 4.4×
Monthly cashflow live
- Estimated rent
- $1,130 medium interval (Pro) →
- Mortgage (P&I)
- −$315
- Tax from tax record
- −$57 /mo · $690/yr
- Insurance
- −$25
- HOA
- −$0
- Vacancy / Maint / Mgmt
- −$237
- Net cashflow
- $495
Break-even live
UW: 25.0% down · 7.5% · 30yr · 1.5% tax · 5.0% vac · 8.0% maint · 8.0% mgmt
Financing live
Cash to close
- Down payment
- $15,000
- Closing costs
- $1,800
- Reserves months
- —
- Total cash needed
- —
Loan-product check · same deal, 3 products live
Conventional
25% down · 7.5% · 30yr
- Down + closing
- —
- Monthly P&I
- —
- Monthly cashflow
- —
- DSCR
- —
- Eligible?
- —
Personal DTI + credit; lowest rate.
DSCR
20% down · 8.5% · 30yr
- Down + closing
- —
- Monthly P&I
- —
- Monthly cashflow
- —
- DSCR
- —
- Eligible?
- —
No personal income docs; deal must DSCR.
Hard money
10% down · 12.0% · 12mo
- Down + closing
- —
- Monthly P&I
- —
- Monthly cashflow
- —
- DSCR
- —
- Eligible?
- —
Short-term bridge; refi at stabilization.
Listing history 11 events
-
2026-06-18days on market $60,000 Active 9 DOM
-
2026-06-17days on market $60,000 Active 8 DOM
-
2026-06-16days on market $60,000 Active 7 DOM
-
2026-06-15statusdays on market $60,000 Active 6 DOM
-
2026-06-13days on market $60,000 New 4 DOM
-
2026-06-12days on market $60,000 New 3 DOM
-
2026-06-09pricestatusdays on market $60,000 New 1 DOM
-
2025-12-17status Pending
-
2025-09-08price $85,000
-
2025-08-22$89,000 New
-
2009-11-20soldstatus $12,250
ⓘ Source: listings_history table (triggers on properties + properties_extension) + one-shot
backfill from property_details.listing_events for pre-trigger history.
Tax reassessment forecast NE · Resets to sale price
- Current annual tax
- $690 · $57/mo
- Projected year-2 tax
- $1,038 · $86/mo
- Expected delta
- +$348/yr (+$29/mo · 50.5%)
ⓘ Screening estimate from a state-policy table — verify with the county assessor before closing.
Climate risk First Street
- Flood 1/10 Low FEMA zone X (unshaded) · 0% chance over 30 yrs
- Wildfire 2/10 Low
- Heat 3/10 Moderate 7 d/yr ≥107°F today · 16 d/yr by 30 yrs out
- Wind 2/10 Low
- Air quality 1/10 Low 0 unhealthy d/yr today · 0 by 30 yrs out
Nearby sold comps map
Loading sold comps map…
Walkable amenities ~0.75 mi
Loading nearby amenities…
Taxation est. · year 1
- Rental income
- $13,555
- − Mortgage interest
- −$3,361
- − Property taxes
- −$690
- − Insurance
- −$300
- − Repairs & maintenance
- −$1,084
- − Management
- −$1,084
- − Depreciation
- −$1,745
- Taxable income
- $5,290
- Est. tax owed @ 24.0%
- −$1,270
- After-tax cash flow
- $4,673/yr
For passive investors: Depreciation is non-cash, so a rental often shows a tax loss while cash-flowing — sheltering income. Rental losses are passive: they offset passive income freely, and up to $25,000/yr can offset ordinary (W-2) income if you actively participate and your MAGI is under $100k (phasing out to $0 by $150k); unused losses carry forward. On sale, claimed depreciation is recaptured at up to 25%, and gains may owe capital-gains tax (a 1031 exchange can defer both). Figures are a year-1 estimate at your 24.0% rate — not tax advice; consult a CPA.
Schools (NCES district)
- District
- Auburn Public Schools
- NCES district ID
- 3103330
- Math proficiency
- 49% ▼ -8.00%
- Reading proficiency
- 56% ▼ -8.00%
- Median HH income
- $45,761
- Composite
- 44.43/100
- National rank
- #2807
- State rank
- #58 of 111 in NE
Livability — Auburn
- Score
- 77/100
- State rank
- #68
- US rank
- #3032
Category grades
Schools grade is shown separately in the Schools card above.
Census & demographics
- Census place
- Auburn, NE
Population outlook (Nemaha County) Hauer SSP2
- Today (2025)
- 7,018 people
- By 2030
- 6,911 · -1.5%
- By 2040
- 6,730 · -4.1%
- By 2050
- 6,738 · -4.0%
- By 2075
- 7,053 · +0.5%
- By 2100
- 7,347 · +4.7%
Not yet ingested
- Political lean
- —
- Race & ethnicity
- —
- Common origin
- —
- Civics
- —
Market trends
- HPI YoY
- —
- Current HPI
- —
- Rent YoY
- —
- Metro
- —
- State GDP YoY
- ▲ 0.68%
- F500 in state
- 2
Industry mix (Fortune 500 HQ in NE)
| Industry | F500 HQs | Revenue |
|---|---|---|
| Conglomerate | 1 | $371B |
|
||
Price history
+593.9% since first listed4 events — show timeline
- 2025-12-17 Pending — GPRMLS
- 2025-09-08 Price Changed $85,000 GPRMLS
- 2025-08-22 Listed $89,000 GPRMLS
- 2009-11-20 Sold (Public Records) $12,250 Public Records
Property tax history
+8.0%/yrLatest (2025): $690 · +130.4% YoY. Source: county tax records.
Cash-flow waterfall
monthlySold comps — $/sqft
last 12 mo · ≤1 miLoading sold comps…