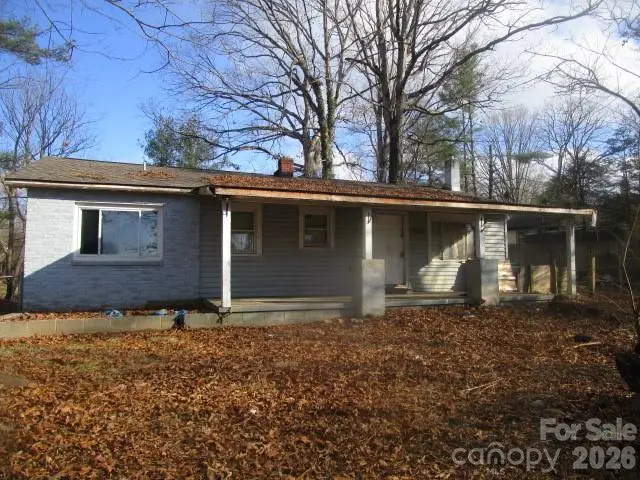
379 Oakview Park Rd · Asheville, NC
Flood risk 1/10 · Minimal
- FEMA flood zone
- X (unshaded)
- Chance of flooding over 30 yrs
- 0.0%
- Est. flood insurance / yr
- $507 – $1,088
Fire risk 3/10 · Minor
- Est. fire insurance / yr
- $906 – $1,684
Heat risk 4/10 · Minor
- Hot days now (above 95°F)
- 8 days/yr
- Hot days in 30 yrs
- 21 days/yr
Wind risk 2/10 · Minimal
- Chance of severe wind over 30 yrs
- —
Air-quality risk 3/10 · Minor
- Unhealthy air days now
- 3 days/yr
- Unhealthy air days in 30 yrs
- 4 days/yr
Risk factors via First Street. Map © Google.
Why this score? — see what drove the B- grade
The composite is a weighted blend of 9 inputs, each scored 0–100. Each bar is that input's sub-score; the figure is the points it added to the 100-point composite (weight × sub-score).
- Cash flow +30.0/30.0
- DSCR +10.0/10.0
- 1% rule +8.4/10.0
- ARV discount +7.5/15.0
- Schools +4.0/10.0
- Livability +3.6/5.0
- Condition / age +2.5/5.0
- Rent growth +2.0/5.0
- Appreciation +0.0/10.0
$149,900
🖨 Deal sheet 📄 Offer letter ✓ Due diligence
Listing remarks
Great 3BR/2BA ranch-style home with 1,176 heated sq ft on a . 43-acre corner lot—ideal for fix-and-flip or long-term hold. Located in the heart of Asheville, just minutes to Mission Hospital, Downtown, Biltmore Village, and South Slope breweries. Quiet residential street with convenient access to shopping, dining, parks, and I-240. Strong investment opportunity with excellent upside potential. Property is being sold as-is. Buyer to verify all information.
Key facts
- Corner lot
- 0.43 acre lot
- Built 1960
Tags
Neighborhood map
What this means for you Summary
Snapshot
- This is a 3-bed/2.0-bath single-family listed at $150k.
Deal economics
- At list price, monthly cash flow is $663 ($8k/yr) — positive.
- The deal already cash-flows at list — no discount required.
- Meets the 1% rule at list price ($2k rent vs $150k).
- Cap rate 11.6% vs local median 2.4% in Asheville — top-decile yield for the area; either an underpriced asset or a hidden risk that comps aren't pricing in. Stress-test before assuming the spread holds.
Location & tenants
- Location reads 72/100 on livability (#96 in NC) — a middle-class / working-renter tenant base. Strengths: commute A+, health & safety A+, housing A-; Watch: crime F.
- Buncombe County Schools (suburban): math 45% / reading 50% proficiency, ranked #72 of 178 in NC (top 40%) — families likely to look elsewhere, expect single-tenant / working-renter base with shorter leases.
- Zoned schools: Oakley Elementary (math 32% / reading 40%, grade F, #812 of 1,410 statewide, top 58%, 433 students, 99% FRL); Reynolds High (math 73% / reading 68%, grade B+, #117 of 535 statewide, top 22%, 1,133 students, 42% FRL) — zoned schools average 71% FRL vs 47% district-wide (23 pts higher); higher-poverty schools than district average — tighter screening recommended.
- Market conditions: Rents soft (-2.2%/yr); 407 active listings in the ZIP; 23 comparable units currently listed for rent nearby; rentals at typical pace (median 23d on market — plan ~3-4 weeks tenant-placement turnaround); 48% of comp listings sitting > 30 days — soft ceiling on asking rent; solid renter incomes; 3,305 units permitted in Buncombe County in 2024 (1,855 in 5+ unit buildings).
- This rent runs 31% of the median local income ($77k/yr) — at the standard rent-burdened threshold; future hikes will face affordability resistance.
Forward outlook
- Local home prices are declining (-3.0%/yr); year-one equity from $1k of loan paydown is wiped out by about $4k of value loss. Plan a longer hold.
- Buncombe County population projected at +24% by 2050 — long-run rental-demand tailwind backs the buy-and-hold thesis.
- At projected returns (-3.0% appreciation + 0.0% rent growth), your $42k cash investment doubles in ~9 years — after that, you're playing with house money.
Negotiation context
- Only 9 days on market — expect competitive offers; lowballing is unlikely to land.
- 7 sale attempts since 10y ago with the ask held roughly flat each time — persistent listings suggest the price (not the market) is what's stuck; bring a comps-based counter.
Questions for the listing agent
- Built in 1960 — when were the roof, HVAC, electrical panel, plumbing, and water heater last replaced?
- Is there a deadline driving the sale (1031 exchange, divorce, estate, relocation)? That informs how much negotiation room exists.
- Schools are B-rated — typically a magnet for longer-tenancy family renters. What's the average tenant stay here, and is there a school-zone premium baked into asking?
- Crime grade is F in this area — have there been break-ins, vandalism, or insurance claims at this property in the last 3 years? What carrier currently insures it and at what premium?
- What's the average days-on-market for RENTAL listings here right now (not sales)? A rising rental-DOM trend means longer vacancies and softer asking-rent achievability than the comps imply.
- What's the recent tenant-quality profile in this submarket — average credit score on applications, eviction rate, late-payment / NSF rate, and stable-employment percentage? A property-management company in the area should have these aggregated.
- How much new for-sale + rental construction is in the pipeline within 1–3 miles? Heavy new supply typically softens prices + rents 12–24 months out; constrained supply supports both.
Investment metrics
- 1% rule
- 1.34% ✓
- Cap rate
- 11.60%
- Cash-on-cash
- 18.97%
- DSCR
- 1.84
- GRM
- 6.2
CMA / ARV
- ARV (on-the-fly)
- $331,632
- Comps found
- 12
Show comp detail 12 sales within ~0.75 mi
| Address | Dist | Beds/Ba | Sqft | Sold | Price | $/sf | Match |
|---|---|---|---|---|---|---|---|
| 67 Robinson Ave | 0.34mi | 3/2.0 | 1,248 (+6%) | 6mo | $315,000 | $252 | 68 |
| 298 School Rd E | 0.31mi | 3/2.0 | 1,028 (-13%) | 1mo | $294,000 | $286 | 64 |
| 7 Wilson Creek Dr | 0.54mi | 4/2.0 (+1) | 1,255 (+7%) | 4mo | $354,000 | $282 | 56 |
| 979 W Chapel Rd | 0.69mi | 3/2.0 | 1,268 (+8%) | 2mo | $257,000 | $203 | 54 |
| 19 Busbee View Rd | 0.73mi | 3/2.0 | 1,126 (-4%) | 9mo | $300,000 | $266 | 52 |
| 6 Meeting St | 0.51mi | 3/2.0 | 1,318 (+12%) | 8mo | $420,000 | $319 | 49 |
| 2 Wilson Creek Dr | 0.51mi | 3/1.5 | 1,023 (-13%) | 5mo | $339,000 | $331 | 48 |
| 81 Davidson Rd | 0.53mi | 3/2.0 | 1,346 (+14%) | 4mo | $370,000 | $275 | 47 |
| 69 Hampton St | 0.70mi | 3/2.0 | 1,272 (+8%) | 9mo | $240,000 | $189 | 47 |
| 34 Fox Dr | 0.43mi | 3/2.0 | 1,344 (+14%) | 12mo | $340,000 | $253 | 46 |
| 7 Spruce Shade Ct | 0.65mi | 3/2.0 | 1,064 (-10%) | 13mo | $362,500 | $341 | 43 |
| 89 Winston Ave | 0.70mi | 3/1.0 | 1,280 (+9%) | 12mo | $470,000 | $367 | 39 |
Match score weights: distance 35% · size 25% · config 20% · recency 20%. Top-matched comps best support the ARV.
Projected returns pro-forma
-3.0% appreciation · 0.0% rent growth · sell at horizon
- IRR
- 7.6%
- Equity multiple
- 1.29×
- Total profit
- $12,037
- Equity at exit
- $22,351
- IRR
- 14.3%
- Equity multiple
- 2.00×
- Total profit
- $41,969
- Equity at exit
- $12,961
Cash invested: $41,972 (down + closing). Projections, not guarantees.
Landlord ↔ Tenant lean methodology
- Overall (STATE)
- 85 Strongly Landlord-Friendly
- State North Carolina
- 85 Strongly Landlord-Friendly · R+3
- County
- — inherits STATE
- City
- — inherits STATE
ZIP-level market 28803
- Rents YoY
- -2.2%
- Active inventory
- 407
- Price-to-rent
- 6.2×
Monthly cashflow live
- Estimated rent
- $2,011 high interval (Pro) →
- Mortgage (P&I)
- −$786
- Tax from tax record
- −$76 /mo · $916/yr
- Insurance
- −$62
- HOA
- −$0
- Vacancy / Maint / Mgmt
- −$422
- Net cashflow
- $663
Break-even live
UW: 25.0% down · 7.5% · 30yr · 1.5% tax · 5.0% vac · 8.0% maint · 8.0% mgmt
Financing live
Cash to close
- Down payment
- $37,475
- Closing costs
- $4,497
- Reserves months
- —
- Total cash needed
- —
Loan-product check · same deal, 3 products live
Conventional
25% down · 7.5% · 30yr
- Down + closing
- —
- Monthly P&I
- —
- Monthly cashflow
- —
- DSCR
- —
- Eligible?
- —
Personal DTI + credit; lowest rate.
DSCR
20% down · 8.5% · 30yr
- Down + closing
- —
- Monthly P&I
- —
- Monthly cashflow
- —
- DSCR
- —
- Eligible?
- —
No personal income docs; deal must DSCR.
Hard money
10% down · 12.0% · 12mo
- Down + closing
- —
- Monthly P&I
- —
- Monthly cashflow
- —
- DSCR
- —
- Eligible?
- —
Short-term bridge; refi at stabilization.
Rent comps 23 comps
| Address | Beds | Baths | Sqft | Rent | $/sqft | DOM | Units | Dist |
|---|---|---|---|---|---|---|---|---|
| 42 Davidson Rd Asheville, NC | 2.0 | 2.0 | 1036 | $2,295 | $2.22 | 13d | 1 | 0.44mi |
| 8 Loblolly Ln Asheville, NC | 3.0 | 2.0 | 1293 | $2,275 | $1.76 | 43d | 1 | 0.47mi |
| 279 Rock Hill Rd Asheville, NC | 3.0 | 3.0 | 1436 | $2,000 | $1.39 | 21d | 1 | 0.64mi |
| 96 Oakley Rd Asheville, NC | 3.0 | 2.0 | 1065 | $2,400 | $2.25 | 43d | 1 | 0.93mi |
| 17 Unaka Ave Unit A Asheville, NC | 2.0 | 1.0 | 735 | $1,475 | $2.01 | 21d | 1 | 0.95mi |
| 23 Dawnwood Cir Asheville, NC | 2.0 | 1.0 | 768 | $1,150 | $1.50 | 43d | 1 | 1.03mi |
| 22 Dawnwood Cir Asheville, NC | 2.0 | 1.0 | 768 | $1,150 | $1.50 | 23d | 1 | 1.03mi |
| 28 Dawnwood Cir Asheville, NC | 2.0 | 1.0 | 768 | $1,150 | $1.50 | 13d | 1 | 1.04mi |
| 77 E Porter Rd Unit B Asheville, NC | 2.0 | 1.0 | 900 | $1,700 | $1.89 | 43d | 1 | 1.05mi |
| 35 Dawnwood Cir Asheville, NC | 2.0 | 1.0 | 768 | $1,270 | $1.65 | 43d | 1 | 1.06mi |
| 55 Dawnwood Cir Asheville, NC | 2.0 | 1.0 | 768 | $1,320 | $1.72 | 43d | 1 | 1.06mi |
| 48 Dawnwood Cir Asheville, NC | 2.0 | 1.0 | 768 | $1,250 | $1.63 | 13d | 1 | 1.07mi |
| 1191 Bleachery Blvd Asheville, NC | 2.0 | 2.5 | 1278 | $1,750 | $1.37 | 23d | 1 | 1.08mi |
| 617 Reed St Asheville, NC | 3.0 | 2.0 | 1345 | $2,250 | $1.67 | 43d | 1 | 1.18mi |
| 16 Main St Asheville, NC | 3.0 | 1.0 | 1188 | $2,500 | $2.10 | 43d | 1 | 1.20mi |
| 1020 Hendersonville Rd Unit 2 Asheville, NC | 2.0 | 2.0 | 1235 | $1,295 | $1.05 | 13d | 1 | 1.26mi |
| 725 Ridge Rd Asheville, NC | 3.0 | 1.0 | 906 | $1,995 | $2.20 | 43d | 1 | 1.28mi |
| 15 Future Dr Asheville, NC | 2.0–3.0 | 1.0 | 868 | $1,969 | $2.27 | 13d | 7 | 1.29mi |
| 170 Reed St Asheville, NC | 3.0 | 2.5 | 1452 | $2,675 | $1.84 | 43d | 1 | 1.36mi |
| 71 Stoner Rd Asheville, NC | 3.0 | 2.5 | 1498 | $2,650 | $1.77 | 13d | 1 | 1.40mi |
| 98 Woodstream Ln Asheville, NC | 1.0–3.0 | 1.0–2.0 | 975 | $1,884 | $1.93 | 13d | 13 | 1.45mi |
| 59 East St Asheville, NC | 3.0 | 1.0 | 978 | $1,825 | $1.87 | 43d | 1 | 1.46mi |
| 4110 Verde Vista Cir Asheville, NC | 3.0 | 1.0–2.0 | 2011 | $3,966 | $1.97 | 13d | 33 | 1.47mi |
Listing history 25 events
-
2026-04-24status Pending
-
2026-04-16$149,900 Active
-
2024-08-16historical Active Under Contract
-
2024-06-19$300,000 Active
-
2024-06-13soldstatus $270,000
-
2024-02-14price $284,500
-
2024-02-07price $299,900
-
2024-02-02$329,900 Active
-
2019-05-01price $245,000
-
2017-04-21soldstatus $217,000
-
2017-04-21soldstatus $217,000 Sold
-
2017-04-21soldstatus $217,000
-
2017-02-28historical Under Contract (Show)
-
2017-02-28historical
-
2017-02-08price $225,000
-
2017-01-27$229,000 Active
-
2017-01-27$225,000
-
2016-06-24price $62,000
-
2016-06-24soldstatus $62,000
-
2016-06-24soldstatus $62,000 Sold
-
2016-06-24soldstatus $62,000
-
2016-06-15historical
-
2016-06-10Under Contract (Show)
-
2016-06-10historical
-
2016-06-08$75,000
ⓘ Source: listings_history table (triggers on properties + properties_extension) + one-shot
backfill from property_details.listing_events for pre-trigger history.
Tax reassessment forecast NC · Resets to sale price
- Current annual tax
- $916 · $76/mo
- Projected year-2 tax
- $1,229 · $102/mo
- Expected delta
- +$313/yr (+$26/mo · 34.2%)
ⓘ Screening estimate from a state-policy table — verify with the county assessor before closing.
Climate risk First Street
- Flood 1/10 Low FEMA zone X (unshaded) · 0% chance over 30 yrs
- Wildfire 3/10 Moderate
- Heat 4/10 Moderate 8 d/yr ≥95°F today · 21 d/yr by 30 yrs out
- Wind 2/10 Low
- Air quality 3/10 Moderate 3 unhealthy d/yr today · 4 by 30 yrs out
Nearby sold comps map
Loading sold comps map…
Walkable amenities ~0.75 mi
Loading nearby amenities…
Taxation est. · year 1
- Rental income
- $24,127
- − Mortgage interest
- −$8,397
- − Property taxes
- −$916
- − Insurance
- −$750
- − Repairs & maintenance
- −$1,930
- − Management
- −$1,930
- − Depreciation
- −$4,361
- Taxable income
- $5,844
- Est. tax owed @ 24.0%
- −$1,402
- After-tax cash flow
- $6,559/yr
For passive investors: Depreciation is non-cash, so a rental often shows a tax loss while cash-flowing — sheltering income. Rental losses are passive: they offset passive income freely, and up to $25,000/yr can offset ordinary (W-2) income if you actively participate and your MAGI is under $100k (phasing out to $0 by $150k); unused losses carry forward. On sale, claimed depreciation is recaptured at up to 25%, and gains may owe capital-gains tax (a 1031 exchange can defer both). Figures are a year-1 estimate at your 24.0% rate — not tax advice; consult a CPA.
Schools (NCES district)
- District
- Buncombe County Schools
- NCES district ID
- 3700450
- Math proficiency
- 45% ▬ 0.00%
- Reading proficiency
- 50% ▲ 2.00%
- Median HH income
- $45,981
- Composite
- 40.32/100
- National rank
- #3749
- State rank
- #72 of 178 in NC
Livability — Asheville
- Score
- 72/100
- State rank
- #96
- US rank
- #6307
Category grades
Schools grade is shown separately in the Schools card above.
Census & demographics
- County
- Buncombe County · 241,085 people
- City population
- 137,611
- Metro
- Asheville, NC
- Population (ZIP)
- 33,718
- Household income
- $76,662
- Rent vs Own
- Severe rent burden
- 1583.0
Population outlook (Buncombe County) Hauer SSP2
- Today (2025)
- 286,475 people
- By 2030
- 302,237 · +5.5%
- By 2040
- 330,687 · +15.4%
- By 2050
- 356,370 · +24.4%
- By 2075
- 409,383 · +42.9%
- By 2100
- 437,270 · +52.6%
Race, ethnicity, and origin ACS 2023
- Neighborhood character
- Predominantly White (78%)
- Race & ethnicity
- White 78% Hispanic / Latino 10% Black 7% Two or more races 7% Asian 2%
- Hispanic origin (detail)
- Mexican 2% Puerto Rican 1% Cuban 1%
- Common ancestry
- Slovak 5% Lithuanian 3% Serbian 3%
- Foreign-born
- 9% · Canada, Jamaica
- Languages at home
- 89% English-only · Spanish 7% Other Indo-European 1% Russian/Polish/Slavic 1%
Political lean MEDSL · Buncombe
- 2024 margin
- Strong D (+24.8) · D 61.7% · R 36.9% · Other 1.4%
- 2008→2024 swing
- +10.9pp toward D · 2008: 13.9pp · 2024: 24.8pp
- All cycles
- 2024: D+24.8 2020: D+21.1 2016: D+14.6 2012: D+12.4 2008: D+13.9
Not yet ingested
- Civics
- —
Market trends
- HPI YoY
- ▼ -217.76%
- Current HPI
- 272.6799
- Rent YoY
- ▼ -2.17%
- Metro
- Asheville, NC
- State GDP YoY
- ▲ 3.28%
- F500 in state
- 26
Industry mix (Fortune 500 HQ in NC)
| Industry | F500 HQs | Revenue |
|---|---|---|
| Financial Services | 2 | $213B |
|
||
| Retail | 2 | $95B |
|
||
| Industrial Conglomerate | 1 | $38B |
|
||
| Metals / Steel | 1 | $35B |
|
||
| Utilities | 1 | $30B |
|
||
| Industrial Machinery | 1 | $19B |
|
||
Price history
+99.9% since first listed25 events — show timeline
- 2026-04-24 Pending — CANOPYMLS as Distributed by MLS Grid
- 2026-04-16 Listed $149,900 CANOPYMLS as Distributed by MLS Grid
- 2024-08-16 Contingent — CANOPYMLS as Distributed by MLS Grid
- 2024-06-19 Listed $300,000 CANOPYMLS as Distributed by MLS Grid
- 2024-06-13 Sold (Public Records) $270,000 Public Records
- 2024-02-14 Price Changed $284,500 CANOPYMLS as Distributed by MLS Grid
- 2024-02-07 Price Changed $299,900 CANOPYMLS as Distributed by MLS Grid
- 2024-02-02 Listed $329,900 CANOPYMLS as Distributed by MLS Grid
- 2019-05-01 Price Changed $245,000 CANOPYMLS as Distributed by MLS Grid
- 2017-04-21 Sold (Public Records) $217,000 Public Records
- 2017-04-21 Sold (MLS) $217,000 NCMMLS
- 2017-04-21 Sold (MLS) $217,000 CANOPYMLS as Distributed by MLS Grid
- 2017-02-28 Contingent — NCMMLS
- 2017-02-28 Delisted — CANOPYMLS as Distributed by MLS Grid
- 2017-02-08 Price Changed $225,000 NCMMLS
- 2017-01-27 Listed $229,000 NCMMLS
- 2017-01-27 Listed $225,000 CANOPYMLS as Distributed by MLS Grid
- 2016-06-24 Price Changed $62,000 NCMMLS
- 2016-06-24 Sold (Public Records) $62,000 Public Records
- 2016-06-24 Sold (MLS) $62,000 NCMMLS
- 2016-06-24 Sold (MLS) $62,000 CANOPYMLS as Distributed by MLS Grid
- 2016-06-15 Delisted — NCMMLS
- 2016-06-10 Listed — NCMMLS
- 2016-06-10 Delisted — CANOPYMLS as Distributed by MLS Grid
- 2016-06-08 Listed $75,000 CANOPYMLS as Distributed by MLS Grid
Property tax history
+0.5%/yrLatest (2025): $916 · -33.9% YoY. Source: county tax records.
Cash-flow waterfall
monthlySold comps — $/sqft
last 12 mo · ≤1 miLoading sold comps…