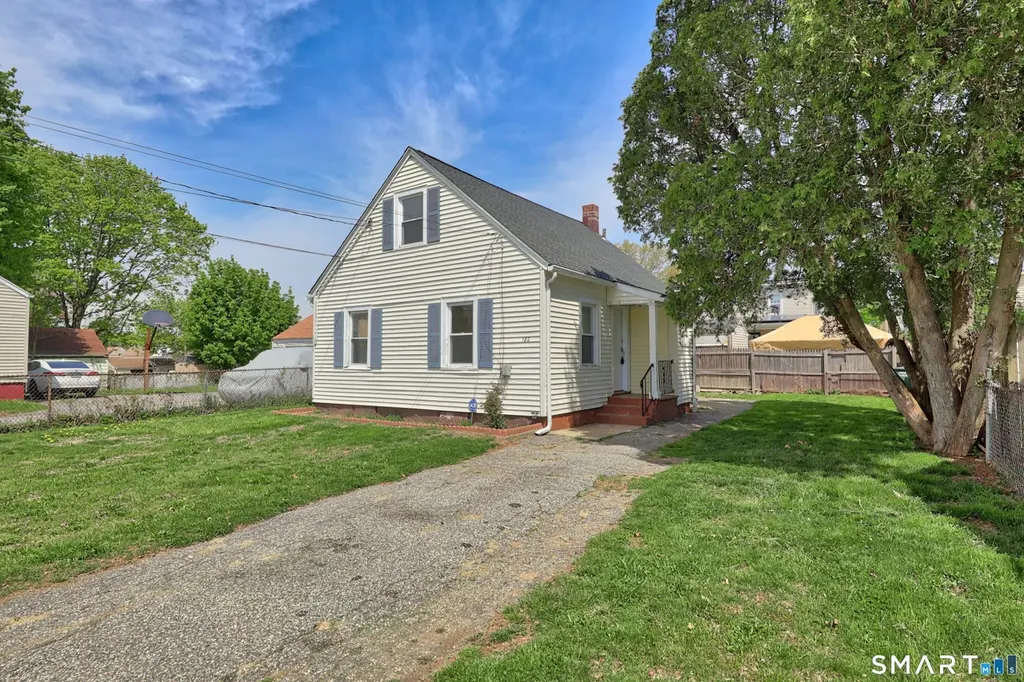
182 Trumbull Ave · Bridgeport, CT
Flood risk 1/10 · Minimal
- FEMA flood zone
- X (unshaded)
- Chance of flooding over 30 yrs
- 0.0%
- Est. flood insurance / yr
- $473 – $860
Fire risk 1/10 · Minimal
- Est. fire insurance / yr
- $829 – $1,539
Heat risk 6/10 · Moderate
- Hot days now (above 97°F)
- 7 days/yr
- Hot days in 30 yrs
- 15 days/yr
Wind risk 6/10 · Moderate
- Chance of severe wind over 30 yrs
- 41.0%
Air-quality risk 4/10 · Minor
- Unhealthy air days now
- 5 days/yr
- Unhealthy air days in 30 yrs
- 7 days/yr
Risk factors via First Street. Map © Google.
Why this score? — see what drove the D grade
The composite is a weighted blend of 9 inputs, each scored 0–100. Each bar is that input's sub-score; the figure is the points it added to the 100-point composite (weight × sub-score).
- Cash flow +12.7/30.0
- ARV discount +10.7/15.0
- Livability +4.0/5.0
- DSCR +3.8/10.0
- 1% rule +3.6/10.0
- Rent growth +3.3/5.0
- Condition / age +2.5/5.0
- Schools +1.2/10.0
- Appreciation +0.0/10.0
$339,000
🖨 Deal sheet (PDF) 📄 Offer letter ✓ Due diligence
Listing remarks
Charming Cape Cod-style single-family home located in Bridgeport's desirable North End! This move-in-ready property features 3 spacious bedrooms and 1 full bathroom, offering comfort and functionality for today's lifestyle. The updated kitchen includes modern cabinetry and stainless steel appliances, perfect for everyday living and entertaining. Enjoy a large, private backyard ideal for outdoor gatherings, gardening, or relaxing. The home also offers a private driveway with space for 3 or more vehicles, providing ample off-street parking. Conveniently situated near Sacred Heart University, Trumbull Mall, local parks, libraries, shopping, dining, and major highways including the Merritt Park
Key facts
- Cape cod-style
- Private driveway
- Private backyard
Tags
Property features AI
Exterior
- Parking: Driveway parking; 4 total parking spaces
- Utilities: Public water connected; Public sewer connected; Hot water: other
- Home design: Single-family home
- Construction: Asphalt shingle roof; Vinyl siding; Concrete foundation; Other construction description
- Exterior features: Level lot; Private driveway
Interior
- Kitchen: Gas range; Microwave; Refrigerator; Dishwasher
- Bedrooms: 3 bedrooms
- Bathrooms: 1 full bathroom
- Heating & cooling: Hot air heating fueled by natural gas; Window cooling unit
- Interior features: Total of 5 rooms; No basement
- Laundry & utility: Washer and dryer located in the main-floor kitchen
Neighborhood map
What this means for you Summary
Snapshot
- This is a 3-bed/1.0-bath single-family listed at $339k.
Deal economics
- At list price, monthly cash flow is $-39 ($-469/yr) — negative.
- To cash-flow at today's rent, offer at most $332k (2.0% below list).
- To meet the 1% rule (rent ≥ 1% of price), the offer needs to be $293k (13.5% below list).
- Recommended offer: $293k (13.5% below list) — sets the bar for 1% rule.
- Cap rate 6.2% vs local median 5.0% in Bridgeport — meaningfully above typical; check what's discounted (condition, days-on-market, listing class) to confirm the premium yield is real.
Location & tenants
- Location reads 81/100 on livability (#15 in CT, #1,374 nationally) — a professional / high-income tenant draw. Strengths: amenities A+, commute A+, health & safety A+; Watch: crime C-, employment D+, schools D-.
- Bridgeport School District (urban): math 9% / reading 19% proficiency, ranked #151 of 153 in CT (top 99%) — low school quality limits family demand, transient renter base, plan for 1-2y turnover; 97% free/reduced lunch — lower-income household profile, screen leases tightly.
- Market conditions: Rents rising (+3.1%/yr); 152 active listings in the ZIP; 39 comparable units currently listed for rent nearby; rentals at typical pace (median 26d on market — plan ~3-4 weeks tenant-placement turnaround); 852 units permitted in Greater Bridgeport Planning Region in 2024 (698 in 5+ unit buildings).
- At $2,932/mo this rent would consume 48% of the median local household income ($73k/yr) (locally 2163% of renters already pay >50% of income on rent) — very limited rent-growth headroom before tenants either downsize or default.
Forward outlook
- Local home prices are declining (-3.0%/yr); year-one equity from $2k of loan paydown is wiped out by about $10k of value loss. Plan a longer hold.
Negotiation context
- It's been on market 28 days — a 2% lower offer ($334k) is reasonable based on typical stale-listing flexibility.
- 15 sale attempts since 34y ago with the ask held roughly flat each time — persistent listings suggest the price (not the market) is what's stuck; bring a comps-based counter.
Risks & watch-outs
- Watch-outs: built in 1941 — expect roof / HVAC / electrical / plumbing capex.
- Climate carrying-cost: major wind risk, 41% chance of damaging wind over 30y; extreme-heat days projected 7→15/yr by 2055 (HVAC capex compounding) — expect insurance premiums to compound above CPI over the hold.
Questions for the listing agent
- What do current leases actually rent for vs. the listed asking? Can we see a recent rent roll and the last 12 months of T-12 income?
- Built in 1941 — when were the roof, HVAC, electrical panel, plumbing, and water heater last replaced?
- Is there a deadline driving the sale (1031 exchange, divorce, estate, relocation)? That informs how much negotiation room exists.
- Schools are D-rated, which usually means shorter tenancies and higher turnover. Who's the typical renter profile here, and what's been the actual vacancy rate?
- The area grade is low — what's the realistic commute time and amenity access for the typical tenant pool here? Any planned neighborhood developments (good or bad) we should know about?
- What's the average days-on-market for RENTAL listings here right now (not sales)? A rising rental-DOM trend means longer vacancies and softer asking-rent achievability than the comps imply.
- What's the recent tenant-quality profile in this submarket — average credit score on applications, eviction rate, late-payment / NSF rate, and stable-employment percentage? A property-management company in the area should have these aggregated.
- How much new for-sale + rental construction is in the pipeline within 1–3 miles? Heavy new supply typically softens prices + rents 12–24 months out; constrained supply supports both.
Investment metrics
- 1% rule
- 0.86% ✗
- Cap rate
- 6.15%
- Cash-on-cash
- -0.49%
- DSCR
- 0.98
- GRM
- 9.6
CMA / ARV
- ARV (median comp)
- $365,000
- List price
- $339,000
- Delta
- -7.12%
- Verdict
- FAIR
- Comps
- 20 within 1.0 mi
Show comp detail 12 sales within ~0.75 mi
| Address | Dist | Beds/Ba | Sqft | Sold | Price | $/sf | Match |
|---|---|---|---|---|---|---|---|
| 209 Trumbull Ave | 0.05mi | 3/1.0 | 995 (-1%) | 1mo | $350,000 | $352 | 96 |
| 153 Marigold Ave | 0.17mi | 3/2.0 | 994 (-1%) | 1mo | $360,000 | $362 | 86 |
| 1088 Sylvan Ave | 0.34mi | 3/1.0 | 1,050 (+5%) | 7mo | $339,000 | $323 | 70 |
| 539 Old Town Rd | 0.10mi | 4/1.0 (+1) | 1,096 (+10%) | 6mo | $375,000 | $342 | 70 |
| 1030 Old Town Rd | 0.41mi | 3/1.0 | 1,029 (+3%) | 13mo | $430,000 | $418 | 66 |
| 81 Dodd Ave | 0.48mi | 3/1.0 | 1,076 (+8%) | 0mo | $440,000 | $409 | 65 |
| 130 Wilkins Ave | 0.57mi | 3/1.0 | 1,025 (+2%) | 6mo | $342,000 | $334 | 65 |
| 75 Edwards St | 0.53mi | 3/1.0 | 1,012 (+1%) | 13mo | $430,000 | $425 | 63 |
| 227 Sylvan St | 0.33mi | 2/1.5 (-1) | 1,072 (+7%) | 5mo | $225,000 | $210 | 61 |
| 235 Douglas St | 0.70mi | 3/1.0 | 1,056 (+6%) | 3mo | $350,000 | $331 | 56 |
| 360 Saunders Ave | 0.68mi | 2/2.0 (-1) | 1,024 (+2%) | 1mo | $290,000 | $283 | 55 |
| 135 Grey Rock Rd | 0.51mi | 3/1.5 | 1,150 (+15%) | 7mo | $410,000 | $357 | 44 |
Match score weights: distance 35% · size 25% · config 20% · recency 20%. Top-matched comps best support the ARV.
Projected returns pro-forma
-3.0% appreciation · 3.12% rent growth · sell at horizon
- IRR
- -17.0%
- Equity multiple
- 0.40×
- Total profit
- $-57,017
- Equity at exit
- $50,546
- IRR
- -8.6%
- Equity multiple
- 0.46×
- Total profit
- $-51,188
- Equity at exit
- $29,311
Cash invested: $94,920 (down + closing). Projections, not guarantees.
Landlord ↔ Tenant lean methodology
- Overall (STATE)
- 27 Tenant-Leaning
- State Connecticut
- 27 Tenant-Leaning · D+7
- County
- — inherits STATE
- City
- — inherits STATE
ZIP-level market 06606
- Rents YoY
- 3.1%
- Active inventory
- 152
- Price-to-rent
- 9.6×
Monthly cashflow live
- Estimated rent
- $2,932 high interval (Pro) →
- Mortgage (P&I)
- −$1,778
- Tax from tax record
- −$436 /mo · $5,237/yr
- Insurance
- −$141
- HOA
- −$0
- Vacancy / Maint / Mgmt
- −$616
- Net cashflow
- $-39
Break-even live
Sensitivity live
| Price | -10% $153 | -5% $57 | +0% $-39 | +5% $-135 | +10% $-231 |
|---|---|---|---|---|---|
| Rent | -10% $-271 | -5% $-155 | +0% $-39 | +5% $77 | +10% $193 |
| Rate | -1.0pp $132 | -0.5pp $47 | base $-39 | +0.5pp $-127 | +1.0pp $-216 |
UW: 25.0% down · 7.5% · 30yr · 1.5% tax · 5.0% vac · 8.0% maint · 8.0% mgmt
Financing live
Cash to close
- Down payment
- $84,750
- Closing costs
- $10,170
- Reserves months
- —
- Total cash needed
- —
Loan-product check · same deal, 3 products live
Conventional
25% down · 7.5% · 30yr
- Down + closing
- —
- Monthly P&I
- —
- Monthly cashflow
- —
- DSCR
- —
- Eligible?
- —
Personal DTI + credit; lowest rate.
DSCR
20% down · 8.5% · 30yr
- Down + closing
- —
- Monthly P&I
- —
- Monthly cashflow
- —
- DSCR
- —
- Eligible?
- —
No personal income docs; deal must DSCR.
Hard money
10% down · 12.0% · 12mo
- Down + closing
- —
- Monthly P&I
- —
- Monthly cashflow
- —
- DSCR
- —
- Eligible?
- —
Short-term bridge; refi at stabilization.
Rent comps 39 comps
| Address | Beds | Baths | Sqft | Rent | $/sqft | DOM | Units | Dist |
|---|---|---|---|---|---|---|---|---|
| 5 Cloverhill Ave Bridgeport, CT | 4.0 | 2.0 | 1344 | $4,000 | $2.98 | 4d | 1 | 0.07mi |
| 50 Trumbull Ave Bridgeport, CT | 2.0 | 1.0 | 1200 | $2,400 | $2.00 | 25d | 1 | 0.09mi |
| 207 Hillcrest Rd Bridgeport, CT | 3.0 | 2.0 | 1264 | $3,600 | $2.85 | 12d | 1 | 0.44mi |
| 66 Dodd Ave Unit 2 Bridgeport, CT | 2.0 | 1.0 | 728 | $2,450 | $3.37 | 13d | 1 | 0.45mi |
| 100 Avalon Gates Trumbull, CT | 1.0–3.0 | 1.0–2.0 | 1082 | $3,390 | $3.13 | 4d | 28 | 0.45mi |
| 70 Pitt St Bridgeport, CT | 4.0 | 1.0 | 1208 | $3,200 | $2.65 | 23d | 1 | 0.52mi |
| 74 Village Ln Bridgeport, CT | 3.0 | 2.0 | 1428 | $3,500 | $2.45 | 4d | 1 | 0.77mi |
| 100 Woodside Ct Trumbull, CT | 1.0–2.0 | 1.0–2.5 | 1117 | $3,786 | $3.39 | 4d | 10 | 0.80mi |
| 614 Earl Ave Bridgeport, CT | 2.0 | 1.0 | 748 | $2,300 | $3.07 | 45d | 1 | 0.83mi |
| 577 Sylvan Ave Unit 201 Bridgeport, CT | 2.0 | 2.0 | 875 | $2,075 | $2.37 | 16d | 1 | 0.85mi |
| 120 Huntington Tpke #809 Bridgeport, CT | 2.0 | 1.0 | 940 | $2,100 | $2.23 | 5d | 1 | 0.95mi |
| 180 Pleasantview Ave Bridgeport, CT | 3.0 | 2.0 | 1373 | $3,700 | $2.69 | 45d | 1 | 1.00mi |
| 14 Infield St Bridgeport, CT | 3.0 | 2.5 | 1344 | $3,200 | $2.38 | 45d | 1 | 1.04mi |
| 131 Infield St Bridgeport, CT | 3.0 | 1.5 | 1199 | $3,450 | $2.88 | 45d | 1 | 1.04mi |
| 845 Hart St Unit 2 Bridgeport, CT | 3.0 | 1.0 | 1200 | $2,500 | $2.08 | 45d | 1 | 1.04mi |
| 125 Louisiana Ave #125 Bridgeport, CT | 2.0 | 1.0 | 1448 | $1,750 | $1.21 | 45d | 1 | 1.04mi |
| 183 Livingston Pl #1 Bridgeport, CT | 2.0 | 1.5 | 1175 | $1,950 | $1.66 | 45d | 1 | 1.06mi |
| 100 Oakview Dr Trumbull, CT | 1.0–2.0 | 1.0–2.0 | 1028 | $3,390 | $3.30 | 4d | 1 | 1.06mi |
| 524 Beechmont Ave Bridgeport, CT | 3.0 | 1.0 | 1104 | $3,500 | $3.17 | 25d | 1 | 1.14mi |
| 51 Indian Ave Unit 1546115P Bridgeport, CT | 3.0 | 1.0 | 1388 | $3,871 | $2.79 | 13d | 1 | 1.15mi |
| 220 Alpine St Unit 222 3rd floor Bridgeport, CT | 2.0 | 1.0 | 900 | $2,000 | $2.22 | 45d | 1 | 1.17mi |
| 35 Nob Hill Cir Unit D Bridgeport, CT | 2.0 | 1.0 | 900 | $2,050 | $2.28 | 45d | 1 | 1.17mi |
| 110 Grenelle St Bridgeport, CT | 3.0 | 1.0 | 1351 | $4,000 | $2.96 | 5d | 1 | 1.18mi |
| 30 Quarry St Bridgeport, CT | 1.0–2.0 | 1.0 | 805 | $1,825 | $2.27 | 25d | 3 | 1.20mi |
| 191 DuPont Pl Bridgeport, CT | 2.0 | 1.0 | 810 | $1,850 | $2.28 | 25d | 1 | 1.21mi |
| 282 Texas Ave Unit Nob Bridgeport, CT | 2.0 | 1.0 | 980 | $2,000 | $2.04 | 16d | 1 | 1.23mi |
| 119 Dupont Pl Bridgeport, CT | 2.0 | 1.0 | 820 | $2,000 | $2.44 | 45d | 1 | 1.24mi |
| 715 Frenchtown Rd #4 Bridgeport, CT | 2.0 | 1.5 | 1200 | $2,300 | $1.92 | 25d | 1 | 1.24mi |
| 715 Frenchtown Rd #40 Bridgeport, CT | 2.0 | 1.5 | 1200 | $2,500 | $2.08 | 45d | 1 | 1.24mi |
| 3250 Main St Unit B209 Bridgeport, CT | 2.0 | 2.0 | 813 | $2,000 | $2.46 | 45d | 1 | 1.31mi |
| 454 Summit St Bridgeport, CT | 2.0 | 1.0 | 1010 | $2,000 | $1.98 | 45d | 1 | 1.31mi |
| 980 Lindley St Unit 304F Bridgeport, CT | 2.0 | 2.0 | 936 | $2,200 | $2.35 | 25d | 1 | 1.32mi |
| 39 Asia Cir Bridgeport, CT | 4.0 | 2.5 | 1411 | $3,650 | $2.59 | 25d | 1 | 1.38mi |
| 173 Fairview Ave Unit 3 Bridgeport, CT | 3.0 | 1.0 | 1000 | $2,300 | $2.30 | 45d | 1 | 1.39mi |
| 208 Fairview Ave Bridgeport, CT | 3.0 | 1.0 | 1200 | $2,300 | $1.92 | 25d | 1 | 1.41mi |
| 97 Wentworth St Unit 3 Bridgeport, CT | 2.0 | 1.0 | 950 | $2,000 | $2.11 | 4d | 1 | 1.41mi |
| 200 Woodmont Ave #127 Bridgeport, CT | 2.0 | 1.5 | 1184 | $2,600 | $2.20 | 25d | 1 | 1.42mi |
| 68-70 Westfield Ave Bridgeport, CT | 2.0 | 1.0 | 888 | $2,200 | $2.48 | 5d | 1 | 1.45mi |
| 68-70 Westfield Ave Bridgeport, CT | 4.0 | 2.0 | 1470 | $3,200 | $2.18 | 16d | 1 | 1.45mi |
Listing history 39 events
-
2026-05-14historical Under Contract - Continue to Show 820-char remark
-
2026-04-30$339,000 Active 820-char remark
-
2025-12-19historical
-
2025-12-04price $339,000
-
2025-11-12price $349,000
-
2025-10-21price $359,000
-
2025-10-10$379,000 Active
-
2023-08-08historical
-
2019-06-26soldstatus $840,000
-
2019-02-07historical
-
2018-12-08historical Under Contract - Continue to Show
-
2018-12-07$119,000 Active
-
2012-12-07historical
-
2012-08-24$89,900
-
2010-02-07historical
-
2009-12-17$120,000
-
2009-07-14soldstatus $45,150
-
2009-02-24$85,000
-
2006-04-10soldstatus $205,000
-
2006-04-07soldstatus $205,000
-
2005-11-18$204,900
-
2004-05-05soldstatus $118,000
-
2004-05-05soldstatus $122,700
-
2003-11-16$130,900
-
2003-09-26historical
-
2003-03-26$130,000
-
2003-03-11historical
-
2002-03-12$109,900
-
1999-11-24soldstatus $64,000
-
1999-11-19soldstatus $61,000
-
1999-07-03$64,500
-
1999-04-14historical
-
1998-10-22$54,900
-
1995-07-07soldstatus $59,000
-
1994-05-05$59,000
-
1994-04-24historical
-
1993-06-25$79,500
-
1992-11-14historical
-
1992-08-31$88,900
ⓘ Source: listings_history table (triggers on properties + properties_extension) + one-shot
backfill from property_details.listing_events for pre-trigger history.
Tax reassessment forecast CT · Partial reset (capped growth)
- Current annual tax
- $5,237 · $436/mo
- Projected year-2 tax
- $6,246 · $520/mo
- Expected delta
- +$1,009/yr (+$84/mo · 19.3%)
ⓘ Screening estimate from a state-policy table — verify with the county assessor before closing.
Climate risk First Street
- Flood 1/10 Low FEMA zone X (unshaded) · 0% chance over 30 yrs
- Wildfire 1/10 Low
- Heat 6/10 Major 7 d/yr ≥97°F today · 15 d/yr by 30 yrs out
- Wind 6/10 Major 41% chance of damaging wind over 30 yrs
- Air quality 4/10 Moderate 5 unhealthy d/yr today · 7 by 30 yrs out
Nearby sold comps map
Loading sold comps map…
Walkable amenities ~0.75 mi
Loading nearby amenities…
Taxation est. · year 1
- Rental income
- $35,184
- − Mortgage interest
- −$18,989
- − Property taxes
- −$5,237
- − Insurance
- −$1,695
- − Repairs & maintenance
- −$2,815
- − Management
- −$2,815
- − Depreciation
- −$9,862
- Taxable loss
- −$6,228
- Est. tax savings @ 24.0%
- +$1,495
- After-tax cash flow
- $1,025/yr
For passive investors: Depreciation is non-cash, so a rental often shows a tax loss while cash-flowing — sheltering income. Rental losses are passive: they offset passive income freely, and up to $25,000/yr can offset ordinary (W-2) income if you actively participate and your MAGI is under $100k (phasing out to $0 by $150k); unused losses carry forward. On sale, claimed depreciation is recaptured at up to 25%, and gains may owe capital-gains tax (a 1031 exchange can defer both). Figures are a year-1 estimate at your 24.0% rate — not tax advice; consult a CPA.
Schools (NCES district)
- District
- Bridgeport School District
- NCES district ID
- 0900450
- Math proficiency
- 9% ▼ -7.00%
- Reading proficiency
- 19% ▼ -10.00%
- Median HH income
- $41,507
- Composite
- 12.09/100
- National rank
- #9656
- State rank
- #151 of 153 in CT
Livability — Bridgeport
- Score
- 81/100
- State rank
- #15
- US rank
- #1374
Category grades
Schools grade is shown separately in the Schools card above.
Census & demographics
- Census place
- Bridgeport, CT
- County
- Fairfield County · 765,532 people
- City population
- 149,153
- Metro
- Bridgeport-Stamford-Norwalk, CT
- Population (ZIP)
- 49,308
- Household income
- $73,372
- Rent vs Own
- Severe rent burden
- 2163.0
Population outlook (Greater Bridgeport County) Hauer SSP2
- By 2040
- 365,581
Race, ethnicity, and origin ACS 2023
- Neighborhood character
- Highly diverse neighborhood (Simpson 0.73)
- Race & ethnicity
- Hispanic / Latino 37% White 31% Black 19% Two or more races 11% Asian 7%
- Hispanic origin (detail)
- Mexican 5% Puerto Rican 12% Dominican 4%
- Common ancestry
- Estonian 5% Russian 4% Romanian 3%
- Foreign-born
- 37% · Canada, Jamaica, Vietnam
- Languages at home
- 50% English-only · Spanish 27% Other Indo-European 15% French/Haitian/Cajun 2%
Political lean MEDSL · Greater Bridgeport
- 2024 margin
- Strong D (+23.3) · D 60.9% · R 37.6% · Other 1.5%
- All cycles
- 2024: D+23.3
Not yet ingested
- Civics
- —
Market trends
- HPI YoY
- ▼ -270.11%
- Current HPI
- 345.647
- Rent YoY
- ▲ 3.12%
- Metro
- Bridgeport-Stamford-Norwalk, CT
- State GDP YoY
- ▲ 1.06%
- F500 in state
- 38
Industry mix (Fortune 500 HQ in CT)
| Industry | F500 HQs | Revenue |
|---|---|---|
| Industrial Machinery | 4 | $38B |
|
||
| Insurance | 3 | $71B |
|
||
| Financial Services | 2 | $25B |
|
||
| Transportation / Logistics | 2 | $18B |
|
||
| Healthcare | 1 | $247B |
|
||
| Telecommunications | 1 | $55B |
|
||
Price history
+281.3% since first listed40 events — show timeline
- 2026-05-28 Pending — Smart MLS
- 2026-05-14 Contingent — Smart MLS
- 2026-04-30 Listed $339,000 Smart MLS
- 2025-12-19 Listing Removed — Smart MLS
- 2025-12-04 Price Changed $339,000 Smart MLS
- 2025-11-12 Price Changed $349,000 Smart MLS
- 2025-10-21 Price Changed $359,000 Smart MLS
- 2025-10-10 Listed $379,000 Smart MLS
- 2023-08-08 Rental Removed — BUILDIUM
- 2019-06-26 Sold (Public Records) $840,000 Public Records
- 2019-02-07 Listing Removed — Smart MLS
- 2018-12-08 Contingent — Smart MLS
- 2018-12-07 Listed $119,000 Smart MLS
- 2012-12-07 Listing Removed — Smart MLS
- 2012-08-24 Listed $89,900 Smart MLS
- 2010-02-07 Listing Removed — Smart MLS
- 2009-12-17 Listed $120,000 Smart MLS
- 2009-07-14 Sold (MLS) $45,150 Smart MLS
- 2009-02-24 Listed $85,000 Smart MLS
- 2006-04-10 Sold (Public Records) $205,000 Public Records
- 2006-04-07 Sold (MLS) $205,000 Smart MLS
- 2005-11-18 Listed $204,900 Smart MLS
- 2004-05-05 Sold (Public Records) $122,700 Public Records
- 2004-05-05 Sold (MLS) $118,000 Smart MLS
- 2003-11-16 Listed $130,900 Smart MLS
- 2003-09-26 Listing Removed — Smart MLS
- 2003-03-26 Listed $130,000 Smart MLS
- 2003-03-11 Listing Removed — Smart MLS
- 2002-03-12 Listed $109,900 Smart MLS
- 1999-11-24 Sold (Public Records) $64,000 Public Records
- 1999-11-19 Sold (MLS) $61,000 Smart MLS
- 1999-07-03 Listed $64,500 Smart MLS
- 1999-04-14 Listing Removed — Smart MLS
- 1998-10-22 Listed $54,900 Smart MLS
- 1995-07-07 Sold (MLS) $59,000 Smart MLS
- 1994-05-05 Listed $59,000 Smart MLS
- 1994-04-24 Listing Removed — Smart MLS
- 1993-06-25 Listed $79,500 Smart MLS
- 1992-11-14 Listing Removed — Smart MLS
- 1992-08-31 Listed $88,900 Smart MLS
Property tax history
+1.3%/yrLatest (2023): $5,237 · +0.0% YoY. Source: county tax records.
Cash-flow waterfall
monthlySold comps — $/sqft
last 12 mo · ≤1 miLoading sold comps…