 🏗️ New Construction
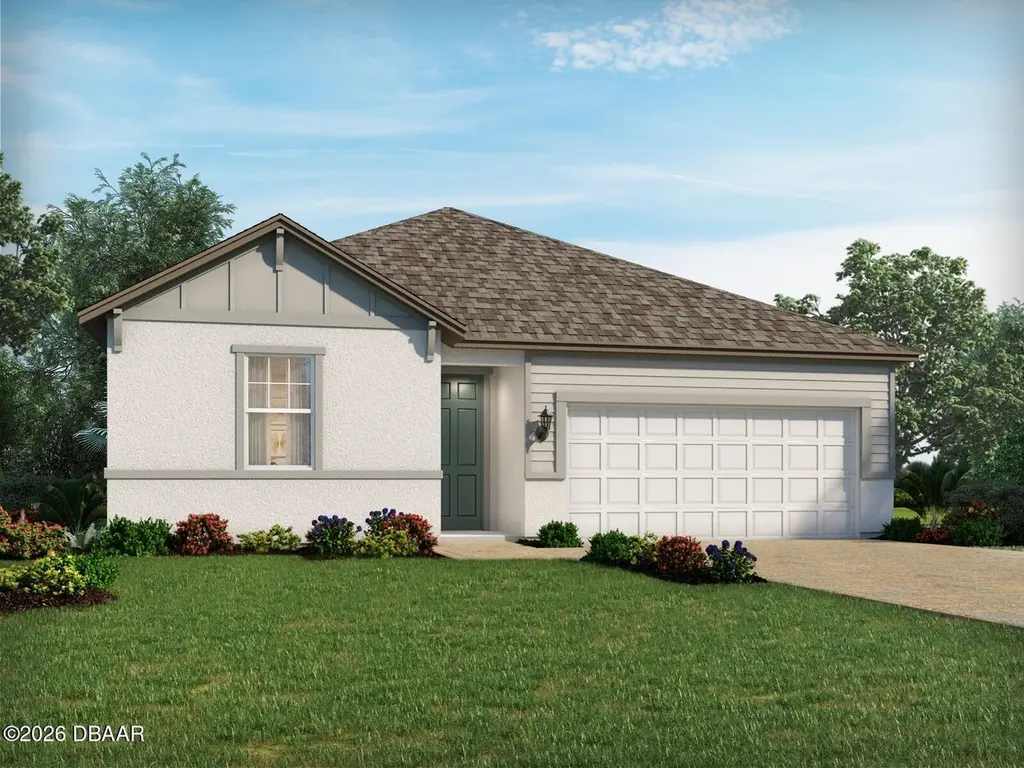
1008 British Cir · Daytona Beach, FL
Flood risk No data
- FEMA flood zone
- —
- Chance of flooding over 30 yrs
- —
- Est. flood insurance / yr
- —
Fire risk No data
- Est. fire insurance / yr
- —
Heat risk No data
- Hot days now (above threshold)
- —
- Hot days in 30 yrs
- —
Wind risk No data
- Chance of severe wind over 30 yrs
- —
Air-quality risk No data
- Unhealthy air days now
- —
- Unhealthy air days in 30 yrs
- —
Risk factors via First Street. Map © Google.
Why this score? — see what drove the D grade
The composite is a weighted blend of 9 inputs, each scored 0–100. Each bar is that input's sub-score; the figure is the points it added to the 100-point composite (weight × sub-score).
- Cash flow +12.2/30.0
- ARV discount +7.5/15.0
- Livability +4.2/5.0
- Appreciation +4.0/10.0
- Rent growth +3.9/5.0
- Schools +3.9/10.0
- DSCR +3.6/10.0
- 1% rule +2.6/10.0
- Condition / age +2.5/5.0
$394,060
🖨 Deal sheet 📄 Offer letter ✓ Due diligence
Listing remarks
Brand new, energy-efficient home available by Jun 2026! Are you ready to buy a home? The Corsica floorplan in Daytona Beach, FL offers an open-concept floorplan with 4 bedrooms, 2 bathrooms and a 2-car garage. Enjoy the chef-inspired kitchen that overlooks the great room. Entertain on the covered lanai. Now selling, Legends Preserve offers new single-family homes in Daytona Beach, FL. This beautifully serene community is just 12 miles from Daytona's stunning beaches. Located on International Golf Drive alongside the world-famous LPGA golf course, residents will have easy access to both I-4 and I-95, as well as Daytona International Airport. Nearby attractions include Daytona International S
Key facts
- 8,263 sq ft lot
- 2 garage spots
Property features AI
Finance
- HOA & community: Homeowners association with $85 monthly fee
Exterior
- Parking: 2-car garage
- Utilities: Public water; Public sewer (sewer connected)
- Home design: Single-family residence; Residential property; New construction
- Construction: Concrete and frame construction; Block foundation
- Exterior features: Shingle roof; Paved road access; Has a view
Interior
- Kitchen: Microwave; Electric range; Disposal; Dishwasher
- Bedrooms: 2 total rooms
- Flooring: Carpet; Tile
- Bathrooms: 2 full bathrooms
- Heating & cooling: Central heating; Central air conditioning
- Interior features: Microwave; Electric range; Disposal; Dishwasher
Neighborhood map
What this means for you Summary
Snapshot
- This is a 4-bed/2.0-bath land listed at $394k.
Deal economics
- At list price, monthly cash flow is $-78 ($-931/yr) — negative.
- To cash-flow at today's rent, offer at most $380k (3.5% below list).
- To meet the 1% rule (rent ≥ 1% of price), the offer needs to be $301k (23.6% below list).
- Recommended offer: $301k (23.6% below list) — sets the bar for 1% rule.
Location & tenants
- Location reads 83/100 on livability (#46 in FL, #867 nationally) — a professional / high-income tenant draw. Strengths: amenities A+, commute A+, cost of living A+; Watch: schools D+, employment D-.
- Volusia (suburban): math 44% / reading 49% proficiency, ranked #47 of 73 in FL (top 64%) — families likely to look elsewhere, expect single-tenant / working-renter base with shorter leases.
- Market conditions: Rents rising fast (+5.5%/yr); 333 active listings in the ZIP; 17 comparable units currently listed for rent nearby; rentals at typical pace (median 21d on market — plan ~3-4 weeks tenant-placement turnaround); solid renter incomes; 3,402 units permitted in Volusia County in 2024 (681 in 5+ unit buildings).
- This rent runs 39% of the median local income ($93k/yr) — at the standard rent-burdened threshold; future hikes will face affordability resistance.
Forward outlook
- Local home prices are declining (-2.0%/yr); year-one equity from $3k of loan paydown is wiped out by about $8k of value loss. Plan a longer hold.
- Volusia County population projected at +19% by 2050 — long-run rental-demand tailwind backs the buy-and-hold thesis.
Negotiation context
- Only 1 days on market — expect competitive offers; lowballing is unlikely to land.
Questions for the listing agent
- What do current leases actually rent for vs. the listed asking? Can we see a recent rent roll and the last 12 months of T-12 income?
- What does the HOA fee cover, when was the last increase, and are there any pending special assessments or reserve-fund shortfalls?
- Is there a deadline driving the sale (1031 exchange, divorce, estate, relocation)? That informs how much negotiation room exists.
- Schools are D-rated, which usually means shorter tenancies and higher turnover. Who's the typical renter profile here, and what's been the actual vacancy rate?
- The area grade is low — what's the realistic commute time and amenity access for the typical tenant pool here? Any planned neighborhood developments (good or bad) we should know about?
- What's the average days-on-market for RENTAL listings here right now (not sales)? A rising rental-DOM trend means longer vacancies and softer asking-rent achievability than the comps imply.
- What's the recent tenant-quality profile in this submarket — average credit score on applications, eviction rate, late-payment / NSF rate, and stable-employment percentage? A property-management company in the area should have these aggregated.
- How much new for-sale + rental construction is in the pipeline within 1–3 miles? Heavy new supply typically softens prices + rents 12–24 months out; constrained supply supports both.
Investment metrics
- 1% rule
- 0.76% ✗
- Cap rate
- 6.06%
- Cash-on-cash
- -0.84%
- DSCR
- 0.96
- GRM
- 10.9
CMA / ARV
No comps found within radius.
Projected returns pro-forma
-1.99% appreciation · 5.46% rent growth · sell at horizon
- IRR
- -9.9%
- Equity multiple
- 0.60×
- Total profit
- $-44,385
- Equity at exit
- $76,729
- IRR
- 0.3%
- Equity multiple
- 1.02×
- Total profit
- $2,523
- Equity at exit
- $65,760
Cash invested: $110,337 (down + closing). Projections, not guarantees.
Landlord ↔ Tenant lean methodology
- Overall (STATE)
- 87 Strongly Landlord-Friendly
- State Florida
- 87 Strongly Landlord-Friendly · R+3
- County
- — inherits STATE
- City
- — inherits STATE
ZIP-level market 32124
- Home prices YoY
- -0.6%
- Rents YoY
- 5.5%
- Active inventory
- 333
- Price-to-rent
- 10.9×
Monthly cashflow live
- Estimated rent
- $3,010 high interval (Pro) →
- Mortgage (P&I)
- −$2,066
- Tax from tax record
- −$140 /mo · $1,677/yr
- Insurance
- −$164
- HOA
- −$85
- Vacancy / Maint / Mgmt
- −$632
- Net cashflow
- $-78
Break-even live
UW: 25.0% down · 7.5% · 30yr · 1.5% tax · 5.0% vac · 8.0% maint · 8.0% mgmt
Financing live
Cash to close
- Down payment
- $98,515
- Closing costs
- $11,822
- Reserves months
- —
- Total cash needed
- —
Loan-product check · same deal, 3 products live
Conventional
25% down · 7.5% · 30yr
- Down + closing
- —
- Monthly P&I
- —
- Monthly cashflow
- —
- DSCR
- —
- Eligible?
- —
Personal DTI + credit; lowest rate.
DSCR
20% down · 8.5% · 30yr
- Down + closing
- —
- Monthly P&I
- —
- Monthly cashflow
- —
- DSCR
- —
- Eligible?
- —
No personal income docs; deal must DSCR.
Hard money
10% down · 12.0% · 12mo
- Down + closing
- —
- Monthly P&I
- —
- Monthly cashflow
- —
- DSCR
- —
- Eligible?
- —
Short-term bridge; refi at stabilization.
Rent comps 17 comps
| Address | Beds | Baths | Sqft | Rent | $/sqft | DOM | Units | Dist |
|---|---|---|---|---|---|---|---|---|
| 1203 Cabot Cliffs Dr Daytona Beach, FL | 5.0 | 2.5 | 2355 | $2,750 | $1.17 | 21d | 1 | 0.74mi |
| 1143 Cabot Cliffs Dr Daytona Beach, FL | 5.0 | 2.5 | 2370 | $3,050 | $1.29 | 11d | 1 | 0.86mi |
| 1122 Cabot Cliffs Dr Daytona Beach, FL | 3.0 | 2.0 | 1432 | $3,200 | $2.23 | 14d | 1 | 0.90mi |
| 284 Links Terrace Blvd Daytona Beach, FL | 4.0 | 2.5 | 2200 | $2,850 | $1.30 | 23d | 1 | 1.05mi |
| 136 Links Terrace Blvd Daytona Beach, FL | 3.0 | 2.0 | 1483 | $2,500 | $1.69 | 19d | 1 | 1.07mi |
| 1153 Sand Trap Ct Daytona Beach, FL | 4.0 | 2.0 | 1936 | $2,395 | $1.24 | 21d | 1 | 1.10mi |
| 1100 Sand Trap Ct Daytona Beach, FL | 4.0 | 2.0 | 1935 | $2,600 | $1.34 | 23d | 1 | 1.14mi |
| 137 Lost Ball Dr Daytona Beach, FL | 4.0 | 2.5 | 2168 | $2,950 | $1.36 | 11d | 1 | 1.14mi |
| 1142 Pacific Dunes Ct Daytona Beach, FL | 4.0 | 3.0 | 2010 | $2,599 | $1.29 | 23d | 1 | 1.15mi |
| 132 Lost Ball Dr Daytona Beach, FL | 3.0 | 2.0 | 1484 | $2,300 | $1.55 | 23d | 1 | 1.16mi |
| 1250 Champions Dr Daytona Beach, FL | 3.0 | 2.0 | 2004 | $2,650 | $1.32 | 23d | 1 | 1.22mi |
| 1139 Belle Isle Ln Daytona Beach, FL | 3.0 | 2.0 | 1429 | $2,195 | $1.54 | 14d | 1 | 1.22mi |
| 1098 Pacific Dunes Ct Daytona Beach, FL | 4.0 | 2.5 | 2576 | $3,000 | $1.16 | 23d | 1 | 1.25mi |
| 2220 Green Valley St Daytona Beach, FL | 3.0 | 2.0 | 1540 | $2,300 | $1.49 | 23d | 1 | 1.37mi |
| 1231 Belle Isle Ln Daytona Beach, FL | 5.0 | 2.5 | 2112 | $2,650 | $1.25 | 23d | 1 | 1.37mi |
| 604 Champion Ridge Dr Daytona Beach, FL | 3.0 | 2.0 | 1761 | $2,299 | $1.31 | 14d | 1 | 1.41mi |
| 5135 Magnolia Palm Dr Daytona Beach, FL | 3.0 | 2.0 | 1487 | $2,250 | $1.51 | 11d | 1 | 1.45mi |
HOA detail
- Monthly dues
- $85 · $1,020/yr
Listing history 2 events
-
2026-05-11status Pending
-
2026-05-11$394,060 Active
ⓘ Source: listings_history table (triggers on properties + properties_extension) + one-shot
backfill from property_details.listing_events for pre-trigger history.
Tax reassessment forecast FL · Resets to sale price
- Current annual tax
- $1,677 · $140/mo
- Projected year-2 tax
- $3,271 · $273/mo
- Expected delta
- +$1,594/yr (+$133/mo · 95.1%)
ⓘ Screening estimate from a state-policy table — verify with the county assessor before closing.
Nearby sold comps map
Loading sold comps map…
Walkable amenities ~0.75 mi
Loading nearby amenities…
Taxation est. · year 1
- Rental income
- $36,120
- − Mortgage interest
- −$22,073
- − Property taxes
- −$1,677
- − Insurance
- −$1,970
- − Repairs & maintenance
- −$2,890
- − Management
- −$2,890
- − HOA
- −$1,020
- − Depreciation
- −$11,464
- Taxable loss
- −$7,864
- Est. tax savings @ 24.0%
- +$1,887
- After-tax cash flow
- $957/yr
For passive investors: Depreciation is non-cash, so a rental often shows a tax loss while cash-flowing — sheltering income. Rental losses are passive: they offset passive income freely, and up to $25,000/yr can offset ordinary (W-2) income if you actively participate and your MAGI is under $100k (phasing out to $0 by $150k); unused losses carry forward. On sale, claimed depreciation is recaptured at up to 25%, and gains may owe capital-gains tax (a 1031 exchange can defer both). Figures are a year-1 estimate at your 24.0% rate — not tax advice; consult a CPA.
Schools (NCES district)
- District
- Volusia
- NCES district ID
- 1201920
- Math proficiency
- 44% ▼ -9.00%
- Reading proficiency
- 49% ▼ -3.00%
- Median HH income
- $42,946
- Composite
- 39.2/100
- National rank
- #4019
- State rank
- #47 of 73 in FL
Livability — Daytona Beach
- Score
- 83/100
- State rank
- #46
- US rank
- #867
Category grades
Schools grade is shown separately in the Schools card above.
Census & demographics
- Census place
- Daytona Beach, FL
- County
- Volusia County · 556,871 people
- City population
- 67,539
- Metro
- Deltona-Daytona Beach-Ormond Beach, FL
- Population (ZIP)
- 11,409
- Household income
- $92,616
- Rent vs Own
- Severe rent burden
- 54.0
Population outlook (Volusia County) Hauer SSP2
- Today (2025)
- 572,749 people
- By 2030
- 598,695 · +4.5%
- By 2040
- 644,880 · +12.6%
- By 2050
- 681,451 · +19.0%
- By 2075
- 759,957 · +32.7%
- By 2100
- 778,902 · +36.0%
Race, ethnicity, and origin ACS 2023
- Neighborhood character
- Predominantly White (71%)
- Race & ethnicity
- White 71% Black 20% Hispanic / Latino 5% Asian 2% Two or more races 1%
- Common ancestry
- Romanian 3% Italian 2% Portuguese 1%
- Foreign-born
- 10% · Canada, Mexico, South Korea
- Languages at home
- 91% English-only · Spanish 4% Other Asian/Pacific 1% Other Indo-European 1%
Political lean MEDSL · Volusia
- 2024 margin
- Strong R (+21.8) · D 38.7% · R 60.5%
- 2008→2024 swing
- -27.4pp toward R · 2008: 5.7pp · 2024: -21.8pp
- All cycles
- 2024: R+21.8 2020: R+14.1 2016: R+13.1 2012: R+1.2 2008: D+5.7
Not yet ingested
- Civics
- —
Market trends
- HPI YoY
- ▼ -1.99%
- Current HPI
- 311.7456
- Rent YoY
- ▲ 5.46%
- Metro
- Deltona-Daytona Beach-Ormond Beach, FL
- State GDP YoY
- ▲ 3.28%
- F500 in state
- 36
Industry mix (Fortune 500 HQ in FL)
| Industry | F500 HQs | Revenue |
|---|---|---|
| Industrial Technology | 2 | $29B |
|
||
| Insurance | 2 | $17B |
|
||
| Retail | 1 | $60B |
|
||
| Technology Distribution | 1 | $58B |
|
||
| Homebuilding | 1 | $35B |
|
||
| Technology Manufacturing | 1 | $35B |
|
||
Price history
2 events — show timeline
- 2026-05-11 Pending — Daytona MLS
- 2026-05-11 Listed $394,060 Daytona MLS
Property tax history
+36.7%/yrLatest (2025): $1,677 · +15.5% YoY. Source: county tax records.
Cash-flow waterfall
monthlySold comps — $/sqft
last 12 mo · ≤1 miLoading sold comps…