233 Kingsley Dr · Blythewood, SC
Flood risk No data
- FEMA flood zone
- —
- Chance of flooding over 30 yrs
- —
- Est. flood insurance / yr
- —
Fire risk No data
- Est. fire insurance / yr
- —
Heat risk No data
- Hot days now (above threshold)
- —
- Hot days in 30 yrs
- —
Wind risk No data
- Chance of severe wind over 30 yrs
- —
Air-quality risk No data
- Unhealthy air days now
- —
- Unhealthy air days in 30 yrs
- —
Risk factors via First Street. Map © Google.
Why this score? — see what drove the D grade
The composite is a weighted blend of 9 inputs, each scored 0–100. Each bar is that input's sub-score; the figure is the points it added to the 100-point composite (weight × sub-score).
- Cash flow +11.4/30.0
- ARV discount +11.2/15.0
- Condition / age +4.0/5.0
- Schools +3.6/10.0
- 1% rule +3.5/10.0
- Livability +3.5/5.0
- DSCR +3.3/10.0
- Rent growth +2.5/5.0
- Appreciation +0.0/10.0
$320,000
🖨 Deal sheet 📄 Offer letter ✓ Due diligence
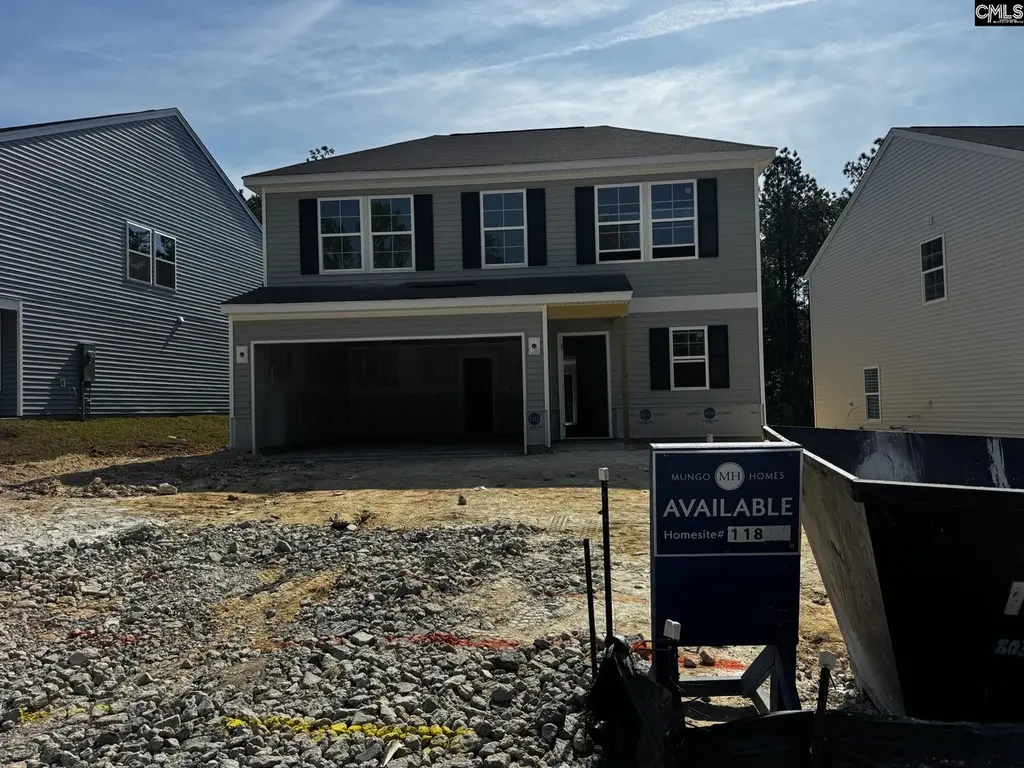
Listing remarks
The Rutherford offers the perfect balance of comfort and flexibility with two primary suites—one on the main floor and the second upstairs. This charming home features stone at the water table and backs up to protected space. As you enter, the open layout begins with a bright eat-in area that flows seamlessly into the kitchen and spacious family room. The first-floor primary suite includes a dual-sink vanity, walk-in shower, and a generous walk-in closet, with the laundry room conveniently located nearby. The kitchen features a bar countertop and two pantries for added storage. Upstairs, you’ll find the second primary suite with a garden tub, spacious closet, linen closet, and w
Key facts
- Eat-in area
- Bar countertop
- Open layout
Tags
Property features AI
Finance
- HOA & community: Homeowners association with common area maintenance; Community pool; Community playground; Sidewalks in the community; New construction builder warranty
Exterior
- Parking: Attached garage with 2 garage spaces
- Utilities: Public water; Public sewer
- Home design: Two-story home; Slab foundation
- Construction: Vinyl exterior; Slab foundation
- Exterior features: Covered front porch; Patio; Sprinkler system; Vinyl exterior finish; Paved road access
Interior
- Kitchen: Eat-in kitchen with island; Pantry; Quartz countertops; Backsplash; Dishwasher; Microwave (above stove)
- Bedrooms: Main-level master suite with double vanity, private bath, separate shower, separate water closet, and walk-in closet; Second-level bedroom with walk-in closet; Second-level bedroom with double vanity, shared bath, and walk-in closet; Second-level bedroom with double vanity, shared bath, and walk-in closet
- Flooring: Luxury vinyl plank flooring in the kitchen
- Bathrooms: Three full bathrooms; One partial bathroom; One main-level full bath; One main-level half bath
- Heating & cooling: Central air conditioning with zoned control; Gas heating on the first level with zoned control
- Interior features: Loft on the second level; Tankless hot water; Gas water heater; Self-cleaning free-standing range
- Laundry & utility: Washer and dryer hookups on the main level
Neighborhood map
What this means for you Summary
Snapshot
- This is a 4-bed/3.5-bath single-family listed at $320k. Condition is rated good.
Deal economics
- At list price, monthly cash flow is $-111 ($-1k/yr) — negative.
- To cash-flow at today's rent, offer at most $304k (5.0% below list).
- To meet the 1% rule (rent ≥ 1% of price), the offer needs to be $272k (15.0% below list).
- Recommended offer: $272k (15.0% below list) — sets the bar for 1% rule.
Location & tenants
- Location reads 70/100 on livability (#58 in SC) — a middle-class / working-renter tenant base. Strengths: crime A+, employment A+, housing A+; Watch: amenities F, commute F, health & safety F.
- Richland 02 (suburban): math 35% / reading 47% proficiency, ranked #29 of 80 in SC (top 36%) — families likely to look elsewhere, expect single-tenant / working-renter base with shorter leases.
- Zoned schools: Langford Elementary (math 39% / reading 43%, grade F, #276 of 597 statewide, top 48%, 609 students, 64% FRL); Westwood High (math 47% / reading 87%, grade B, #73 of 196 statewide, top 41%, 1,684 students, 66% FRL) — zoned schools average 65% FRL vs 38% district-wide (26 pts higher); higher-poverty schools than district average — tighter screening recommended.
- Zoned-school proficiency averages 54% at this address vs 41% district-wide (+13 pts) — the actual schools serving this property are materially stronger than the Richland 02 average implies; a family-tenant draw the district grade alone would hide.
- Market conditions: 650 active listings in the ZIP; 4 comparable units currently listed for rent nearby; rentals leasing fast (median 3d on market — plan ~1-2 weeks tenant-placement turnaround); solid renter incomes; 3,472 units permitted in Richland County in 2024 (1,096 in 5+ unit buildings).
- This rent runs 34% of the median local income ($95k/yr) — at the standard rent-burdened threshold; future hikes will face affordability resistance.
Forward outlook
- Local home prices are declining (-3.0%/yr); year-one equity from $2k of loan paydown is wiped out by about $10k of value loss. Plan a longer hold.
- Richland County population projected at +30% by 2050 — long-run rental-demand tailwind backs the buy-and-hold thesis.
Negotiation context
- It's been on market 26 days — a 2% lower offer ($315k) is reasonable based on typical stale-listing flexibility.
Questions for the listing agent
- What do current leases actually rent for vs. the listed asking? Can we see a recent rent roll and the last 12 months of T-12 income?
- What does the HOA fee cover, when was the last increase, and are there any pending special assessments or reserve-fund shortfalls?
- Is there a deadline driving the sale (1031 exchange, divorce, estate, relocation)? That informs how much negotiation room exists.
- Schools are B-rated — typically a magnet for longer-tenancy family renters. What's the average tenant stay here, and is there a school-zone premium baked into asking?
- The area grade is low — what's the realistic commute time and amenity access for the typical tenant pool here? Any planned neighborhood developments (good or bad) we should know about?
- What's the average days-on-market for RENTAL listings here right now (not sales)? A rising rental-DOM trend means longer vacancies and softer asking-rent achievability than the comps imply.
- What's the recent tenant-quality profile in this submarket — average credit score on applications, eviction rate, late-payment / NSF rate, and stable-employment percentage? A property-management company in the area should have these aggregated.
- How much new for-sale + rental construction is in the pipeline within 1–3 miles? Heavy new supply typically softens prices + rents 12–24 months out; constrained supply supports both.
Investment metrics
- 1% rule
- 0.85% ✗
- Cap rate
- 5.88%
- Cash-on-cash
- -1.48%
- DSCR
- 0.93
- GRM
- 9.8
CMA / ARV
- ARV (on-the-fly)
- $348,593
- Comps found
- 1
Show comp detail 1 sale within ~0.75 mi
| Address | Dist | Beds/Ba | Sqft | Sold | Price | $/sf | Match |
|---|---|---|---|---|---|---|---|
| 1029 Heart Pine Dr | 0.67mi | 5/3.0 (+1) | 2,720 (+4%) | 14mo | $362,900 | $133 | 44 |
Match score weights: distance 35% · size 25% · config 20% · recency 20%. Top-matched comps best support the ARV.
Projected returns pro-forma
-3.0% appreciation · 3.0% rent growth · sell at horizon
- IRR
- -18.7%
- Equity multiple
- 0.34×
- Total profit
- $-58,825
- Equity at exit
- $47,713
- IRR
- -11.1%
- Equity multiple
- 0.33×
- Total profit
- $-60,004
- Equity at exit
- $27,668
Cash invested: $89,600 (down + closing). Projections, not guarantees.
Landlord ↔ Tenant lean methodology
- Overall (STATE)
- 90 Strongly Landlord-Friendly
- State South Carolina
- 90 Strongly Landlord-Friendly · R+6
- County
- — inherits STATE
- City
- — inherits STATE
ZIP-level market 29016
- Home prices YoY
- -26.3%
- Active inventory
- 650
- Price-to-rent
- 9.8×
Monthly cashflow live
- Estimated rent
- $2,720 medium interval (Pro) →
- Mortgage (P&I)
- −$1,678
- Tax est. 1.5%
- −$400 /mo · $4,800/yr
- Insurance
- −$133
- HOA
- −$48
- Vacancy / Maint / Mgmt
- −$571
- Net cashflow
- $-111
Break-even live
UW: 25.0% down · 7.5% · 30yr · 1.5% tax · 5.0% vac · 8.0% maint · 8.0% mgmt
Financing live
Cash to close
- Down payment
- $80,000
- Closing costs
- $9,600
- Reserves months
- —
- Total cash needed
- —
Loan-product check · same deal, 3 products live
Conventional
25% down · 7.5% · 30yr
- Down + closing
- —
- Monthly P&I
- —
- Monthly cashflow
- —
- DSCR
- —
- Eligible?
- —
Personal DTI + credit; lowest rate.
DSCR
20% down · 8.5% · 30yr
- Down + closing
- —
- Monthly P&I
- —
- Monthly cashflow
- —
- DSCR
- —
- Eligible?
- —
No personal income docs; deal must DSCR.
Hard money
10% down · 12.0% · 12mo
- Down + closing
- —
- Monthly P&I
- —
- Monthly cashflow
- —
- DSCR
- —
- Eligible?
- —
Short-term bridge; refi at stabilization.
Rent comps 4 comps
| Address | Beds | Baths | Sqft | Rent | $/sqft | DOM | Units | Dist |
|---|---|---|---|---|---|---|---|---|
| 562 Vintage Pine Dr Blythewood, SC | 3.0 | 2.0 | 1814 | $2,195 | $1.21 | 23d | 1 | 0.75mi |
| 830 Wing Stripe Ct Columbia, SC | 5.0 | 3.5 | 3044 | $2,395 | $0.79 | 3d | 1 | 1.02mi |
| 1800 Killian Lakes Dr Columbia, SC | 1.0–3.0 | 1.0–2.5 | 1401 | $2,657 | $1.90 | 2d | 47 | 1.28mi |
| 621 Heron Glen Dr Columbia, SC | 4.0 | 2.5 | 2195 | $2,095 | $0.95 | 3d | 1 | 1.43mi |
HOA detail
- Monthly dues
- $48 · $576/yr
- Likely covers
- water
Listing history 4 events
-
2026-05-18status Pending
-
2026-05-08price $320,000
-
2026-05-02price $321,019
-
2026-04-22$315,019 Active
ⓘ Source: listings_history table (triggers on properties + properties_extension) + one-shot
backfill from property_details.listing_events for pre-trigger history.
Nearby sold comps map
Loading sold comps map…
Walkable amenities ~0.75 mi
Loading nearby amenities…
Taxation est. · year 1
- Rental income
- $32,641
- − Mortgage interest
- −$17,925
- − Property taxes
- −$4,800
- − Insurance
- −$1,600
- − Repairs & maintenance
- −$2,611
- − Management
- −$2,611
- − HOA
- −$576
- − Depreciation
- −$9,309
- Taxable loss
- −$6,791
- Est. tax savings @ 24.0%
- +$1,630
- After-tax cash flow
- $303/yr
For passive investors: Depreciation is non-cash, so a rental often shows a tax loss while cash-flowing — sheltering income. Rental losses are passive: they offset passive income freely, and up to $25,000/yr can offset ordinary (W-2) income if you actively participate and your MAGI is under $100k (phasing out to $0 by $150k); unused losses carry forward. On sale, claimed depreciation is recaptured at up to 25%, and gains may owe capital-gains tax (a 1031 exchange can defer both). Figures are a year-1 estimate at your 24.0% rate — not tax advice; consult a CPA.
Condition & rehab AI · 12 photos
This home is in excellent condition with no visible repairs needed. It offers a good balance of comfort and flexibility, making it an attractive option for both buyers and renters.
Value-add opportunities
- Resale Paint interior walls — Fresh paint can enhance curb appeal and interior aesthetics
- Resale Install new flooring in bathrooms — New flooring can improve the look and feel of the bathrooms
- Resale Add decorative lighting fixtures — Enhances the home's curb appeal and interior ambiance
- Rental Install smart home devices — Attracts tech-savvy renters and can be a selling point for buyers
- Both Add outdoor lighting — Enhances curb appeal and safety
Renovation cost estimate screening
Value-add ROI direction
- Resale Paint interior walls — Fresh paint can enhance curb appeal and interior aesthetics ↑
- Resale Install new flooring in bathrooms — New flooring can improve the look and feel of the bathrooms ↑
- Resale Add decorative lighting fixtures — Enhances the home's curb appeal and interior ambiance ↑
- Rental Install smart home devices — Attracts tech-savvy renters and can be a selling point for buyers ↑
- Both Add outdoor lighting — Enhances curb appeal and safety ↑
ⓘ Cost ranges are severity-bucket heuristics (US national rule-of-thumb). Get contractor quotes + a written scope before underwriting a rehab budget.
Schools (NCES district)
- District
- Richland 02
- NCES district ID
- 4503390
- Math proficiency
- 35% ▼ -15.00%
- Reading proficiency
- 47% ▼ -5.00%
- Median HH income
- $59,684
- Composite
- 36.2/100
- National rank
- #4730
- State rank
- #29 of 80 in SC
Livability — Blythewood
- Score
- 70/100
- State rank
- #58
- US rank
- #7406
Category grades
Schools grade is shown separately in the Schools card above.
Census & demographics
- County
- Richland County · 389,530 people
- City population
- 30,454
- Metro
- Columbia, SC
- Population (ZIP)
- 30,454
- Household income
- $95,082
- Rent vs Own
- Severe rent burden
- 559.0
Population outlook (Richland County) Hauer SSP2
- Today (2025)
- 459,667 people
- By 2030
- 487,524 · +6.1%
- By 2040
- 542,035 · +17.9%
- By 2050
- 595,371 · +29.5%
- By 2075
- 732,998 · +59.5%
- By 2100
- 820,415 · +78.5%
Race, ethnicity, and origin ACS 2023
- Neighborhood character
- Diverse neighborhood (Simpson 0.64)
- Race & ethnicity
- Black 43% White 42% Two or more races 7% Hispanic / Latino 7% Asian 3%
- Hispanic origin (detail)
- Mexican 1% Puerto Rican 2%
- Common ancestry
- Lithuanian 2% Romanian 2% Slovak 2%
- Foreign-born
- 5% · Canada, China
- Languages at home
- 90% English-only · Spanish 5% Other Indo-European 1% German/W. Germanic 1%
Political lean MEDSL · Richland
- 2024 margin
- Solid D (+34.6) · D 66.4% · R 31.8% · Other 1.8%
- 2008→2024 swing
- +5.7pp toward D · 2008: 28.9pp · 2024: 34.6pp
- All cycles
- 2024: D+34.6 2020: D+38.3 2016: D+32.9 2012: D+33.3 2008: D+28.9
Not yet ingested
- Civics
- —
Market trends
- HPI YoY
- ▼ -65.48%
- Current HPI
- 183.5933
- Rent YoY
- —
- Metro
- Columbia, SC
- State GDP YoY
- ▲ 4.51%
- F500 in state
- 2
Industry mix (Fortune 500 HQ in SC)
| Industry | F500 HQs | Revenue |
|---|---|---|
| Packaging | 1 | $7B |
|
||
Price history
+1.6% since first listed4 events — show timeline
- 2026-05-18 Pending — Consolidated MLS
- 2026-05-08 Price Changed $320,000 Consolidated MLS
- 2026-05-02 Price Changed $321,019 Consolidated MLS
- 2026-04-22 Listed $315,019 Consolidated MLS
Cash-flow waterfall
monthlySold comps — $/sqft
last 12 mo · ≤1 miLoading sold comps…