 🏷️ Likely Rental
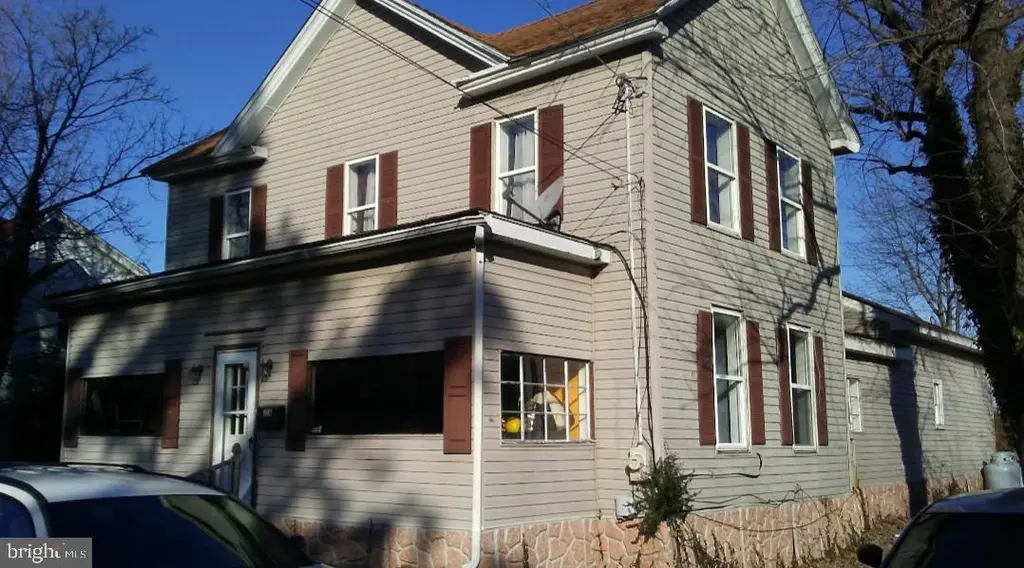
326 Pine St · Crisfield, MD
Flood risk 10/10 · Severe
- FEMA flood zone
- AE
- Chance of flooding over 30 yrs
- 0.99%
- Est. flood insurance / yr
- $1,737 – $8,500
Fire risk 5/10 · Moderate
- Est. fire insurance / yr
- $755 – $1,403
Heat risk 10/10 · Severe
- Hot days now (above 102°F)
- 7 days/yr
- Hot days in 30 yrs
- 20 days/yr
Wind risk 8/10 · Major
- Chance of severe wind over 30 yrs
- 80.0%
Air-quality risk 2/10 · Minimal
- Unhealthy air days now
- 2 days/yr
- Unhealthy air days in 30 yrs
- 2 days/yr
Risk factors via First Street. Map © Google.
Why this score? — see what drove the B+ grade
The composite is a weighted blend of 9 inputs, each scored 0–100. Each bar is that input's sub-score; the figure is the points it added to the 100-point composite (weight × sub-score).
- Cash flow +30.0/30.0
- 1% rule +10.0/10.0
- DSCR +10.0/10.0
- Appreciation +10.0/10.0
- ARV discount +7.5/15.0
- Livability +3.4/5.0
- Rent growth +2.5/5.0
- Condition / age +2.5/5.0
- Schools +1.5/10.0
$90,000
🖨 Deal sheet (PDF) 📄 Offer letter ✓ Due diligence
Listing remarks MLS
Large home in the town of Crisfield 6 bedrooms 2 full baths 2600 Sq. Ft possibly can be converted into a duplex currently rented for $1,300 per month behind Dollar General Showings will begin 6-6-24
Key facts
- 0.28 acre lot
- Built 1900
- Listed 292 days
Neighborhood map
What this means for you Summary
Snapshot
- This is a 6-bed/2.0-bath single-family listed at $90k.
Deal economics
- At list price, monthly cash flow is $56 ($674/yr) — positive.
- The deal already cash-flows at list — no discount required.
- Meets the 1% rule at list price ($1k rent vs $90k).
- Recommended offer: $79k (12.0% below list) — sets the bar for market timing.
Location & tenants
- Location reads 68/100 on livability (#199 in MD) — a middle-class / working-renter tenant base. Strengths: crime A+, cost of living A+, health & safety A+; Watch: amenities F, commute F, employment F.
- Somerset County Public Schools (town): math 12% / reading 23% proficiency, ranked #22 of 24 in MD (top 92%) — low school quality limits family demand, transient renter base, plan for 1-2y turnover; 64% free/reduced lunch — lower-income household profile, screen leases tightly.
- Zoned schools: Somerset 6/7 Intermediate School (math 8% / reading 26%, grade F, #170 of 225 statewide, top 77%, 396 students, 73% FRL).
- Market conditions: 93 active listings in the ZIP; 49 units permitted in Somerset County in 2024 (0 in 5+ unit buildings).
Forward outlook
- In year one you build about $10k of equity ($622 loan paydown + $9k appreciation (10.0% local appreciation)).
- Somerset County population projected at -16% by 2050 — secular population decline; favor cash flow + early exit over multi-decade hold.
- At projected returns (10.0% appreciation + 3.0% rent growth), your $25k cash investment doubles in ~3 years — after that, you're playing with house money.
- By year 4, paydown + projected appreciation supports a ~$34k cash-out refi (75% LTV) — recoverable capital for the next deal without selling this one.
Negotiation context
- It's been on market 292 days — a 12% lower offer ($79k) is reasonable based on typical stale-listing flexibility.
- 9 sale attempts since 26y ago; this cycle's ask has dropped $30k (25%) from the opening price — seller is motivated, your offer sets the floor, not the list.
- Current owner paid $49k; list at $90k implies a 84% gain — meaningful room to come down on a strong offer.
Risks & watch-outs
- Watch-outs: flood insurance adds $427/mo; built in 1900 — expect roof / HVAC / electrical / plumbing capex.
- Climate carrying-cost: in FEMA flood zone AE (mandatory federal flood insurance); severe wind risk, 80% chance of damaging wind over 30y; moderate wildfire risk; extreme-heat days projected 7→20/yr by 2055 (HVAC capex compounding) — expect insurance premiums to compound above CPI over the hold.
Questions for the listing agent
- It's been on market 292 days. Have you received any prior offers? Is the seller open to a 12% concession, seller financing, or rate buy-down credit?
- Built in 1900 — when were the roof, HVAC, electrical panel, plumbing, and water heater last replaced?
- What's the actual annual flood-insurance premium (NFIP or private), and is the property in a SFHA with mandatory coverage?
- Why hasn't it sold? Are there any deal-killer items the seller is aware of (foundation, flood, title, zoning, code violations)?
- Is there a deadline driving the sale (1031 exchange, divorce, estate, relocation)? That informs how much negotiation room exists.
- Schools are F-rated, which usually means shorter tenancies and higher turnover. Who's the typical renter profile here, and what's been the actual vacancy rate?
- What's the average days-on-market for RENTAL listings here right now (not sales)? A rising rental-DOM trend means longer vacancies and softer asking-rent achievability than the comps imply.
- What's the recent tenant-quality profile in this submarket — average credit score on applications, eviction rate, late-payment / NSF rate, and stable-employment percentage? A property-management company in the area should have these aggregated.
- How much new for-sale + rental construction is in the pipeline within 1–3 miles? Heavy new supply typically softens prices + rents 12–24 months out; constrained supply supports both.
Investment metrics
- 1% rule
- 1.52% ✓
- Cap rate
- 12.73%
- Cash-on-cash
- 22.99%
- DSCR
- 2.02
- GRM
- 5.5
CMA / ARV
- ARV (median comp)
- $232,067
- List price
- $90,000
- Delta
- -61.22%
- Verdict
- UNDERPRICED
- Comps
- 3 within 1.0 mi
Projected returns pro-forma
10.0% appreciation · 3.0% rent growth · sell at horizon
- IRR
- 26.3%
- Equity multiple
- 3.10×
- Total profit
- $52,864
- Equity at exit
- $81,079
- IRR
- 23.2%
- Equity multiple
- 7.09×
- Total profit
- $153,399
- Equity at exit
- $174,850
Cash invested: $25,200 (down + closing). Projections, not guarantees.
Landlord ↔ Tenant lean methodology
- Overall (STATE)
- 27 Tenant-Leaning
- State Maryland
- 27 Tenant-Leaning · D+14
- County
- — inherits STATE
- City
- — inherits STATE
ZIP-level market 21817
- Home prices YoY
- 7.3%
- Active inventory
- 93
- Price-to-rent
- 5.5×
Monthly cashflow live
- Estimated rent
- $1,372 medium interval (Pro) →
- Mortgage (P&I)
- −$472
- Tax from tax record
- −$92 /mo · $1,101/yr
- Insurance
- −$38
- Flood insurance flood zone
- −$427 /mo · $5,118/yr
- HOA
- −$0
- Vacancy / Maint / Mgmt
- −$288
- Net cashflow
- $56
Break-even live
Sensitivity live
| Price | -10% $107 | -5% $82 | +0% $56 | +5% $31 | +10% $5 |
|---|---|---|---|---|---|
| Rent | -10% $-52 | -5% $2 | +0% $56 | +5% $110 | +10% $165 |
| Rate | -1.0pp $101 | -0.5pp $79 | base $56 | +0.5pp $33 | +1.0pp $9 |
UW: 25.0% down · 7.5% · 30yr · 1.5% tax · 5.0% vac · 8.0% maint · 8.0% mgmt
Financing live
Cash to close
- Down payment
- $22,500
- Closing costs
- $2,700
- Reserves months
- —
- Total cash needed
- —
Loan-product check · same deal, 3 products live
Conventional
25% down · 7.5% · 30yr
- Down + closing
- —
- Monthly P&I
- —
- Monthly cashflow
- —
- DSCR
- —
- Eligible?
- —
Personal DTI + credit; lowest rate.
DSCR
20% down · 8.5% · 30yr
- Down + closing
- —
- Monthly P&I
- —
- Monthly cashflow
- —
- DSCR
- —
- Eligible?
- —
No personal income docs; deal must DSCR.
Hard money
10% down · 12.0% · 12mo
- Down + closing
- —
- Monthly P&I
- —
- Monthly cashflow
- —
- DSCR
- —
- Eligible?
- —
Short-term bridge; refi at stabilization.
Listing history 41 events
-
2026-06-21days on market $90,000 Active 292 DOM
-
2026-06-18days on market $90,000 Active 289 DOM
-
2026-06-17days on market $90,000 Active 288 DOM
-
2026-06-16days on market $90,000 Active 287 DOM
-
2026-06-15days on market $90,000 Active 286 DOM
-
2026-06-14days on market $90,000 Active 284 DOM
-
2026-06-13days on market $90,000 Active 283 DOM
-
2026-06-10days on market $90,000 Active 281 DOM
-
2026-06-09days on market $90,000 Active 280 DOM
-
2026-06-08days on market $90,000 Active 279 DOM
-
2026-06-07days on market $90,000 Active 278 DOM
-
2026-06-02days on market $90,000 Active 273 DOM
-
2026-06-01days on market $90,000 Active 272 DOM
-
2026-05-31days on market $90,000 Active 271 DOM
-
2026-05-30days on market $90,000 Active 270 DOM
-
2025-09-05price $90,000 199-char remark
Show marketing remark (199 chars)
Large home in the town of Crisfield 6 bedrooms 2 full baths 2600 Sq. Ft possibly can be converted into a duplex currently rented for $1,300 per month behind Dollar General Showings will begin 6-6-24
-
2025-09-02$120,000 Active 199-char remark
Show marketing remark (199 chars)
Large home in the town of Crisfield 6 bedrooms 2 full baths 2600 Sq. Ft possibly can be converted into a duplex currently rented for $1,300 per month behind Dollar General Showings will begin 6-6-24
-
2025-08-12historical
-
2025-04-09price $120,000
-
2024-08-12$131,000 Active
-
2024-06-13historical
-
2024-05-13status Active
-
2024-05-08historical
-
2023-06-13$131,000 Active
-
2021-02-06historical
-
2020-01-31$150,000 Active
-
2018-11-29soldstatus $49,000
-
2017-06-09soldstatus $60,000
-
2013-09-30soldstatus $75,000
-
2010-03-03soldstatus $90,000
-
2009-04-01historical
-
2008-07-01$79,500
-
2008-06-27soldstatus $45,000
-
2008-02-18historical
-
2007-11-19$49,900
-
2001-07-25soldstatus $15,900
-
2001-07-10soldstatus $15,900
-
2001-04-20historical
-
2001-02-08$15,900
-
2000-12-02historical
-
2000-06-19$29,900
ⓘ Source: listings_history table (triggers on properties + properties_extension) + one-shot
backfill from property_details.listing_events for pre-trigger history.
Tax reassessment forecast MD · Partial reset (capped growth)
- Current annual tax
- $1,101 · $92/mo
- Projected year-2 tax
- $1,101 · $92/mo
- Expected delta
- $0/yr ($0/mo · 0.0%)
ⓘ Screening estimate from a state-policy table — verify with the county assessor before closing.
Climate risk First Street
- Flood 10/10 Extreme FEMA zone AE · 99% chance over 30 yrs
- Wildfire 5/10 Major
- Heat 10/10 Extreme 7 d/yr ≥102°F today · 20 d/yr by 30 yrs out
- Wind 8/10 Severe 80% chance of damaging wind over 30 yrs
- Air quality 2/10 Low 2 unhealthy d/yr today · 2 by 30 yrs out
Nearby sold comps map
Loading sold comps map…
Walkable amenities ~0.75 mi
Loading nearby amenities…
Taxation est. · year 1
- Rental income
- $16,465
- − Mortgage interest
- −$5,041
- − Property taxes
- −$1,101
- − Insurance
- −$5,568
- − Repairs & maintenance
- −$1,317
- − Management
- −$1,317
- − Depreciation
- −$2,618
- Taxable loss
- −$499
- Est. tax savings @ 24.0%
- +$120
- After-tax cash flow
- $794/yr
For passive investors: Depreciation is non-cash, so a rental often shows a tax loss while cash-flowing — sheltering income. Rental losses are passive: they offset passive income freely, and up to $25,000/yr can offset ordinary (W-2) income if you actively participate and your MAGI is under $100k (phasing out to $0 by $150k); unused losses carry forward. On sale, claimed depreciation is recaptured at up to 25%, and gains may owe capital-gains tax (a 1031 exchange can defer both). Figures are a year-1 estimate at your 24.0% rate — not tax advice; consult a CPA.
Schools (NCES district)
- District
- Somerset County Public Schools
- NCES district ID
- 2400570
- Math proficiency
- 12% ▼ -7.00%
- Reading proficiency
- 23% ▼ -14.00%
- Median HH income
- $38,810
- Composite
- 14.73/100
- National rank
- #9396
- State rank
- #22 of 24 in MD
Livability — Crisfield
- Score
- 68/100
- State rank
- #199
- US rank
- #9181
Category grades
Schools grade is shown separately in the Schools card above.
Census & demographics
- Census place
- Crisfield, MD
- Population (ZIP)
- 4,102
Population outlook (Somerset County) Hauer SSP2
- Today (2025)
- 24,474 people
- By 2030
- 23,547 · -3.8%
- By 2040
- 21,498 · -12.2%
- By 2050
- 20,427 · -16.5%
- By 2075
- 16,594 · -32.2%
- By 2100
- 12,132 · -50.4%
Race, ethnicity, and origin ACS 2023
- Neighborhood character
- Predominantly White (72%)
- Race & ethnicity
- White 72% Black 20% Two or more races 4% Hispanic / Latino 3% Asian 1%
- Common ancestry
- Italian 2% Serbian 1% Romanian 1%
- Foreign-born
- 2% · Canada
- Languages at home
- 97% English-only · Spanish 2%
Political lean MEDSL · Somerset
- 2024 margin
- R (+17.4) · D 40.2% · R 57.5% · Other 2.3%
- 2008→2024 swing
- -14.8pp toward R · 2008: -2.6pp · 2024: -17.4pp
- All cycles
- 2024: R+17.4 2020: R+14.8 2016: R+17.9 2012: R+2.5 2008: R+2.6
Not yet ingested
- Civics
- —
Market trends
- HPI YoY
- ▲ 19.92%
- Current HPI
- 292.866
- Rent YoY
- —
- Metro
- —
- State GDP YoY
- ▲ 2.97%
- F500 in state
- 12
Industry mix (Fortune 500 HQ in MD)
| Industry | F500 HQs | Revenue |
|---|---|---|
| Aerospace / Defense | 1 | $71B |
|
||
| Utilities | 1 | $25B |
|
||
| Hotels | 1 | $24B |
|
||
| Consumer Goods | 1 | $7B |
|
||
| Real Estate | 1 | $6B |
|
||
| Chemicals | 1 | $2B |
|
||
Price history
+201.0% since first listed26 events — show timeline
- 2025-09-05 Price Changed $90,000 BRIGHT MLS
- 2025-09-02 Listed $120,000 BRIGHT MLS
- 2025-08-12 Listing Removed — BRIGHT MLS
- 2025-04-09 Price Changed $120,000 BRIGHT MLS
- 2024-08-12 Listed $131,000 BRIGHT MLS
- 2024-06-13 Listing Removed — BRIGHT MLS
- 2024-05-13 Relisted — BRIGHT MLS
- 2024-05-08 Listing Removed — BRIGHT MLS
- 2023-06-13 Listed $131,000 BRIGHT MLS
- 2021-02-06 Listing Removed — BRIGHT MLS
- 2020-01-31 Listed $150,000 BRIGHT MLS
- 2018-11-29 Sold (Public Records) $49,000 Public Records
- 2017-06-09 Sold (Public Records) $60,000 Public Records
- 2013-09-30 Sold (Public Records) $75,000 Public Records
- 2010-03-03 Sold (Public Records) $90,000 Public Records
- 2009-04-01 Listing Removed — BRIGHT MLS
- 2008-07-01 Listed $79,500 BRIGHT MLS
- 2008-06-27 Sold (MLS) $45,000 BRIGHT MLS
- 2008-02-18 Listing Removed — BRIGHT MLS
- 2007-11-19 Listed $49,900 BRIGHT MLS
- 2001-07-25 Sold (Public Records) $15,900 Public Records
- 2001-07-10 Sold (MLS) $15,900 BRIGHT MLS
- 2001-04-20 Listing Removed — BRIGHT MLS
- 2001-02-08 Listed $15,900 BRIGHT MLS
- 2000-12-02 Listing Removed — BRIGHT MLS
- 2000-06-19 Listed $29,900 BRIGHT MLS
Property tax history
+0.3%/yrLatest (2025): $1,101 · +11.5% YoY. Source: county tax records.
Cash-flow waterfall
monthlySold comps — $/sqft
last 12 mo · ≤1 miLoading sold comps…