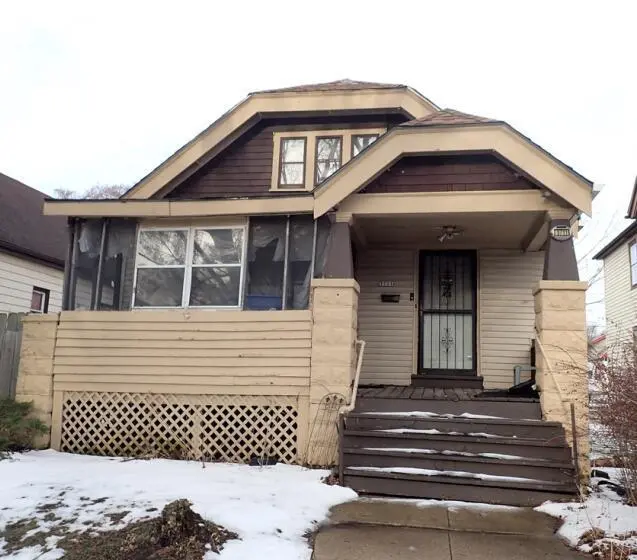
3711 N Dr William Finlayson St · Milwaukee, WI
Flood risk 1/10 · Minimal
- FEMA flood zone
- X (unshaded)
- Chance of flooding over 30 yrs
- 0.0%
- Est. flood insurance / yr
- $473 – $860
Fire risk 1/10 · Minimal
- Est. fire insurance / yr
- $636 – $1,182
Heat risk 2/10 · Minimal
- Hot days now (above 98°F)
- 7 days/yr
- Hot days in 30 yrs
- 13 days/yr
Wind risk 2/10 · Minimal
- Chance of severe wind over 30 yrs
- —
Air-quality risk 3/10 · Minor
- Unhealthy air days now
- 3 days/yr
- Unhealthy air days in 30 yrs
- 4 days/yr
Risk factors via First Street. Map © Google.
Why this score? — see what drove the B+ grade
The composite is a weighted blend of 9 inputs, each scored 0–100. Each bar is that input's sub-score; the figure is the points it added to the 100-point composite (weight × sub-score).
- Cash flow +30.0/30.0
- ARV discount +15.0/15.0
- 1% rule +10.0/10.0
- DSCR +10.0/10.0
- Livability +4.0/5.0
- Rent growth +3.8/5.0
- Condition / age +2.5/5.0
- Schools +1.2/10.0
- Appreciation +0.0/10.0
$79,600
🖨 Deal sheet 📄 Offer letter ✓ Due diligence
Listing remarks
This is a tax foreclosed property. For the first 30-days of the listing period, no offers below listing price will be considered per Wisconsin foreclosure law. Offers from Owner Occupants will be considered preferred bidders. Bids due by July 13th, 2026 at 10:00 am
Key facts
- 5,227 sq ft lot
- Built 1925
- Listed 10 days
Property features AI
Exterior
- Utilities: Municipal water; Municipal sewer
- Home design: Single-family, 1-story; Less than 1/2 acre lot
- Construction: Information source: Assessor/Public Record
- Exterior features: Aluminum and vinyl siding
Interior
- Kitchen: Kitchen on main level — 10 x 10
- Bedrooms: Master bedroom (Main level) — 10 x 10
- Bathrooms: 1 full bathroom
- Heating & cooling: Forced air heating; Natural gas heat source
- Interior features: Full basement
Neighborhood map
What this means for you Summary
Snapshot
- This is a 3-bed/1.0-bath single-family listed at $80k.
Deal economics
- At list price, monthly cash flow is $390 ($5k/yr) — positive.
- The deal already cash-flows at list — no discount required.
- Meets the 1% rule at list price ($1k rent vs $80k).
- Cap rate 12.2% vs local median 5.1% in Milwaukee — top-decile yield for the area; either an underpriced asset or a hidden risk that comps aren't pricing in. Stress-test before assuming the spread holds.
Location & tenants
- Location reads 81/100 on livability (#55 in WI, #1,534 nationally) — a professional / high-income tenant draw. Strengths: amenities A+, commute A+, cost of living A+; Watch: employment D+, schools F, crime F.
- Milwaukee School District (urban): math 10% / reading 18% proficiency, ranked #337 of 342 in WI (top 98%) — low school quality limits family demand, transient renter base, plan for 1-2y turnover; 77% free/reduced lunch — lower-income household profile, screen leases tightly.
- Market conditions: Rents rising fast (+5.0%/yr); 129 active listings in the ZIP; 40 comparable units currently listed for rent nearby; rentals at typical pace (median 24d on market — plan ~3-4 weeks tenant-placement turnaround); 48% of comp listings sitting > 30 days — soft ceiling on asking rent; 1,017 units permitted in Milwaukee County in 2024 (803 in 5+ unit buildings).
- This rent runs 31% of the median local income ($47k/yr) — at the standard rent-burdened threshold; future hikes will face affordability resistance.
Forward outlook
- Local home prices are declining (-3.0%/yr); year-one equity from $550 of loan paydown is wiped out by about $2k of value loss. Plan a longer hold.
- Milwaukee County population projected at +4% by 2050 — modest demand growth; plan on rents tracking national, not racing it.
- At projected returns (-3.0% appreciation + 5.0% rent growth), your $22k cash investment doubles in ~6 years — after that, you're playing with house money.
Negotiation context
- Only 10 days on market — expect competitive offers; lowballing is unlikely to land.
Risks & watch-outs
- Watch-outs: built in 1925 — expect roof / HVAC / electrical / plumbing capex.
Questions for the listing agent
- Built in 1925 — when were the roof, HVAC, electrical panel, plumbing, and water heater last replaced?
- Is there a deadline driving the sale (1031 exchange, divorce, estate, relocation)? That informs how much negotiation room exists.
- Schools are F-rated, which usually means shorter tenancies and higher turnover. Who's the typical renter profile here, and what's been the actual vacancy rate?
- Crime grade is F in this area — have there been break-ins, vandalism, or insurance claims at this property in the last 3 years? What carrier currently insures it and at what premium?
- What's the average days-on-market for RENTAL listings here right now (not sales)? A rising rental-DOM trend means longer vacancies and softer asking-rent achievability than the comps imply.
- What's the recent tenant-quality profile in this submarket — average credit score on applications, eviction rate, late-payment / NSF rate, and stable-employment percentage? A property-management company in the area should have these aggregated.
- How much new for-sale + rental construction is in the pipeline within 1–3 miles? Heavy new supply typically softens prices + rents 12–24 months out; constrained supply supports both.
Investment metrics
- 1% rule
- 1.53% ✓
- Cap rate
- 12.17%
- Cash-on-cash
- 21.00%
- DSCR
- 1.93
- GRM
- 5.4
CMA / ARV
- ARV (on-the-fly)
- $105,522
- Comps found
- 12
Show comp detail 12 sales within ~0.75 mi
| Address | Dist | Beds/Ba | Sqft | Sold | Price | $/sf | Match |
|---|---|---|---|---|---|---|---|
| 3754 N 6th St | 0.11mi | 3/1.0 | 1,192 (-3%) | 9mo | $102,700 | $86 | 83 |
| 3311 N 8th St | 0.43mi | 4/1.0 (+1) | 1,259 (+3%) | 2mo | $63,000 | $50 | 69 |
| 3415 N 2nd St | 0.31mi | 2/1.0 (-1) | 1,292 (+5%) | 4mo | $150,000 | $116 | 68 |
| 3815 N Vel R Phillips Ave | 0.14mi | 3/1.0 | 1,046 (-15%) | 1mo | $170,000 | $163 | 68 |
| 4110 N 7th St | 0.55mi | 3/1.0 | 1,296 (+6%) | 4mo | $95,000 | $73 | 61 |
| 3868 N 15th St | 0.69mi | 3/1.0 | 1,233 (+0%) | 8mo | $70,500 | $57 | 60 |
| 3258 N 1st St | 0.53mi | 3/1.5 | 1,186 (-3%) | 16mo | $165,000 | $139 | 54 |
| 3527 N 14th St | 0.64mi | 4/1.0 (+1) | 1,220 (-1%) | 13mo | $75,000 | $61 | 54 |
| 3427 N Vel R Phillips Ave | 0.23mi | 4/2.0 (+1) | 1,361 (+11%) | 16mo | $165,000 | $121 | 48 |
| 3839 N 14th St | 0.65mi | 3/1.0 | 1,110 (-10%) | 13mo | $125,000 | $113 | 43 |
| 3252 N 11th St | 0.61mi | 4/1.5 (+1) | 1,325 (+8%) | 11mo | $65,000 | $49 | 42 |
| 1114 W Ring St | 0.63mi | 3/1.0 | 1,081 (-12%) | 11mo | $20,000 | $19 | 41 |
Match score weights: distance 35% · size 25% · config 20% · recency 20%. Top-matched comps best support the ARV.
Projected returns pro-forma
-3.0% appreciation · 5.0% rent growth · sell at horizon
- IRR
- 15.8%
- Equity multiple
- 1.65×
- Total profit
- $14,478
- Equity at exit
- $11,869
- IRR
- 25.9%
- Equity multiple
- 3.49×
- Total profit
- $55,415
- Equity at exit
- $6,882
Cash invested: $22,288 (down + closing). Projections, not guarantees.
Landlord ↔ Tenant lean methodology
- Overall (STATE)
- 73 Landlord-Friendly
- State Wisconsin
- 73 Landlord-Friendly · R+2
- County
- — inherits STATE
- City
- — inherits STATE
ZIP-level market 53212
- Rents YoY
- 5.0%
- Active inventory
- 129
- Price-to-rent
- 5.4×
Monthly cashflow live
- Estimated rent
- $1,218 high interval (Pro) →
- Mortgage (P&I)
- −$417
- Tax from tax record
- −$121 /mo · $1,458/yr
- Insurance
- −$33
- HOA
- −$0
- Vacancy / Maint / Mgmt
- −$256
- Net cashflow
- $390
Break-even live
UW: 25.0% down · 7.5% · 30yr · 1.5% tax · 5.0% vac · 8.0% maint · 8.0% mgmt
Financing live
Cash to close
- Down payment
- $19,900
- Closing costs
- $2,388
- Reserves months
- —
- Total cash needed
- —
Loan-product check · same deal, 3 products live
Conventional
25% down · 7.5% · 30yr
- Down + closing
- —
- Monthly P&I
- —
- Monthly cashflow
- —
- DSCR
- —
- Eligible?
- —
Personal DTI + credit; lowest rate.
DSCR
20% down · 8.5% · 30yr
- Down + closing
- —
- Monthly P&I
- —
- Monthly cashflow
- —
- DSCR
- —
- Eligible?
- —
No personal income docs; deal must DSCR.
Hard money
10% down · 12.0% · 12mo
- Down + closing
- —
- Monthly P&I
- —
- Monthly cashflow
- —
- DSCR
- —
- Eligible?
- —
Short-term bridge; refi at stabilization.
Rent comps 40 comps
| Address | Beds | Baths | Sqft | Rent | $/sqft | DOM | Units | Dist |
|---|---|---|---|---|---|---|---|---|
| 3600 N Vel R. Phillips Ave Milwaukee, WI | 2.0 | 1.0 | 900 | $950 | $1.06 | 4d | 1 | 0.09mi |
| 3703 N 1st St Unit Upper-3705 Milwaukee, WI | 3.0 | 1.0 | 1034 | $1,200 | $1.16 | 43d | 1 | 0.24mi |
| 3908 N 6th St Milwaukee, WI | 2.0 | 1.0 | 1100 | $1,150 | $1.05 | 23d | 1 | 0.33mi |
| 4048 N 7th St Milwaukee, WI | 2.0 | 1.0 | 1100 | $1,150 | $1.05 | 23d | 1 | 0.48mi |
| 3373 N Richards St Milwaukee, WI | 2.0 | 1.0 | 950 | $1,150 | $1.21 | 23d | 1 | 0.50mi |
| 312 E Townsend St Unit 312 Milwaukee, WI | 3.0 | 1.0 | 1400 | $1,250 | $0.89 | 23d | 1 | 0.52mi |
| 3352 N Richards St Unit Second floor Milwaukee, WI | 2.0 | 1.0 | 1000 | $1,150 | $1.15 | 43d | 1 | 0.54mi |
| 3228 N Achilles St Unit 3228A Milwaukee, WI | 2.0 | 1.0 | 713 | $895 | $1.26 | 43d | 1 | 0.57mi |
| 3156 N 1st St Milwaukee, WI | 2.0 | 1.0 | 900 | $895 | $0.99 | 43d | 1 | 0.61mi |
| 3255 N Buffum St Unit 3255 Upper Milwaukee, WI | 2.0 | 1.0 | 1100 | $1,350 | $1.23 | 43d | 1 | 0.64mi |
| 3298 N 13th St Milwaukee, WI | 3.0 | 1.0 | 885 | $895 | $1.01 | 43d | 1 | 0.67mi |
| 3368 N Booth St #3374 Milwaukee, WI | 2.0 | 1.0 | 900 | $950 | $1.06 | 43d | 1 | 0.68mi |
| 3368 N Booth St #3374 Milwaukee, WI | 2.0 | 1.0 | 900 | $950 | $1.06 | 23d | 1 | 0.68mi |
| 3025 N 6th St Milwaukee, WI | 2.0 | 1.0 | 1153 | $1,125 | $0.98 | 43d | 1 | 0.73mi |
| 3037 N 1st St Milwaukee, WI | 2.0 | 1.0 | 763 | $990 | $1.30 | 43d | 1 | 0.74mi |
| 223 E Burleigh St Unit 223 Milwaukee, WI | 4.0 | 1.0 | 1153 | $1,395 | $1.21 | 43d | 1 | 0.75mi |
| 3747 N 16th St Milwaukee, WI | 2.0 | 1.0 | 1200 | $875 | $0.73 | 43d | 1 | 0.78mi |
| 3058 N 11th St Unit 3058 Lower Milwaukee, WI | 2.0 | 1.0 | 840 | $945 | $1.12 | 23d | 1 | 0.81mi |
| 605 E Auer Ave Milwaukee, WI | 2.0 | 1.0 | 1200 | $1,200 | $1.00 | 10d | 1 | 0.81mi |
| 3045 N 11th St #3047 Milwaukee, WI | 3.0 | 1.0 | 1065 | $1,175 | $1.10 | 4d | 1 | 0.83mi |
| 3416 N 17th St Unit 1 Milwaukee, WI | 3.0 | 1.0 | 1200 | $1,100 | $0.92 | 43d | 1 | 0.84mi |
| 1326 W Burleigh St Unit 1326 Lower Milwaukee, WI | 2.0 | 1.0 | 900 | $825 | $0.92 | 1d | 1 | 0.87mi |
| 3927-3929 N 17th St Milwaukee, WI | 2.0 | 1.0 | 900 | $1,195 | $1.33 | 43d | 1 | 0.88mi |
| 3029 N Holton St Milwaukee, WI | 3.0 | 1.0 | 980 | $1,200 | $1.22 | 43d | 1 | 0.89mi |
| 3646 N 19th St Milwaukee, WI | 2.0 | 1.0 | 935 | $1,100 | $1.18 | 4d | 1 | 0.93mi |
| 2808 N Palmer St Unit Lower Milwaukee, WI | 2.0 | 1.0 | 1200 | $875 | $0.73 | 43d | 1 | 1.05mi |
| 3911 N 20th St Unit 3913 Milwaukee, WI | 2.0 | 1.0 | 950 | $995 | $1.05 | 23d | 1 | 1.12mi |
| 2719 N 1st St Milwaukee, WI | 2.0 | 1.0 | 1300 | $1,095 | $0.84 | 14d | 1 | 1.12mi |
| 2724 N Palmer St Milwaukee, WI | 3.0 | 1.0 | 900 | $1,300 | $1.44 | 43d | 1 | 1.15mi |
| 2106A W Keefe Ave Unit 2106 Lower Milwaukee, WI | 3.0 | 1.0 | 1300 | $1,100 | $0.85 | 17d | 1 | 1.15mi |
| 2934 N Bremen St Milwaukee, WI | 2.0 | 1.0 | 798 | $1,398 | $1.75 | 23d | 1 | 1.16mi |
| 2716A N Buffum St Milwaukee, WI | 2.0 | 1.0 | 1100 | $1,200 | $1.09 | 21d | 1 | 1.21mi |
| 2955 N 17th St Unit B UPSTAIRS Milwaukee, WI | 2.0 | 1.0 | 1000 | $900 | $0.90 | 17d | 1 | 1.23mi |
| 3410 N 23rd St Milwaukee, WI | 2.0 | 1.0 | 800 | $800 | $1.00 | 17d | 1 | 1.27mi |
| 2577 N Vel R Phillips Ave Milwaukee, WI | 3.0 | 1.0 | 1048 | $1,400 | $1.34 | 17d | 1 | 1.27mi |
| 4532 N Wilson Dr Milwaukee, WI | 2.0 | 1.0 | 950 | $1,560 | $1.64 | 43d | 1 | 1.28mi |
| 2772 N Bremen St Milwaukee, WI | 2.0 | 1.0 | 900 | $1,295 | $1.44 | 43d | 1 | 1.31mi |
| 2772 N Bremen St #2774 Milwaukee, WI | 3.0 | 1.0 | 1500 | $1,795 | $1.20 | 43d | 1 | 1.31mi |
| 4451 N Marlborough Dr Unit 2 Shorewood, WI | 2.0 | 1.0 | 1250 | $2,125 | $1.70 | 2d | 1 | 1.35mi |
| 2761 N Humboldt Blvd Unit First Floor Milwaukee, WI | 3.0 | 1.0 | 1236 | $1,600 | $1.29 | 17d | 1 | 1.38mi |
Listing history 8 events
-
2026-06-18days on market $79,600 Active 10 DOM
-
2026-06-17days on market $79,600 Active 9 DOM
-
2026-06-16days on market $79,600 Active 8 DOM
-
2026-06-15days on market $79,600 Active 7 DOM
-
2026-06-13days on market $79,600 Active 5 DOM
-
2026-06-13days on market $79,600 Active 4 DOM
-
2026-06-08remarks 265-char remark
-
2026-06-08$79,600 Active 1 DOM
ⓘ Source: listings_history table (triggers on properties + properties_extension) + one-shot
backfill from property_details.listing_events for pre-trigger history.
Tax reassessment forecast WI · Partial reset (capped growth)
- Current annual tax
- $1,458 · $121/mo
- Projected year-2 tax
- $1,465 · $122/mo
- Expected delta
- +$8/yr (+$1/mo · 0.5%)
ⓘ Screening estimate from a state-policy table — verify with the county assessor before closing.
Climate risk First Street
- Flood 1/10 Low FEMA zone X (unshaded) · 0% chance over 30 yrs
- Wildfire 1/10 Low
- Heat 2/10 Low 7 d/yr ≥98°F today · 13 d/yr by 30 yrs out
- Wind 2/10 Low
- Air quality 3/10 Moderate 3 unhealthy d/yr today · 4 by 30 yrs out
Nearby sold comps map
Loading sold comps map…
Walkable amenities ~0.75 mi
Loading nearby amenities…
Taxation est. · year 1
- Rental income
- $14,615
- − Mortgage interest
- −$4,459
- − Property taxes
- −$1,458
- − Insurance
- −$398
- − Repairs & maintenance
- −$1,169
- − Management
- −$1,169
- − Depreciation
- −$2,316
- Taxable income
- $3,647
- Est. tax owed @ 24.0%
- −$875
- After-tax cash flow
- $3,806/yr
For passive investors: Depreciation is non-cash, so a rental often shows a tax loss while cash-flowing — sheltering income. Rental losses are passive: they offset passive income freely, and up to $25,000/yr can offset ordinary (W-2) income if you actively participate and your MAGI is under $100k (phasing out to $0 by $150k); unused losses carry forward. On sale, claimed depreciation is recaptured at up to 25%, and gains may owe capital-gains tax (a 1031 exchange can defer both). Figures are a year-1 estimate at your 24.0% rate — not tax advice; consult a CPA.
Schools (NCES district)
- District
- Milwaukee School District
- NCES district ID
- 5509600
- Math proficiency
- 10% ▼ -5.00%
- Reading proficiency
- 18% ▬ 0.00%
- Median HH income
- $36,339
- Composite
- 11.61/100
- National rank
- #9696
- State rank
- #337 of 342 in WI
Livability — Milwaukee
- Score
- 81/100
- State rank
- #55
- US rank
- #1534
Category grades
Schools grade is shown separately in the Schools card above.
Census & demographics
- Census place
- Milwaukee, WI
- County
- Milwaukee County · 926,379 people
- City population
- 573,768
- Metro
- Milwaukee-Waukesha, WI
- Population (ZIP)
- 28,938
- Household income
- $47,298
- Rent vs Own
- Severe rent burden
- 2397.0
Population outlook (Milwaukee County) Hauer SSP2
- Today (2025)
- 995,758 people
- By 2030
- 1,009,124 · +1.3%
- By 2040
- 1,028,128 · +3.3%
- By 2050
- 1,040,066 · +4.4%
- By 2075
- 1,057,849 · +6.2%
- By 2100
- 1,039,774 · +4.4%
Race, ethnicity, and origin ACS 2023
- Neighborhood character
- Diverse neighborhood (Simpson 0.64)
- Race & ethnicity
- Black 48% White 35% Hispanic / Latino 12% Two or more races 9%
- Hispanic origin (detail)
- Mexican 4% Puerto Rican 6%
- Common ancestry
- Romanian 4% Portuguese 2% Italian 2%
- Foreign-born
- 2% · Canada
- Languages at home
- 92% English-only · Spanish 6%
Political lean MEDSL · Milwaukee
- 2024 margin
- Solid D (+38.5) · D 68.3% · R 29.8% · Other 1.8%
- 2008→2024 swing
- +2.7pp toward D · 2008: 35.9pp · 2024: 38.5pp
- All cycles
- 2024: D+38.5 2020: D+39.9 2016: D+37.5 2012: D+34.6 2008: D+35.9
Not yet ingested
- Civics
- —
Market trends
- HPI YoY
- ▼ -216.73%
- Current HPI
- 385.8225
- Rent YoY
- ▲ 5.00%
- Metro
- Milwaukee-Waukesha, WI
- State GDP YoY
- ▲ 2.10%
- F500 in state
- 20
Industry mix (Fortune 500 HQ in WI)
| Industry | F500 HQs | Revenue |
|---|---|---|
| Industrial Machinery | 4 | $23B |
|
||
| Industrial Technology | 2 | $36B |
|
||
| Insurance | 1 | $36B |
|
||
| Professional Services | 1 | $19B |
|
||
| Utilities | 1 | $9B |
|
||
| Consumer Goods | 1 | $3B |
|
||
Price history
1 event — show timeline
- 2026-06-08 Listed $79,600 METROMLS
Property tax history
+7.3%/yrLatest (2024): $1,458 · -56.9% YoY. Source: county tax records.
Cash-flow waterfall
monthlySold comps — $/sqft
last 12 mo · ≤1 miLoading sold comps…