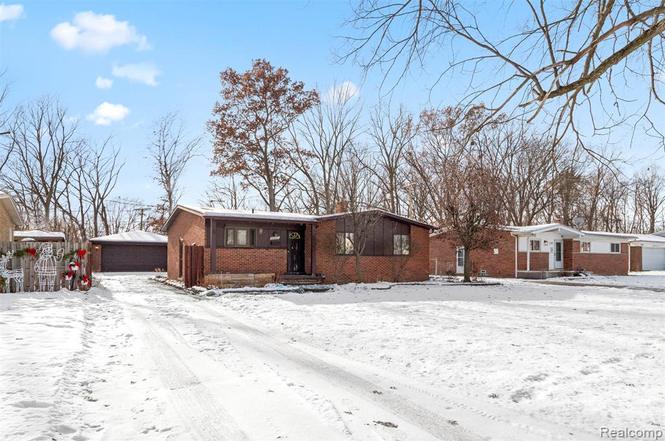
27051 Avondale St · Inkster, MI
Flood risk 1/10 · Minimal
- FEMA flood zone
- X (unshaded)
- Chance of flooding over 30 yrs
- 0.0%
- Est. flood insurance / yr
- $473 – $860
Fire risk 1/10 · Minimal
- Est. fire insurance / yr
- $784 – $1,456
Heat risk 3/10 · Minor
- Hot days now (above 98°F)
- 7 days/yr
- Hot days in 30 yrs
- 15 days/yr
Wind risk 2/10 · Minimal
- Chance of severe wind over 30 yrs
- —
Air-quality risk 2/10 · Minimal
- Unhealthy air days now
- 1 days/yr
- Unhealthy air days in 30 yrs
- 2 days/yr
Risk factors via First Street. Map © Google.
Why this score? — see what drove the D grade
The composite is a weighted blend of 9 inputs, each scored 0–100. Each bar is that input's sub-score; the figure is the points it added to the 100-point composite (weight × sub-score).
- Cash flow +16.6/30.0
- ARV discount +7.1/15.0
- DSCR +5.2/10.0
- 1% rule +4.0/10.0
- Livability +3.4/5.0
- Rent growth +3.2/5.0
- Condition / age +2.5/5.0
- Schools +1.6/10.0
- Appreciation +0.0/10.0
$149,990
🖨 Deal sheet (PDF) 📄 Offer letter ✓ Due diligence
Key facts
- 2 garage spots
- Built 1960
- Listed 10 days
Neighborhood map
What this means for you Summary
Snapshot
- This is a 2-bed/2.0-bath single-family listed at $150k.
Deal economics
- At list price, monthly cash flow is $92 ($1k/yr) — positive.
- The deal already cash-flows at list — no discount required.
- To meet the 1% rule (rent ≥ 1% of price), the offer needs to be $135k (10.2% below list).
- Recommended offer: $135k (10.2% below list) — sets the bar for 1% rule.
- Cap rate 7.0% vs local median 9.3% in Inkster — below-typical yield; the buyer is paying a premium for something (appreciation thesis, condition, location) that the cap rate doesn't capture.
Location & tenants
- Location reads 67/100 on livability (#406 in MI) — a middle-class / working-renter tenant base. Strengths: commute A+, cost of living A+, housing A+; Watch: health & safety D, crime F, amenities F.
- Wayne-Westland Community School District (suburban): math 11% / reading 27% proficiency, ranked #474 of 540 in MI (top 88%) — low school quality limits family demand, transient renter base, plan for 1-2y turnover.
- Zoned schools: David Hicks School (math 2% / reading 8%, grade F, #1,325 of 1,397 statewide, top 99%, 407 students, 89% FRL); Wayne Memorial High School (math 12% / reading 37%, grade F, #481 of 713 statewide, top 81%, 1,361 students, 63% FRL) — zoned schools average 76% FRL vs 56% district-wide (21 pts higher); higher-poverty schools than district average — tighter screening recommended.
- Market conditions: Rents rising (+3.0%/yr); 147 active listings in the ZIP; 19 comparable units currently listed for rent nearby; rentals at typical pace (median 15d on market — plan ~3-4 weeks tenant-placement turnaround); lower-income renter base — watch delinquency; 2,639 units permitted in Wayne County in 2024 (1,216 in 5+ unit buildings).
- This rent runs 41% of the median local income ($39k/yr) — at the standard rent-burdened threshold; future hikes will face affordability resistance.
Forward outlook
- Local home prices are declining (-3.0%/yr); year-one equity from $1k of loan paydown is wiped out by about $4k of value loss. Plan a longer hold.
- Wayne County population projected at -17% by 2050 — secular population decline; favor cash flow + early exit over multi-decade hold.
Negotiation context
- Only 10 days on market — expect competitive offers; lowballing is unlikely to land.
- 2 sale attempts with the ask held roughly flat each time — persistent listings suggest the price (not the market) is what's stuck; bring a comps-based counter.
Questions for the listing agent
- Built in 1960 — when were the roof, HVAC, electrical panel, plumbing, and water heater last replaced?
- Is there a deadline driving the sale (1031 exchange, divorce, estate, relocation)? That informs how much negotiation room exists.
- Schools are F-rated, which usually means shorter tenancies and higher turnover. Who's the typical renter profile here, and what's been the actual vacancy rate?
- Crime grade is F in this area — have there been break-ins, vandalism, or insurance claims at this property in the last 3 years? What carrier currently insures it and at what premium?
- The area grade is low — what's the realistic commute time and amenity access for the typical tenant pool here? Any planned neighborhood developments (good or bad) we should know about?
- What's the average days-on-market for RENTAL listings here right now (not sales)? A rising rental-DOM trend means longer vacancies and softer asking-rent achievability than the comps imply.
- What's the recent tenant-quality profile in this submarket — average credit score on applications, eviction rate, late-payment / NSF rate, and stable-employment percentage? A property-management company in the area should have these aggregated.
- How much new for-sale + rental construction is in the pipeline within 1–3 miles? Heavy new supply typically softens prices + rents 12–24 months out; constrained supply supports both.
Investment metrics
- 1% rule
- 0.90% ✗
- Cap rate
- 7.03%
- Cash-on-cash
- 2.62%
- DSCR
- 1.12
- GRM
- 9.3
CMA / ARV
- ARV (on-the-fly)
- $148,552
- Comps found
- 12
Show comp detail 12 sales within ~0.75 mi
| Address | Dist | Beds/Ba | Sqft | Sold | Price | $/sf | Match |
|---|---|---|---|---|---|---|---|
| 256 Brentwood St | 0.37mi | 3/1.0 (+1) | 1,190 (-1%) | 7mo | $135,000 | $113 | 67 |
| 26508 Monticello St | 0.40mi | 3/1.0 (+1) | 1,150 (-4%) | 6mo | $125,000 | $109 | 60 |
| 784 Patterson Ct | 0.47mi | 3/2.0 (+1) | 1,140 (-5%) | 6mo | $170,000 | $149 | 60 |
| 1088 Arlington St | 0.22mi | 3/1.0 (+1) | 1,076 (-10%) | 4mo | $137,500 | $128 | 60 |
| 324 Tromley St | 0.52mi | 3/1.0 (+1) | 1,200 (+0%) | 9mo | $1,250 | $1 | 59 |
| 201 Cardwell St | 0.59mi | 3/2.5 (+1) | 1,240 (+4%) | 6mo | $65,000 | $52 | 55 |
| 1248 Colonial Dr | 0.47mi | 3/1.0 (+1) | 1,120 (-6%) | 6mo | $105,000 | $94 | 53 |
| 363 Sherbourne St | 0.39mi | 3/1.5 (+1) | 1,030 (-14%) | 2mo | $160,000 | $155 | 50 |
| 226 Belton St | 0.69mi | 3/1.5 (+1) | 1,104 (-8%) | 8mo | $200,000 | $181 | 41 |
| 26348 N River Park Dr | 0.45mi | 3/1.0 (+1) | 1,030 (-14%) | 11mo | $171,000 | $166 | 37 |
| 2500 Weithoff Ct | 0.75mi | 3/1.0 (+1) | 1,050 (-12%) | 3mo | $125,000 | $119 | 33 |
| 26621 Oakland St | 0.61mi | 3/1.0 (+1) | 1,050 (-12%) | 11mo | $130,000 | $124 | 33 |
Match score weights: distance 35% · size 25% · config 20% · recency 20%. Top-matched comps best support the ARV.
Projected returns pro-forma
-3.0% appreciation · 2.95% rent growth · sell at horizon
- IRR
- -12.2%
- Equity multiple
- 0.56×
- Total profit
- $-18,558
- Equity at exit
- $22,364
- IRR
- -3.2%
- Equity multiple
- 0.79×
- Total profit
- $-9,004
- Equity at exit
- $12,968
Cash invested: $41,997 (down + closing). Projections, not guarantees.
Landlord ↔ Tenant lean methodology
- Overall (STATE)
- 62 Landlord-Friendly
- State Michigan
- 62 Landlord-Friendly · EVEN
- County
- — inherits STATE
- City
- — inherits STATE
ZIP-level market 48141
- Home prices YoY
- -2.9%
- Rents YoY
- 3.0%
- Active inventory
- 147
- Price-to-rent
- 9.3×
Monthly cashflow live
- Estimated rent
- $1,347 high interval (Pro) →
- Mortgage (P&I)
- −$787
- Tax from tax record
- −$124 /mo · $1,482/yr
- Insurance
- −$62
- HOA
- −$0
- Vacancy / Maint / Mgmt
- −$283
- Net cashflow
- $92
Break-even live
Sensitivity live
| Price | -10% $176 | -5% $134 | +0% $92 | +5% $49 | +10% $7 |
|---|---|---|---|---|---|
| Rent | -10% $-15 | -5% $38 | +0% $92 | +5% $145 | +10% $198 |
| Rate | -1.0pp $167 | -0.5pp $130 | base $92 | +0.5pp $53 | +1.0pp $13 |
UW: 25.0% down · 7.5% · 30yr · 1.5% tax · 5.0% vac · 8.0% maint · 8.0% mgmt
Financing live
Cash to close
- Down payment
- $37,498
- Closing costs
- $4,500
- Reserves months
- —
- Total cash needed
- —
Loan-product check · same deal, 3 products live
Conventional
25% down · 7.5% · 30yr
- Down + closing
- —
- Monthly P&I
- —
- Monthly cashflow
- —
- DSCR
- —
- Eligible?
- —
Personal DTI + credit; lowest rate.
DSCR
20% down · 8.5% · 30yr
- Down + closing
- —
- Monthly P&I
- —
- Monthly cashflow
- —
- DSCR
- —
- Eligible?
- —
No personal income docs; deal must DSCR.
Hard money
10% down · 12.0% · 12mo
- Down + closing
- —
- Monthly P&I
- —
- Monthly cashflow
- —
- DSCR
- —
- Eligible?
- —
Short-term bridge; refi at stabilization.
Rent comps 19 comps
| Address | Beds | Baths | Sqft | Rent | $/sqft | DOM | Units | Dist |
|---|---|---|---|---|---|---|---|---|
| 27184 Lucerne Dr Inkster, MI | 3.0 | 1.0 | 1100 | $1,250 | $1.14 | 45d | 1 | 0.12mi |
| 1189 Woodland Dr Inkster, MI | 3.0 | 1.0 | 994 | $1,400 | $1.41 | 1d | 1 | 0.54mi |
| 238 Yorkshire Blvd Dearborn Heights, MI | 1.0–2.0 | 1.0 | 741 | $1,424 | $1.92 | 0d | 15 | 0.62mi |
| 1150 Magnolia Dr Inkster, MI | 3.0 | 1.0 | 900 | $1,300 | $1.44 | 26d | 1 | 0.63mi |
| 26322 Westphal St Dearborn Heights, MI | 1.0–2.0 | 1.0 | 762 | $1,455 | $1.91 | 0d | 25 | 0.74mi |
| 572 Tobin Dr Inkster, MI | 1.0–3.0 | 1.0–2.0 | 936 | $1,280 | $1.37 | 0d | 20 | 0.78mi |
| 167 Cherry Valley Dr Inkster, MI | 1.0–2.0 | 1.0 | 784 | $1,395 | $1.78 | 16d | 12 | 0.78mi |
| 641 Gilman St Garden City, MI | 3.0 | 1.0 | 1300 | $2,600 | $2.00 | 18d | 1 | 1.02mi |
| 29203 Oakwood St Inkster, MI | 3.0 | 1.5 | 912 | $1,600 | $1.75 | 0d | 1 | 1.12mi |
| 25745 Princeton St Dearborn Heights, MI | 3.0 | 1.0 | 1080 | $1,500 | $1.39 | 12d | 1 | 1.31mi |
| 3236 Walnut St Inkster, MI | 3.0 | 1.0 | 1096 | $1,495 | $1.36 | 0d | 1 | 1.33mi |
| 26742 Penn St Inkster, MI | 3.0 | 1.0 | 1000 | $1,300 | $1.30 | 18d | 1 | 1.34mi |
| 27149 Penn St Inkster, MI | 1.0 | 1.0 | 846 | $650 | $0.77 | 19d | 1 | 1.35mi |
| 27139 Penn St Inkster, MI | 3.0 | 1.0 | 832 | $675 | $0.81 | 19d | 1 | 1.35mi |
| 26707 Penn St Inkster, MI | 3.0 | 1.0 | 900 | $1,400 | $1.56 | 7d | 1 | 1.37mi |
| 29800 Oakwood St Inkster, MI | 3.0 | 1.0 | 1040 | $1,400 | $1.35 | 14d | 1 | 1.38mi |
| 1713 Gilman St Garden City, MI | 3.0 | 1.0 | 860 | $1,600 | $1.86 | 0d | 1 | 1.42mi |
| 24720 Michigan Ave Dearborn, MI | 2.0 | 1.0 | 900 | $1,350 | $1.50 | 45d | 1 | 1.49mi |
| 30010 Hazelwood St Inkster, MI | 3.0 | 1.0 | 1044 | $1,300 | $1.25 | 45d | 1 | 1.50mi |
Listing history 4 events
-
2025-12-27status Pending
-
2025-12-27status Pending
-
2025-12-17$149,990 Active
-
2025-12-17$149,990 Active
ⓘ Source: listings_history table (triggers on properties + properties_extension) + one-shot
backfill from property_details.listing_events for pre-trigger history.
Tax reassessment forecast MI · Partial reset (capped growth)
- Current annual tax
- $1,482 · $124/mo
- Projected year-2 tax
- $1,896 · $158/mo
- Expected delta
- +$414/yr (+$34/mo · 27.9%)
ⓘ Screening estimate from a state-policy table — verify with the county assessor before closing.
Climate risk First Street
- Flood 1/10 Low FEMA zone X (unshaded) · 0% chance over 30 yrs
- Wildfire 1/10 Low
- Heat 3/10 Moderate 7 d/yr ≥98°F today · 15 d/yr by 30 yrs out
- Wind 2/10 Low
- Air quality 2/10 Low 1 unhealthy d/yr today · 2 by 30 yrs out
Nearby sold comps map
Loading sold comps map…
Walkable amenities ~0.75 mi
Loading nearby amenities…
Taxation est. · year 1
- Rental income
- $16,165
- − Mortgage interest
- −$8,402
- − Property taxes
- −$1,482
- − Insurance
- −$750
- − Repairs & maintenance
- −$1,293
- − Management
- −$1,293
- − Depreciation
- −$4,363
- Taxable loss
- −$1,419
- Est. tax savings @ 24.0%
- +$341
- After-tax cash flow
- $1,440/yr
For passive investors: Depreciation is non-cash, so a rental often shows a tax loss while cash-flowing — sheltering income. Rental losses are passive: they offset passive income freely, and up to $25,000/yr can offset ordinary (W-2) income if you actively participate and your MAGI is under $100k (phasing out to $0 by $150k); unused losses carry forward. On sale, claimed depreciation is recaptured at up to 25%, and gains may owe capital-gains tax (a 1031 exchange can defer both). Figures are a year-1 estimate at your 24.0% rate — not tax advice; consult a CPA.
Schools (NCES district)
- District
- Wayne-Westland Community School District
- NCES district ID
- 2600015
- Math proficiency
- 11% ▼ -6.00%
- Reading proficiency
- 27% ▼ -2.00%
- Median HH income
- $43,524
- Composite
- 16.4/100
- National rank
- #9195
- State rank
- #474 of 540 in MI
Livability — Inkster
- Score
- 67/100
- State rank
- #406
- US rank
- #11087
Category grades
Schools grade is shown separately in the Schools card above.
Census & demographics
- Census place
- Inkster, MI
- County
- Wayne County · 1,562,939 people
- City population
- 25,428
- Metro
- Detroit-Warren-Dearborn, MI
- Population (ZIP)
- 25,428
- Household income
- $39,252
- Rent vs Own
- Severe rent burden
- 1558.0
Population outlook (Wayne County) Hauer SSP2
- Today (2025)
- 1,675,273 people
- By 2030
- 1,620,300 · -3.3%
- By 2040
- 1,502,341 · -10.3%
- By 2050
- 1,384,039 · -17.4%
- By 2075
- 1,124,592 · -32.9%
- By 2100
- 881,193 · -47.4%
Race, ethnicity, and origin ACS 2023
- Neighborhood character
- Predominantly Black (72%)
- Race & ethnicity
- Black 72% White 17% Two or more races 7% Hispanic / Latino 2% Asian 1%
- Common ancestry
- Romanian 3% Slovak 1% Italian 1%
- Foreign-born
- 5% · Canada, China
- Languages at home
- 92% English-only · Arabic 3% Other Asian/Pacific 1% Spanish 1%
Political lean MEDSL · Wayne
- 2024 margin
- Strong D (+29.0) · D 62.7% · R 33.7% · Other 3.6%
- 2008→2024 swing
- -20.5pp toward R · 2008: 49.5pp · 2024: 29.0pp
- All cycles
- 2024: D+29.0 2020: D+38.1 2016: D+37.3 2012: D+46.9 2008: D+49.5
Not yet ingested
- Civics
- —
Market trends
- HPI YoY
- ▼ -11.74%
- Current HPI
- 390.2139
- Rent YoY
- ▲ 2.95%
- Metro
- Detroit-Warren-Dearborn, MI
- State GDP YoY
- ▲ 1.37%
- F500 in state
- 28
Industry mix (Fortune 500 HQ in MI)
| Industry | F500 HQs | Revenue |
|---|---|---|
| Automotive Parts | 3 | $48B |
|
||
| Automotive | 2 | $372B |
|
||
| Chemicals | 1 | $45B |
|
||
| Automotive Retail | 1 | $29B |
|
||
| Healthcare / Medical Devices | 1 | $23B |
|
||
| Automotive Technology | 1 | $20B |
|
||
Price history
+0.0% since first listed4 events — show timeline
- 2025-12-27 Pending — MiRealSource-MiMLS
- 2025-12-27 Pending — REALCOMP
- 2025-12-17 Listed $149,990 REALCOMP
- 2025-12-17 Listed $149,990 MiRealSource-MiMLS
Property tax history
-8.5%/yrLatest (2025): $1,482 · -46.3% YoY. Source: county tax records.
Cash-flow waterfall
monthlySold comps — $/sqft
last 12 mo · ≤1 miLoading sold comps…