914 Wynnewood Rd Unit LL1 · Pelham Manor, NY
Flood risk 8/10 · Major
- FEMA flood zone
- X (unshaded)
- Chance of flooding over 30 yrs
- 0.98%
- Est. flood insurance / yr
- $473 – $860
Fire risk 1/10 · Minimal
- Est. fire insurance / yr
- $691 – $1,283
Heat risk 6/10 · Moderate
- Hot days now (above 98°F)
- 7 days/yr
- Hot days in 30 yrs
- 14 days/yr
Wind risk 6/10 · Moderate
- Chance of severe wind over 30 yrs
- 27.0%
Air-quality risk 5/10 · Moderate
- Unhealthy air days now
- 6 days/yr
- Unhealthy air days in 30 yrs
- 8 days/yr
Risk factors via First Street. Map © Google.
Why this score? — see what drove the C+ grade
The composite is a weighted blend of 9 inputs, each scored 0–100. Each bar is that input's sub-score; the figure is the points it added to the 100-point composite (weight × sub-score).
- Cash flow +23.1/30.0
- 1% rule +8.1/10.0
- Schools +7.6/10.0
- ARV discount +7.5/15.0
- DSCR +7.4/10.0
- Livability +3.9/5.0
- Rent growth +2.5/5.0
- Condition / age +2.5/5.0
- Appreciation +0.0/10.0
$260,000
🖨 Deal sheet 📄 Offer letter ✓ Due diligence
Listing remarks
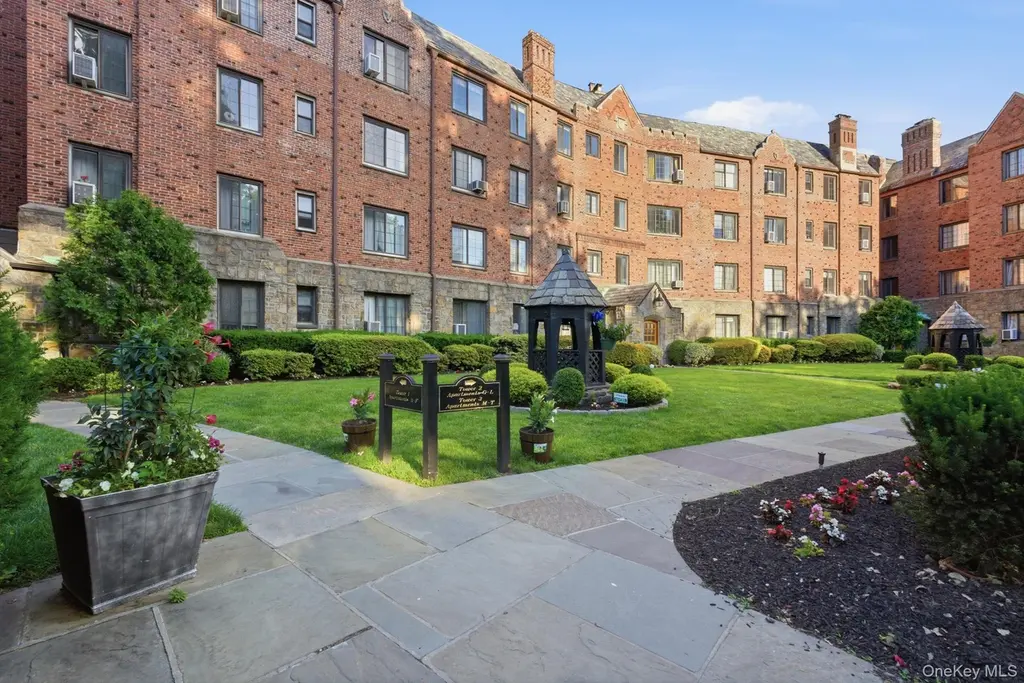
Hidden gem in the highly sought-after condominium complex, The Fairways! Located on the lower level of a pristinely maintained, Tudor-style building with classic pre-war construction, this charming 1 bedroom, 1 bath condo is move-in ready! The entire apartment has been freshly painted, showcasing beautiful, gleaming hardwood floors throughout. Enjoy cooking and dining in the inviting eat-in kitchen, complete with newer stainless steel appliances. Building amenities include a community room, a common laundry area, and beautifully landscaped outdoor spaces. This unit comes with one assigned outdoor parking space. Unbeatable Pelham Manor location offering convenience and classic Westchester c
Key facts
- Pre-war construction
- Eat-in kitchen
- Tudor-style building
Tags
Property features AI
Finance
- HOA & community: Has association (The Fairways); Association fee $447 monthly; HOA fee covers common area maintenance, electricity, exterior maintenance, heat, hot water, and snow removal
Exterior
- Parking: Assigned parking (1 space); Parking fee of $50
- Utilities: Public sewer; Trash collection (public)
- Home design: Condominium; Entry level: 1
- Construction: Brick construction
- Exterior features: Bicycle room; Outdoor space; Not waterfront
Interior
- Kitchen: Dishwasher; Microwave; Range; Refrigerator
- Bedrooms: 3 rooms total
- Bathrooms: 1 full bathroom
- Heating & cooling: Baseboard heating; Wall/window air conditioning unit(s)
- Interior features: Open kitchen; Walk-in closet(s); Basement with walk-out access
- Laundry & utility: Laundry in basement
Neighborhood map
What this means for you Summary
Snapshot
- This is a 1-bed/1.0-bath condo listed at $260k.
Deal economics
- At list price, monthly cash flow is $409 ($5k/yr) — positive.
- The deal already cash-flows at list — no discount required.
- Meets the 1% rule at list price ($3k rent vs $260k).
- Cap rate 8.4% vs local median 0.6% in Pelham Manor — top-decile yield for the area; either an underpriced asset or a hidden risk that comps aren't pricing in. Stress-test before assuming the spread holds.
Location & tenants
- Location reads 77/100 on livability (#181 in NY, #2,823 nationally) — a middle-class / working-renter tenant base. Strengths: crime A+, commute A+, employment A+; Watch: amenities F, cost of living F, health & safety D-.
- Pelham Union Free School District (suburban): math 80% / reading 81% proficiency, ranked #29 of 590 in NY (top 5%) — strong family-tenant draw, lease renewals of 3-5y typical; only 5% free/reduced lunch — higher-income household profile.
- Zoned schools: Prospect Hill School (math 77% / reading 77%, grade A, #244 of 2,108 statewide, top 13%, 325 students, 2% FRL); Pelham Middle School (math 72% / reading 82%, grade A, #41 of 729 statewide, top 6%, 649 students, 0% FRL); Pelham Memorial High School (math 96% / reading 77%, grade A, #336 of 1,100 statewide, top 31%, 875 students, 14% FRL) — zoned schools at 6% FRL track the district average.
- Market conditions: 80 active listings in the ZIP; high-income renter base; 954 units permitted in Westchester County in 2024 (649 in 5+ unit buildings).
Forward outlook
- Local home prices are declining (-3.0%/yr); year-one equity from $2k of loan paydown is wiped out by about $8k of value loss. Plan a longer hold.
- Westchester County population projected at +10% by 2050 — modest demand growth; plan on rents tracking national, not racing it.
Negotiation context
- Only 7 days on market — expect competitive offers; lowballing is unlikely to land.
- Current owner paid $72k; list at $260k implies a 259% gain — meaningful room to come down on a strong offer.
Risks & watch-outs
- Watch-outs: flood insurance adds $56/mo; built in 1928 — expect roof / HVAC / electrical / plumbing capex.
- Climate carrying-cost: severe flood risk; major wind risk, 27% chance of damaging wind over 30y; extreme-heat days projected 7→14/yr by 2055 (HVAC capex compounding) — expect insurance premiums to compound above CPI over the hold.
Questions for the listing agent
- Built in 1928 — when were the roof, HVAC, electrical panel, plumbing, and water heater last replaced?
- What's the actual annual flood-insurance premium (NFIP or private), and is the property in a SFHA with mandatory coverage?
- What does the HOA fee cover, when was the last increase, and are there any pending special assessments or reserve-fund shortfalls?
- Any open or pending special assessments — roof, HVAC, plumbing, elevator, façade? What's the per-unit balance and payoff schedule, and is the seller paying it off at close or rolling it to the buyer?
- Is there a deadline driving the sale (1031 exchange, divorce, estate, relocation)? That informs how much negotiation room exists.
- Schools are A-rated — typically a magnet for longer-tenancy family renters. What's the average tenant stay here, and is there a school-zone premium baked into asking?
- What's the average days-on-market for RENTAL listings here right now (not sales)? A rising rental-DOM trend means longer vacancies and softer asking-rent achievability than the comps imply.
- What's the recent tenant-quality profile in this submarket — average credit score on applications, eviction rate, late-payment / NSF rate, and stable-employment percentage? A property-management company in the area should have these aggregated.
- How much new apartment / multifamily construction is in the pipeline within 1–3 miles? Heavy new supply (>2% of stock underway) typically softens rents 12–24 months out; light construction supports rent growth.
Investment metrics
- 1% rule
- 1.31% ✓
- Cap rate
- 8.44%
- Cash-on-cash
- 7.66%
- DSCR
- 1.34
- GRM
- 6.4
CMA / ARV
No comps found within radius.
Projected returns pro-forma
-3.0% appreciation · 3.0% rent growth · sell at horizon
- IRR
- -5.8%
- Equity multiple
- 0.78×
- Total profit
- $-15,724
- Equity at exit
- $38,767
- IRR
- 4.0%
- Equity multiple
- 1.29×
- Total profit
- $21,289
- Equity at exit
- $22,480
Cash invested: $72,800 (down + closing). Projections, not guarantees.
Landlord ↔ Tenant lean methodology
- Overall (STATE)
- 15 Strongly Tenant-Friendly
- State New York
- 15 Strongly Tenant-Friendly · D+10
- County
- — inherits STATE
- City
- — inherits STATE
ZIP-level market 10803
- Active inventory
- 80
- Price-to-rent
- 6.4×
Monthly cashflow live
- Estimated rent
- $3,412 medium interval (Pro) →
- Mortgage (P&I)
- −$1,363
- Tax from tax record
- −$312 /mo · $3,743/yr
- Insurance
- −$108
- Flood insurance flood zone
- −$56 /mo · $666/yr
- HOA
- −$447
- Vacancy / Maint / Mgmt
- −$716
- Net cashflow
- $409
Break-even live
UW: 25.0% down · 7.5% · 30yr · 1.5% tax · 5.0% vac · 8.0% maint · 8.0% mgmt
Financing live
Cash to close
- Down payment
- $65,000
- Closing costs
- $7,800
- Reserves months
- —
- Total cash needed
- —
Loan-product check · same deal, 3 products live
Conventional
25% down · 7.5% · 30yr
- Down + closing
- —
- Monthly P&I
- —
- Monthly cashflow
- —
- DSCR
- —
- Eligible?
- —
Personal DTI + credit; lowest rate.
DSCR
20% down · 8.5% · 30yr
- Down + closing
- —
- Monthly P&I
- —
- Monthly cashflow
- —
- DSCR
- —
- Eligible?
- —
No personal income docs; deal must DSCR.
Hard money
10% down · 12.0% · 12mo
- Down + closing
- —
- Monthly P&I
- —
- Monthly cashflow
- —
- DSCR
- —
- Eligible?
- —
Short-term bridge; refi at stabilization.
HOA detail condo
- Monthly dues
- $447 · $5,364/yr
- Assessments
- None detected in remarks — confirm with the listing agent.
Listing history 7 events
-
2026-06-18days on market $260,000 Active 7 DOM
-
2026-06-17days on market $260,000 Active 6 DOM
-
2026-06-16days on market $260,000 Active 5 DOM
-
2026-06-15days on market $260,000 Active 4 DOM
-
2026-06-13days on market $260,000 Active 2 DOM
-
2026-06-13remarks 699-char remark
-
2026-06-13$260,000 Active 1 DOM
ⓘ Source: listings_history table (triggers on properties + properties_extension) + one-shot
backfill from property_details.listing_events for pre-trigger history.
Tax reassessment forecast NY · Partial reset (capped growth)
- Current annual tax
- $3,743 · $312/mo
- Projected year-2 tax
- $4,069 · $339/mo
- Expected delta
- +$325/yr (+$27/mo · 8.7%)
ⓘ Screening estimate from a state-policy table — verify with the county assessor before closing.
Climate risk First Street
- Flood 8/10 Severe FEMA zone X (unshaded) · 98% chance over 30 yrs
- Wildfire 1/10 Low
- Heat 6/10 Major 7 d/yr ≥98°F today · 14 d/yr by 30 yrs out
- Wind 6/10 Major 27% chance of damaging wind over 30 yrs
- Air quality 5/10 Major 6 unhealthy d/yr today · 8 by 30 yrs out
Nearby sold comps map
Loading sold comps map…
Walkable amenities ~0.75 mi
Loading nearby amenities…
Taxation est. · year 1
- Rental income
- $40,943
- − Mortgage interest
- −$14,564
- − Property taxes
- −$3,743
- − Insurance
- −$1,966
- − Repairs & maintenance
- −$3,275
- − Management
- −$3,275
- − HOA
- −$5,364
- − Depreciation
- −$7,564
- Taxable income
- $1,190
- Est. tax owed @ 24.0%
- −$286
- After-tax cash flow
- $4,623/yr
For passive investors: Depreciation is non-cash, so a rental often shows a tax loss while cash-flowing — sheltering income. Rental losses are passive: they offset passive income freely, and up to $25,000/yr can offset ordinary (W-2) income if you actively participate and your MAGI is under $100k (phasing out to $0 by $150k); unused losses carry forward. On sale, claimed depreciation is recaptured at up to 25%, and gains may owe capital-gains tax (a 1031 exchange can defer both). Figures are a year-1 estimate at your 24.0% rate — not tax advice; consult a CPA.
Schools (NCES district)
- District
- Pelham Union Free School District
- NCES district ID
- 3622680
- Math proficiency
- 80% ▲ 3.00%
- Reading proficiency
- 81% ▲ 6.00%
- Median HH income
- $136,478
- Composite
- 76.35/100
- National rank
- #109
- State rank
- #29 of 590 in NY
Livability — Pelham Manor
- Score
- 77/100
- State rank
- #181
- US rank
- #2823
Category grades
Schools grade is shown separately in the Schools card above.
Census & demographics
- Census place
- Pelham Manor, NY
- County
- Westchester County · 709,332 people
- City population
- 13,096
- Metro
- New York-Newark-Jersey City, NY-NJ-PA
- Population (ZIP)
- 13,072
- Household income
- $215,208
- Rent vs Own
- Severe rent burden
- 119.0
Population outlook (Westchester County) Hauer SSP2
- Today (2025)
- 1,028,035 people
- By 2030
- 1,051,636 · +2.3%
- By 2040
- 1,098,520 · +6.9%
- By 2050
- 1,136,044 · +10.5%
- By 2075
- 1,196,925 · +16.4%
- By 2100
- 1,175,147 · +14.3%
Race, ethnicity, and origin ACS 2023
- Neighborhood character
- Predominantly White (67%)
- Race & ethnicity
- White 67% Hispanic / Latino 13% Two or more races 12% Asian 7% Black 6%
- Hispanic origin (detail)
- Mexican 2% Puerto Rican 4% Dominican 3% Salvadoran 1%
- Common ancestry
- Romanian 3% Scotch-Irish 3% Slovak 2%
- Foreign-born
- 17% · Canada, China, South Korea
- Languages at home
- 80% English-only · Spanish 7% Other Indo-European 6% Russian/Polish/Slavic 2%
Political lean MEDSL · Westchester
- 2024 margin
- Strong D (+26.3) · D 63.1% · R 36.9%
- 2008→2024 swing
- -1.3pp toward R · 2008: 27.6pp · 2024: 26.3pp
- All cycles
- 2024: D+26.3 2020: D+36.3 2016: D+32.8 2012: D+22.2 2008: D+27.6
Not yet ingested
- Civics
- —
Market trends
- HPI YoY
- ▼ -844.94%
- Current HPI
- 357.3886
- Rent YoY
- —
- Metro
- New York-Newark-Jersey City, NY-NJ-PA
- State GDP YoY
- ▲ 2.60%
- F500 in state
- 92
Industry mix (Fortune 500 HQ in NY)
| Industry | F500 HQs | Revenue |
|---|---|---|
| Financial Services | 10 | $950B |
|
||
| Consumer Goods | 9 | $162B |
|
||
| Insurance | 4 | $225B |
|
||
| Telecommunications | 2 | $144B |
|
||
| Pharmaceuticals | 2 | $112B |
|
||
| Media / Entertainment | 2 | $69B |
|
||
Price history
+258.6% since first listed2 events — show timeline
- 2026-06-03 Listed $260,000 OneKey® MLS as Distributed by MLS Grid
- 2003-02-11 Sold (Public Records) $72,500 Public Records
Property tax history
+18.0%/yrLatest (2025): $3,743 · +0.6% YoY. Source: county tax records.
Cash-flow waterfall
monthlySold comps — $/sqft
last 12 mo · ≤1 miLoading sold comps…