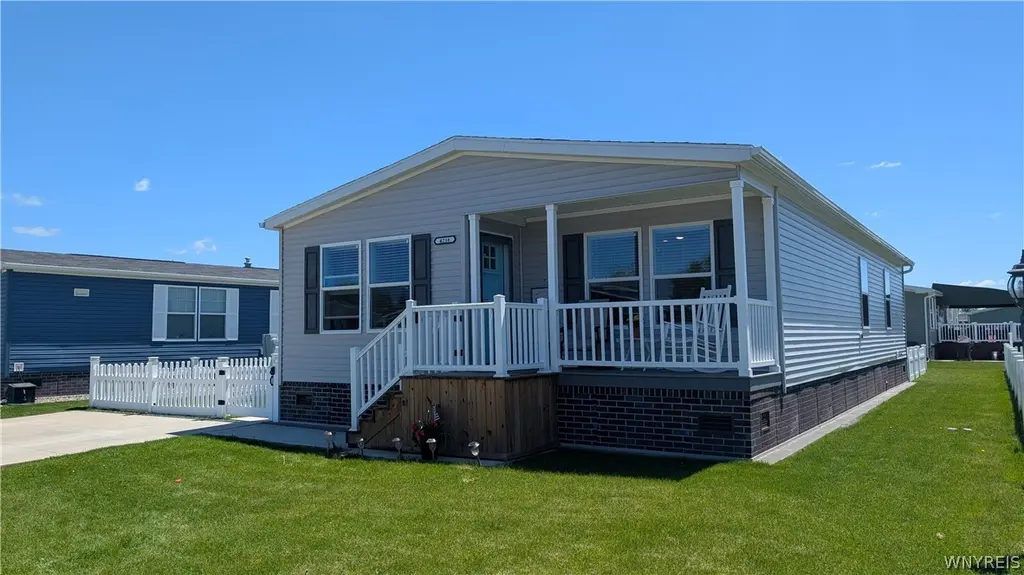
4216 Mohawk Pkwy · Niagara Falls, NY
Flood risk 1/10 · Minimal
- FEMA flood zone
- X (unshaded)
- Chance of flooding over 30 yrs
- 0.0%
- Est. flood insurance / yr
- $507 – $1,088
Fire risk 1/10 · Minimal
- Est. fire insurance / yr
- $691 – $1,283
Heat risk 3/10 · Minor
- Hot days now (above 95°F)
- 7 days/yr
- Hot days in 30 yrs
- 14 days/yr
Wind risk 1/10 · Minimal
- Chance of severe wind over 30 yrs
- —
Air-quality risk 3/10 · Minor
- Unhealthy air days now
- 2 days/yr
- Unhealthy air days in 30 yrs
- 4 days/yr
Risk factors via First Street. Map © Google.
Why this score? — see what drove the C- grade
The composite is a weighted blend of 9 inputs, each scored 0–100. Each bar is that input's sub-score; the figure is the points it added to the 100-point composite (weight × sub-score).
- Cash flow +22.7/30.0
- DSCR +7.3/10.0
- 1% rule +5.9/10.0
- Schools +5.8/10.0
- Condition / age +4.0/5.0
- Livability +3.0/5.0
- Rent growth +2.5/5.0
- ARV discount +0.0/15.0
- Appreciation +0.0/10.0
$145,000
🖨 Deal sheet 📄 Offer letter ✓ Due diligence
Listing remarks
Welcome to this beautifully maintained home in Tuscarora Village, built in 2021 and offering modern comfort in a walkable community. Enjoy relaxing evenings on the inviting front porch or spending time in the fully fenced yard. Step inside to an open-concept layout featuring a spacious living room with a cozy gas fireplace, seamlessly connected to the kitchen and dining area. The kitchen is designed for both everyday living and entertaining, with granite countertops, a large center island, and abundant counter space. This meticulously cared-for home offers three generously sized bedrooms, including a stunning primary suite with an attached bathroom featuring double sinks and a walk-in showe
Key facts
- Large center island
- Front porch
- Gas fireplace
Tags
Property features AI
Finance
- Financial info: Land lease amount $735
- HOA & community: Monthly association fee
Exterior
- Parking: No garage
- Utilities: Public water (connected); Sewer connected
- Home design: Single-story home; New construction; Double wide body type
- Construction: Vinyl siding; Asphalt shingle roof; Slab foundation; New construction
- Exterior features: Concrete driveway; Fully fenced yard; Open porch
Interior
- Kitchen: Granite counters; Kitchen island; Gas oven and gas range; Microwave; Dishwasher; Refrigerator
- Bedrooms: Three main-level bedrooms; Bedroom sizes roughly 13.5 x 12.5, 12 x 10, and 11 x 10 (all on the first level)
- Flooring: Hardwood; Laminate; Varied flooring
- Bathrooms: Two full bathrooms (both on the main level)
- Heating & cooling: Gas forced-air heating; Central air conditioning
- Interior features: Separate/formal living room; Granite counters; Kitchen island; Main level primary suite; Bedroom on main level; Has fireplace (1)
- Laundry & utility: Main-level laundry; Washer and dryer; Gas water heater
Neighborhood map
What this means for you Summary
Snapshot
- This is a 3-bed/2.0-bath manufactured listed at $145k. Condition is rated good.
Deal economics
- At list price, monthly cash flow is $248 ($3k/yr) — positive.
- The deal already cash-flows at list — no discount required.
- Meets the 1% rule at list price ($2k rent vs $145k).
- Recommended offer: $143k (1.5% below list) — sets the bar for market timing.
Location & tenants
- Location reads 60/100 on livability (#956 in NY) — a middle-class / working-renter tenant base. Strengths: cost of living A+, housing A+; Watch: schools F, crime F, amenities F.
- Niagara-Wheatfield Central School District (rural): math 64% / reading 70% proficiency, ranked #163 of 590 in NY (top 28%) — acceptable for families but not a draw, mixed tenant base, ~2y average lease.
- Market conditions: 142 active listings in the ZIP; 167 units permitted in Niagara County in 2024 (0 in 5+ unit buildings).
Forward outlook
- Local home prices are declining (-3.0%/yr); year-one equity from $1k of loan paydown is wiped out by about $4k of value loss. Plan a longer hold.
- Niagara County population projected at -19% by 2050 — secular population decline; favor cash flow + early exit over multi-decade hold.
Negotiation context
- It's been on market 18 days — a 2% lower offer ($143k) is reasonable based on typical stale-listing flexibility.
Questions for the listing agent
- Is there a deadline driving the sale (1031 exchange, divorce, estate, relocation)? That informs how much negotiation room exists.
- Schools are F-rated, which usually means shorter tenancies and higher turnover. Who's the typical renter profile here, and what's been the actual vacancy rate?
- Crime grade is F in this area — have there been break-ins, vandalism, or insurance claims at this property in the last 3 years? What carrier currently insures it and at what premium?
- What's the average days-on-market for RENTAL listings here right now (not sales)? A rising rental-DOM trend means longer vacancies and softer asking-rent achievability than the comps imply.
- What's the recent tenant-quality profile in this submarket — average credit score on applications, eviction rate, late-payment / NSF rate, and stable-employment percentage? A property-management company in the area should have these aggregated.
- How much new for-sale + rental construction is in the pipeline within 1–3 miles? Heavy new supply typically softens prices + rents 12–24 months out; constrained supply supports both.
Investment metrics
- 1% rule
- 1.09% ✓
- Cap rate
- 8.35%
- Cash-on-cash
- 7.34%
- DSCR
- 1.33
- GRM
- 7.6
CMA / ARV
- ARV (on-the-fly)
- $119,392
- Comps found
- 5
Show comp detail 5 sales within ~0.75 mi
| Address | Dist | Beds/Ba | Sqft | Sold | Price | $/sf | Match |
|---|---|---|---|---|---|---|---|
| 4237 Mohawk Pkwy | 0.08mi | 3/2.0 | 1,493 (+2%) | 4mo | $100,000 | $67 | 89 |
| 4023 Seneca Pkwy | 0.06mi | 3/2.0 | 1,456 (0%) | 11mo | $115,800 | $80 | 88 |
| 4408 Hurontario Trl | 0.10mi | 3/2.0 | 1,501 (+3%) | 10mo | $155,000 | $103 | 81 |
| 4315 Hurontario Pkwy #00000 | 0.06mi | 3/2.0 | 1,456 (0%) | 21mo | $159,900 | $110 | 80 |
| 4410 Hurontario Trl | 0.10mi | 3/2.0 | 1,456 (0%) | 20mo | $120,000 | $82 | 79 |
Match score weights: distance 35% · size 25% · config 20% · recency 20%. Top-matched comps best support the ARV.
Projected returns pro-forma
-3.0% appreciation · 3.0% rent growth · sell at horizon
- IRR
- -5.1%
- Equity multiple
- 0.81×
- Total profit
- $-7,662
- Equity at exit
- $21,620
- IRR
- 4.6%
- Equity multiple
- 1.34×
- Total profit
- $13,784
- Equity at exit
- $12,537
Cash invested: $40,600 (down + closing). Projections, not guarantees.
Landlord ↔ Tenant lean methodology
- Overall (STATE)
- 15 Strongly Tenant-Friendly
- State New York
- 15 Strongly Tenant-Friendly · D+10
- County
- — inherits STATE
- City
- — inherits STATE
ZIP-level market 14304
- Active inventory
- 142
- Price-to-rent
- 7.6×
Monthly cashflow live
- Estimated rent
- $1,583 medium interval (Pro) →
- Mortgage (P&I)
- −$760
- Tax est. 1.5%
- −$181 /mo · $2,175/yr
- Insurance
- −$60
- HOA
- −$0
- Vacancy / Maint / Mgmt
- −$332
- Net cashflow
- $248
Break-even live
UW: 25.0% down · 7.5% · 30yr · 1.5% tax · 5.0% vac · 8.0% maint · 8.0% mgmt
Financing live
Cash to close
- Down payment
- $36,250
- Closing costs
- $4,350
- Reserves months
- —
- Total cash needed
- —
Loan-product check · same deal, 3 products live
Conventional
25% down · 7.5% · 30yr
- Down + closing
- —
- Monthly P&I
- —
- Monthly cashflow
- —
- DSCR
- —
- Eligible?
- —
Personal DTI + credit; lowest rate.
DSCR
20% down · 8.5% · 30yr
- Down + closing
- —
- Monthly P&I
- —
- Monthly cashflow
- —
- DSCR
- —
- Eligible?
- —
No personal income docs; deal must DSCR.
Hard money
10% down · 12.0% · 12mo
- Down + closing
- —
- Monthly P&I
- —
- Monthly cashflow
- —
- DSCR
- —
- Eligible?
- —
Short-term bridge; refi at stabilization.
Listing history 14 events
-
2026-06-18price $145,000 Active 18 DOM
-
2026-06-18days on market $149,000 Active 18 DOM
-
2026-06-17days on market $149,000 Active 17 DOM
-
2026-06-16days on market $149,000 Active 16 DOM
-
2026-06-15days on market $149,000 Active 15 DOM
-
2026-06-13pricedays on market $149,000 Active 13 DOM
-
2026-06-10days on market $154,000 Active 10 DOM
-
2026-06-09days on market $154,000 Active 9 DOM
-
2026-06-08days on market $154,000 Active 8 DOM
-
2026-06-07days on market $154,000 Active 7 DOM
-
2026-06-03days on market $154,000 Active 3 DOM
-
2026-06-02days on market $154,000 Active 2 DOM
-
2026-05-31remarks 699-char remark
-
2026-05-31$154,000 Active 1 DOM
ⓘ Source: listings_history table (triggers on properties + properties_extension) + one-shot
backfill from property_details.listing_events for pre-trigger history.
Climate risk First Street
- Flood 1/10 Low FEMA zone X (unshaded) · 0% chance over 30 yrs
- Wildfire 1/10 Low
- Heat 3/10 Moderate 7 d/yr ≥95°F today · 14 d/yr by 30 yrs out
- Wind 1/10 Low
- Air quality 3/10 Moderate 2 unhealthy d/yr today · 4 by 30 yrs out
Nearby sold comps map
Loading sold comps map…
Walkable amenities ~0.75 mi
Loading nearby amenities…
Taxation est. · year 1
- Rental income
- $18,992
- − Mortgage interest
- −$8,122
- − Property taxes
- −$2,175
- − Insurance
- −$725
- − Repairs & maintenance
- −$1,519
- − Management
- −$1,519
- − Depreciation
- −$4,218
- Taxable income
- $713
- Est. tax owed @ 24.0%
- −$171
- After-tax cash flow
- $2,808/yr
For passive investors: Depreciation is non-cash, so a rental often shows a tax loss while cash-flowing — sheltering income. Rental losses are passive: they offset passive income freely, and up to $25,000/yr can offset ordinary (W-2) income if you actively participate and your MAGI is under $100k (phasing out to $0 by $150k); unused losses carry forward. On sale, claimed depreciation is recaptured at up to 25%, and gains may owe capital-gains tax (a 1031 exchange can defer both). Figures are a year-1 estimate at your 24.0% rate — not tax advice; consult a CPA.
Condition & rehab AI · 1 photo
This beautifully maintained 2021 manufactured home in Tuscarora Village is move-in ready with modern comfort and a walkable community. It offers a spacious layout, granite countertops, and a well-maintained exterior.
Value-add opportunities
- Both Painting exterior and interior walls — Fresh paint enhances curb appeal and interior aesthetics.
- Both Landscaping improvements — Enhances curb appeal and adds value for both resale and rental.
- Both New flooring in bathrooms — Fresh flooring improves aesthetics and adds value for both resale and rental.
Renovation cost estimate screening
Value-add ROI direction
- Both Painting exterior and interior walls — Fresh paint enhances curb appeal and interior aesthetics. ↑
- Both Landscaping improvements — Enhances curb appeal and adds value for both resale and rental. ↑
- Both New flooring in bathrooms — Fresh flooring improves aesthetics and adds value for both resale and rental. ↑
ⓘ Cost ranges are severity-bucket heuristics (US national rule-of-thumb). Get contractor quotes + a written scope before underwriting a rehab budget.
Schools (NCES district)
- District
- Niagara-Wheatfield Central School District
- NCES district ID
- 3620850
- Math proficiency
- 64% ▼ -1.00%
- Reading proficiency
- 70% ▲ 10.00%
- Median HH income
- $57,051
- Composite
- 57.53/100
- National rank
- #1067
- State rank
- #163 of 590 in NY
Livability — Niagara Falls
- Score
- 60/100
- State rank
- #956
- US rank
- #18749
Category grades
Schools grade is shown separately in the Schools card above.
Census & demographics
- County
- Niagara County · 157,377 people
- City population
- 62,983
- Metro
- Buffalo-Cheektowaga, NY
- Population (ZIP)
- 29,208
- Household income
- $66,660
- Rent vs Own
- Severe rent burden
- 698.0
Population outlook (Niagara County) Hauer SSP2
- Today (2025)
- 204,149 people
- By 2030
- 197,900 · -3.1%
- By 2040
- 182,239 · -10.7%
- By 2050
- 165,198 · -19.1%
- By 2075
- 129,416 · -36.6%
- By 2100
- 96,222 · -52.9%
Race, ethnicity, and origin ACS 2023
- Neighborhood character
- Predominantly White (85%)
- Race & ethnicity
- White 85% Two or more races 6% Hispanic / Latino 4% Black 3% Asian 2%
- Common ancestry
- Romanian 10% Lithuanian 3% Slovak 2%
- Foreign-born
- 3% · Canada, China, Vietnam
- Languages at home
- 93% English-only · Spanish 3% Other Indo-European 1% Russian/Polish/Slavic 1%
Political lean MEDSL · Niagara
- 2024 margin
- R (+14.9) · D 42.5% · R 57.5%
- 2008→2024 swing
- -15.9pp toward R · 2008: 1.0pp · 2024: -14.9pp
- All cycles
- 2024: R+14.9 2020: R+9.7 2016: R+19.0 2012: D+0.6 2008: D+1.0
Not yet ingested
- Civics
- —
Market trends
- HPI YoY
- ▼ -231.77%
- Current HPI
- 280.3295
- Rent YoY
- —
- Metro
- Buffalo-Cheektowaga, NY
- State GDP YoY
- ▲ 2.60%
- F500 in state
- 92
Industry mix (Fortune 500 HQ in NY)
| Industry | F500 HQs | Revenue |
|---|---|---|
| Financial Services | 10 | $950B |
|
||
| Consumer Goods | 9 | $162B |
|
||
| Insurance | 4 | $225B |
|
||
| Telecommunications | 2 | $144B |
|
||
| Pharmaceuticals | 2 | $112B |
|
||
| Media / Entertainment | 2 | $69B |
|
||
Price history
1 event — show timeline
- 2026-05-30 Listed $154,000 WNYREIS
Cash-flow waterfall
monthlySold comps — $/sqft
last 12 mo · ≤1 miLoading sold comps…