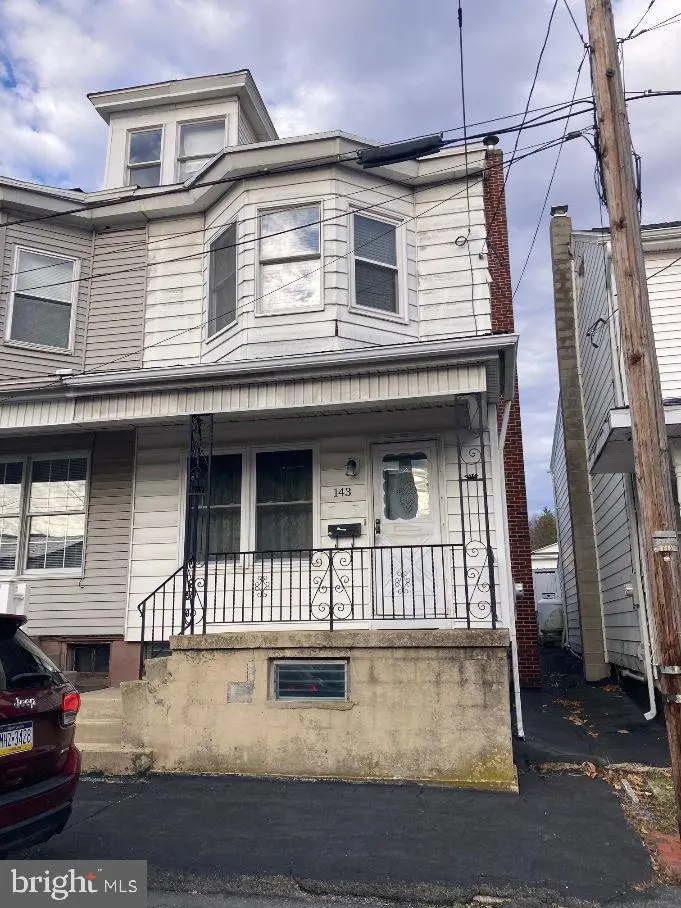
143 N Railroad Ave · Frackville, PA
Flood risk 1/10 · Minimal
- FEMA flood zone
- X (unshaded)
- Chance of flooding over 30 yrs
- 0.0%
- Est. flood insurance / yr
- $473 – $860
Fire risk 1/10 · Minimal
- Est. fire insurance / yr
- $511 – $949
Heat risk 3/10 · Minor
- Hot days now (above 92°F)
- 7 days/yr
- Hot days in 30 yrs
- 15 days/yr
Wind risk 4/10 · Minor
- Chance of severe wind over 30 yrs
- 8.0%
Air-quality risk 2/10 · Minimal
- Unhealthy air days now
- 1 days/yr
- Unhealthy air days in 30 yrs
- 1 days/yr
Risk factors via First Street. Map © Google.
Why this score? — see what drove the B grade
The composite is a weighted blend of 9 inputs, each scored 0–100. Each bar is that input's sub-score; the figure is the points it added to the 100-point composite (weight × sub-score).
- Cash flow +28.2/30.0
- ARV discount +15.0/15.0
- DSCR +10.0/10.0
- 1% rule +8.3/10.0
- Livability +3.8/5.0
- Schools +2.8/10.0
- Rent growth +2.5/5.0
- Condition / age +2.5/5.0
- Appreciation +0.0/10.0
$89,500
🖨 Deal sheet 📄 Offer letter ✓ Due diligence
Listing remarks MLS
PRICE REDUCTION! Solid semi detached in need of some updating, but move-in condition, just waiting for that new owner to bring it back to life. Beautiful colonnades between open livingroom diningroom area. All great room sizes. Fenced yard. Attic is finished and was used as additional bedroom. This home has greater potential, and its affordable!
Key facts
- Built 1920
- Listed 69 days
Neighborhood map
What this means for you Summary
Snapshot
- This is a 3-bed/1.0-bath townhouse listed at $90k.
Deal economics
- At list price, monthly cash flow is $284 ($3k/yr) — positive.
- The deal already cash-flows at list — no discount required.
- Meets the 1% rule at list price ($1k rent vs $90k).
- Recommended offer: $84k (6.0% below list) — sets the bar for market timing.
Location & tenants
- Location reads 75/100 on livability (#424 in PA, #3,873 nationally) — a middle-class / working-renter tenant base. Strengths: crime A+, cost of living A+, housing A+; Watch: schools D, amenities D, commute F.
- North Schuylkill SD (rural): math 19% / reading 48% proficiency, ranked #429 of 539 in PA (top 80%) — families likely to look elsewhere, expect single-tenant / working-renter base with shorter leases.
- Market conditions: 31 active listings in the ZIP; 169 units permitted in Schuylkill County in 2024 (0 in 5+ unit buildings).
Forward outlook
- Local home prices are declining (-3.0%/yr); year-one equity from $619 of loan paydown is wiped out by about $3k of value loss. Plan a longer hold.
- Schuylkill County population projected at -16% by 2050 — secular population decline; favor cash flow + early exit over multi-decade hold.
- At projected returns (-3.0% appreciation + 3.0% rent growth), your $25k cash investment doubles in ~9 years — after that, you're playing with house money.
Negotiation context
- It's been on market 70 days — a 6% lower offer ($84k) is reasonable based on typical stale-listing flexibility.
Risks & watch-outs
- Watch-outs: built in 1920 — expect roof / HVAC / electrical / plumbing capex.
Questions for the listing agent
- It's been on market 70 days. Have you received any prior offers? Is the seller open to a 6% concession, seller financing, or rate buy-down credit?
- Built in 1920 — when were the roof, HVAC, electrical panel, plumbing, and water heater last replaced?
- Why hasn't it sold? Are there any deal-killer items the seller is aware of (foundation, flood, title, zoning, code violations)?
- Is there a deadline driving the sale (1031 exchange, divorce, estate, relocation)? That informs how much negotiation room exists.
- Schools are D-rated, which usually means shorter tenancies and higher turnover. Who's the typical renter profile here, and what's been the actual vacancy rate?
- What's the average days-on-market for RENTAL listings here right now (not sales)? A rising rental-DOM trend means longer vacancies and softer asking-rent achievability than the comps imply.
- What's the recent tenant-quality profile in this submarket — average credit score on applications, eviction rate, late-payment / NSF rate, and stable-employment percentage? A property-management company in the area should have these aggregated.
- How much new for-sale + rental construction is in the pipeline within 1–3 miles? Heavy new supply typically softens prices + rents 12–24 months out; constrained supply supports both.
Investment metrics
- 1% rule
- 1.33% ✓
- Cap rate
- 10.10%
- Cash-on-cash
- 13.61%
- DSCR
- 1.61
- GRM
- 6.3
CMA / ARV
- ARV (median comp)
- $108,302
- List price
- $89,500
- Delta
- -17.36%
- Verdict
- UNDERPRICED
- Comps
- 20 within 1.0 mi
Show comp detail 12 sales within ~0.75 mi
| Address | Dist | Beds/Ba | Sqft | Sold | Price | $/sf | Match |
|---|---|---|---|---|---|---|---|
| 337 W Pine St | 0.38mi | 3/1.0 | 1,520 (+6%) | 2mo | $101,000 | $66 | 71 |
| 414 W Washington St | 0.44mi | 4/1.0 (+1) | 1,439 (-0%) | 5mo | $95,000 | $66 | 70 |
| 341 S Broad Mountain Ave | 0.56mi | 3/1.0 | 1,385 (-4%) | 2mo | $140,000 | $101 | 66 |
| 113 N 2nd St | 0.38mi | 4/1.0 (+1) | 1,344 (-7%) | 2mo | $65,000 | $48 | 65 |
| 134 S Middle | 0.35mi | 3/2.0 | 1,336 (-7%) | 4mo | $125,000 | $94 | 65 |
| 138 S 2nd St | 0.53mi | 4/1.0 (+1) | 1,390 (-4%) | 6mo | $180,000 | $129 | 60 |
| 220 W High St | 0.33mi | 3/2.5 | 1,593 (+11%) | 3mo | $230,000 | $144 | 58 |
| 339 S Lehigh Ave | 0.57mi | 4/1.0 (+1) | 1,526 (+6%) | 5mo | $85,000 | $56 | 54 |
| 120 E Chestnut St | 0.40mi | 4/2.0 (+1) | 1,610 (+12%) | 2mo | $170,000 | $106 | 51 |
| 104 S 4th St | 0.64mi | 3/1.0 | 1,236 (-14%) | 4mo | $125,000 | $101 | 43 |
| 134 North Sixth St Unit BUTLER TWP | 0.70mi | 3/1.0 | 1,276 (-11%) | 7mo | $148,000 | $116 | 43 |
| 39 S Center St | 0.40mi | 4/2.0 (+1) | 1,650 (+15%) | 7mo | $150,000 | $91 | 42 |
Match score weights: distance 35% · size 25% · config 20% · recency 20%. Top-matched comps best support the ARV.
Projected returns pro-forma
-3.0% appreciation · 3.0% rent growth · sell at horizon
- IRR
- 3.8%
- Equity multiple
- 1.15×
- Total profit
- $3,639
- Equity at exit
- $13,345
- IRR
- 13.3%
- Equity multiple
- 2.06×
- Total profit
- $26,643
- Equity at exit
- $7,738
Cash invested: $25,060 (down + closing). Projections, not guarantees.
Landlord ↔ Tenant lean methodology
- Overall (STATE)
- 62 Landlord-Friendly
- State Pennsylvania
- 62 Landlord-Friendly · EVEN
- County
- — inherits STATE
- City
- — inherits STATE
ZIP-level market 17931
- Home prices YoY
- -22.6%
- Active inventory
- 31
- Price-to-rent
- 6.3×
Monthly cashflow live
- Estimated rent
- $1,191 medium interval (Pro) →
- Mortgage (P&I)
- −$469
- Tax from tax record
- −$150 /mo · $1,797/yr
- Insurance
- −$37
- HOA
- −$0
- Vacancy / Maint / Mgmt
- −$250
- Net cashflow
- $284
Break-even live
UW: 25.0% down · 7.5% · 30yr · 1.5% tax · 5.0% vac · 8.0% maint · 8.0% mgmt
Financing live
Cash to close
- Down payment
- $22,375
- Closing costs
- $2,685
- Reserves months
- —
- Total cash needed
- —
Loan-product check · same deal, 3 products live
Conventional
25% down · 7.5% · 30yr
- Down + closing
- —
- Monthly P&I
- —
- Monthly cashflow
- —
- DSCR
- —
- Eligible?
- —
Personal DTI + credit; lowest rate.
DSCR
20% down · 8.5% · 30yr
- Down + closing
- —
- Monthly P&I
- —
- Monthly cashflow
- —
- DSCR
- —
- Eligible?
- —
No personal income docs; deal must DSCR.
Hard money
10% down · 12.0% · 12mo
- Down + closing
- —
- Monthly P&I
- —
- Monthly cashflow
- —
- DSCR
- —
- Eligible?
- —
Short-term bridge; refi at stabilization.
Listing history 18 events
-
2026-06-19days on market $89,500 Active 70 DOM
-
2026-06-18days on market $89,500 Active 69 DOM
-
2026-06-17days on market $89,500 Active 68 DOM
-
2026-06-16days on market $89,500 Active 67 DOM
-
2026-06-15days on market $89,500 Active 66 DOM
-
2026-06-14days on market $89,500 Active 64 DOM
-
2026-06-12days on market $89,500 Active 63 DOM
-
2026-06-09pricedays on market $89,500 Active 60 DOM
-
2026-06-08days on market $95,000 Active 59 DOM
-
2026-06-07days on market $95,000 Active 58 DOM
-
2026-06-07days on market $95,000 Active 57 DOM
-
2026-06-04days on market $95,000 Active 54 DOM
-
2026-06-02days on market $95,000 Active 53 DOM
-
2026-06-01days on market $95,000 Active 52 DOM
-
2026-05-31days on market $95,000 Active 51 DOM
-
2026-05-31days on market $95,000 Active 50 DOM
-
2026-05-04price $95,000 348-char remark
Show marketing remark (348 chars)
PRICE REDUCTION! Solid semi detached in need of some updating, but move-in condition, just waiting for that new owner to bring it back to life. Beautiful colonnades between open livingroom diningroom area. All great room sizes. Fenced yard. Attic is finished and was used as additional bedroom. This home has greater potential, and its affordable!
-
2026-04-10$105,000 Active 348-char remark
Show marketing remark (348 chars)
PRICE REDUCTION! Solid semi detached in need of some updating, but move-in condition, just waiting for that new owner to bring it back to life. Beautiful colonnades between open livingroom diningroom area. All great room sizes. Fenced yard. Attic is finished and was used as additional bedroom. This home has greater potential, and its affordable!
ⓘ Source: listings_history table (triggers on properties + properties_extension) + one-shot
backfill from property_details.listing_events for pre-trigger history.
Tax reassessment forecast PA · Partial reset (capped growth)
- Current annual tax
- $1,797 · $150/mo
- Projected year-2 tax
- $1,797 · $150/mo
- Expected delta
- $0/yr ($0/mo · 0.0%)
ⓘ Screening estimate from a state-policy table — verify with the county assessor before closing.
Climate risk First Street
- Flood 1/10 Low FEMA zone X (unshaded) · 0% chance over 30 yrs
- Wildfire 1/10 Low
- Heat 3/10 Moderate 7 d/yr ≥92°F today · 15 d/yr by 30 yrs out
- Wind 4/10 Moderate 8% chance of damaging wind over 30 yrs
- Air quality 2/10 Low 1 unhealthy d/yr today · 1 by 30 yrs out
Nearby sold comps map
Loading sold comps map…
Walkable amenities ~0.75 mi
Loading nearby amenities…
Taxation est. · year 1
- Rental income
- $14,287
- − Mortgage interest
- −$5,013
- − Property taxes
- −$1,797
- − Insurance
- −$448
- − Repairs & maintenance
- −$1,143
- − Management
- −$1,143
- − Depreciation
- −$2,604
- Taxable income
- $2,140
- Est. tax owed @ 24.0%
- −$514
- After-tax cash flow
- $2,897/yr
For passive investors: Depreciation is non-cash, so a rental often shows a tax loss while cash-flowing — sheltering income. Rental losses are passive: they offset passive income freely, and up to $25,000/yr can offset ordinary (W-2) income if you actively participate and your MAGI is under $100k (phasing out to $0 by $150k); unused losses carry forward. On sale, claimed depreciation is recaptured at up to 25%, and gains may owe capital-gains tax (a 1031 exchange can defer both). Figures are a year-1 estimate at your 24.0% rate — not tax advice; consult a CPA.
Schools (NCES district)
- District
- North Schuylkill SD
- NCES district ID
- 4210110
- Math proficiency
- 19% ▼ -14.00%
- Reading proficiency
- 48% ▼ -8.00%
- Median HH income
- $43,529
- Composite
- 28.37/100
- National rank
- #6770
- State rank
- #429 of 539 in PA
Livability — Frackville
- Score
- 75/100
- State rank
- #424
- US rank
- #3873
Category grades
Schools grade is shown separately in the Schools card above.
Census & demographics
- Census place
- Frackville, PA
- Population (ZIP)
- 8,726
Population outlook (Schuylkill County) Hauer SSP2
- Today (2025)
- 137,447 people
- By 2030
- 133,121 · -3.1%
- By 2040
- 124,172 · -9.7%
- By 2050
- 115,611 · -15.9%
- By 2075
- 100,796 · -26.7%
- By 2100
- 86,667 · -36.9%
Race, ethnicity, and origin ACS 2023
- Neighborhood character
- Predominantly White (66%)
- Race & ethnicity
- White 66% Black 23% Hispanic / Latino 9% Two or more races 5%
- Hispanic origin (detail)
- Puerto Rican 4% Dominican 2%
- Common ancestry
- Romanian 10% Iranian 3% Subsaharan African 3%
- Foreign-born
- 1%
- Languages at home
- 91% English-only · Spanish 6% Russian/Polish/Slavic 1% Korean 1%
Political lean MEDSL · Schuylkill
- 2024 margin
- Solid R (+42.1) · D 28.5% · R 70.6%
- 2008→2024 swing
- -33.4pp toward R · 2008: -8.7pp · 2024: -42.1pp
- All cycles
- 2024: R+42.1 2020: R+39.9 2016: R+43.4 2012: R+13.4 2008: R+8.7
Not yet ingested
- Civics
- —
Market trends
- HPI YoY
- ▼ -48.47%
- Current HPI
- 165.7692
- Rent YoY
- —
- Metro
- —
- State GDP YoY
- ▲ 1.68%
- F500 in state
- 34
Industry mix (Fortune 500 HQ in PA)
| Industry | F500 HQs | Revenue |
|---|---|---|
| Healthcare | 2 | $309B |
|
||
| Insurance | 2 | $27B |
|
||
| Telecommunications / Media | 1 | $124B |
|
||
| Industrial Distribution | 1 | $22B |
|
||
| Financial Services | 1 | $20B |
|
||
| Chemicals / Materials | 1 | $18B |
|
||
Price history
-9.5% since first listed2 events — show timeline
- 2026-05-04 Price Changed $95,000 BRIGHT MLS
- 2026-04-10 Listed $105,000 BRIGHT MLS
Property tax history
+2.8%/yrLatest (2025): $1,797 · +8.2% YoY. Source: county tax records.
Cash-flow waterfall
monthlySold comps — $/sqft
last 12 mo · ≤1 miLoading sold comps…