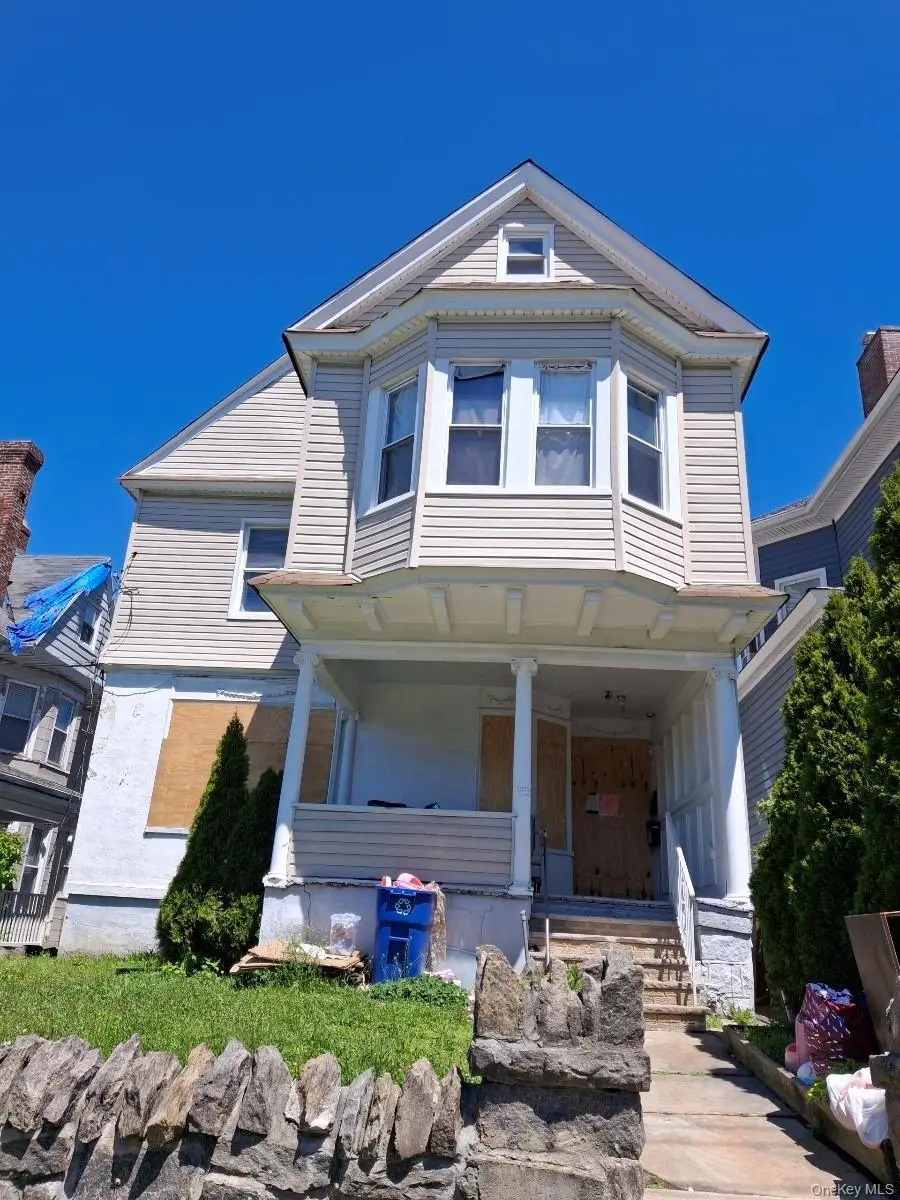
157 Glenwood Ave · Yonkers, NY
Flood risk 1/10 · Minimal
- FEMA flood zone
- X (unshaded)
- Chance of flooding over 30 yrs
- 0.0%
- Est. flood insurance / yr
- $473 – $860
Fire risk 1/10 · Minimal
- Est. fire insurance / yr
- $691 – $1,283
Heat risk 6/10 · Moderate
- Hot days now (above 99°F)
- 7 days/yr
- Hot days in 30 yrs
- 15 days/yr
Wind risk 6/10 · Moderate
- Chance of severe wind over 30 yrs
- 27.0%
Air-quality risk 3/10 · Minor
- Unhealthy air days now
- 3 days/yr
- Unhealthy air days in 30 yrs
- 4 days/yr
Risk factors via First Street. Map © Google.
Why this score? — see what drove the B- grade
The composite is a weighted blend of 9 inputs, each scored 0–100. Each bar is that input's sub-score; the figure is the points it added to the 100-point composite (weight × sub-score).
- Cash flow +24.9/30.0
- ARV discount +15.0/15.0
- DSCR +8.1/10.0
- 1% rule +5.3/10.0
- Schools +4.1/10.0
- Livability +3.4/5.0
- Rent growth +2.5/5.0
- Condition / age +2.5/5.0
- Appreciation +0.0/10.0
$389,000
🖨 Deal sheet 📄 Offer letter ✓ Due diligence
Listing remarks
Short sale, Subject to bank approval.
Key facts
- 3,500 sq ft lot
- Built 1897
- Listed 45 days
Property features AI
Exterior
- Parking: On-street parking
- Utilities: Public sewer; Electricity available
- Home design: Single-family residence; Living area reported from public records
- Construction: Stone construction
- Exterior features: Stone exterior; Not waterfront
Interior
- Kitchen: Refrigerator included
- Bedrooms: Rooms total: 15 (includes bedroom count and other rooms)
- Bathrooms: 3 full bathrooms
- Heating & cooling: Baseboard heating; Natural gas heating; No central cooling
- Interior features: First-floor bedroom; Full basement with walk-out access; Attic: none
- Laundry & utility: Utilities: electricity available
Neighborhood map
What this means for you Summary
Snapshot
- This is a 6-bed/3.0-bath single-family listed at $389k.
Deal economics
- At list price, monthly cash flow is $840 ($10k/yr) — positive.
- The deal already cash-flows at list — no discount required.
- Meets the 1% rule at list price ($4k rent vs $389k).
- Recommended offer: $377k (3.0% below list) — sets the bar for market timing.
- Cap rate 8.9% vs local median 5.3% in Yonkers — top-decile yield for the area; either an underpriced asset or a hidden risk that comps aren't pricing in. Stress-test before assuming the spread holds.
Location & tenants
- Location reads 68/100 on livability (#528 in NY) — a middle-class / working-renter tenant base. Strengths: employment A, commute B; Watch: amenities F, cost of living F.
- Yonkers City School District (suburban): math 41% / reading 54% proficiency, ranked #413 of 590 in NY (top 70%) — families likely to look elsewhere, expect single-tenant / working-renter base with shorter leases; 64% free/reduced lunch — lower-income household profile, screen leases tightly.
- Zoned schools: Yonkers Early Childhood Academy (327 students, 72% FRL); Yonkers Middle School (math 17% / reading 37%, grade F, #587 of 729 statewide, top 81%, 601 students, 88% FRL); Yonkers High School (math 92% / reading 88%, grade A+, #238 of 1,100 statewide, top 23%, 1,060 students, 76% FRL) — zoned schools average 79% FRL vs 64% district-wide (15 pts higher); higher-poverty schools than district average — tighter screening recommended.
- Market conditions: 141 active listings in the ZIP; 954 units permitted in Westchester County in 2024 (649 in 5+ unit buildings).
- At $4,022/mo this rent would consume 92% of the median local household income ($52k/yr) (locally 3913% of renters already pay >50% of income on rent) — very limited rent-growth headroom before tenants either downsize or default.
Forward outlook
- Local home prices are declining (-3.0%/yr); year-one equity from $3k of loan paydown is wiped out by about $12k of value loss. Plan a longer hold.
- Westchester County population projected at +10% by 2050 — modest demand growth; plan on rents tracking national, not racing it.
Negotiation context
- It's been on market 45 days — a 3% lower offer ($377k) is reasonable based on typical stale-listing flexibility.
- 11 sale attempts since 20y ago with the ask held roughly flat each time — persistent listings suggest the price (not the market) is what's stuck; bring a comps-based counter.
Risks & watch-outs
- Watch-outs: built in 1897 — expect roof / HVAC / electrical / plumbing capex.
- Climate carrying-cost: major wind risk, 27% chance of damaging wind over 30y; extreme-heat days projected 7→15/yr by 2055 (HVAC capex compounding) — expect insurance premiums to compound above CPI over the hold.
Questions for the listing agent
- It's been on market 45 days. Have you received any prior offers? Is the seller open to a 3% concession, seller financing, or rate buy-down credit?
- Built in 1897 — when were the roof, HVAC, electrical panel, plumbing, and water heater last replaced?
- Is there a deadline driving the sale (1031 exchange, divorce, estate, relocation)? That informs how much negotiation room exists.
- What's the average days-on-market for RENTAL listings here right now (not sales)? A rising rental-DOM trend means longer vacancies and softer asking-rent achievability than the comps imply.
- What's the recent tenant-quality profile in this submarket — average credit score on applications, eviction rate, late-payment / NSF rate, and stable-employment percentage? A property-management company in the area should have these aggregated.
- How much new for-sale + rental construction is in the pipeline within 1–3 miles? Heavy new supply typically softens prices + rents 12–24 months out; constrained supply supports both.
Investment metrics
- 1% rule
- 1.03% ✓
- Cap rate
- 8.89%
- Cash-on-cash
- 9.26%
- DSCR
- 1.41
- GRM
- 8.1
CMA / ARV
- ARV (on-the-fly)
- $738,342
- Comps found
- 2
Show comp detail 2 sales within ~0.75 mi
| Address | Dist | Beds/Ba | Sqft | Sold | Price | $/sf | Match |
|---|---|---|---|---|---|---|---|
| 16 Lamartine Ter | 0.32mi | 5/3.0 (-1) | 2,213 (+2%) | 22mo | $750,000 | $339 | 59 |
| 140 Amackassin Ter | 0.67mi | 5/2.5 (-1) | 2,310 (+6%) | 17mo | $700,000 | $303 | 38 |
Match score weights: distance 35% · size 25% · config 20% · recency 20%. Top-matched comps best support the ARV.
Projected returns pro-forma
-3.0% appreciation · 3.0% rent growth · sell at horizon
- IRR
- -2.4%
- Equity multiple
- 0.91×
- Total profit
- $-9,672
- Equity at exit
- $58,001
- IRR
- 7.3%
- Equity multiple
- 1.55×
- Total profit
- $59,860
- Equity at exit
- $33,634
Cash invested: $108,920 (down + closing). Projections, not guarantees.
Landlord ↔ Tenant lean methodology
- Overall (CITY)
- 5 Strongly Tenant-Friendly
- State New York
- 15 Strongly Tenant-Friendly · D+10
- County
- — inherits STATE
- City Yonkers
- 5 Strongly Tenant-Friendly · D+20
ZIP-level market 10473
- Active inventory
- 141
- Price-to-rent
- 8.1×
Monthly cashflow live
- Estimated rent
- $4,022 medium interval (Pro) →
- Mortgage (P&I)
- −$2,040
- Tax from tax record
- −$135 /mo · $1,621/yr
- Insurance
- −$162
- HOA
- −$0
- Vacancy / Maint / Mgmt
- −$845
- Net cashflow
- $840
Break-even live
UW: 25.0% down · 7.5% · 30yr · 1.5% tax · 5.0% vac · 8.0% maint · 8.0% mgmt
Financing live
Cash to close
- Down payment
- $97,250
- Closing costs
- $11,670
- Reserves months
- —
- Total cash needed
- —
Loan-product check · same deal, 3 products live
Conventional
25% down · 7.5% · 30yr
- Down + closing
- —
- Monthly P&I
- —
- Monthly cashflow
- —
- DSCR
- —
- Eligible?
- —
Personal DTI + credit; lowest rate.
DSCR
20% down · 8.5% · 30yr
- Down + closing
- —
- Monthly P&I
- —
- Monthly cashflow
- —
- DSCR
- —
- Eligible?
- —
No personal income docs; deal must DSCR.
Hard money
10% down · 12.0% · 12mo
- Down + closing
- —
- Monthly P&I
- —
- Monthly cashflow
- —
- DSCR
- —
- Eligible?
- —
Short-term bridge; refi at stabilization.
Listing history 6 events
-
2026-06-18days on market $389,000 Active 45 DOM
-
2026-06-17days on market $389,000 Active 44 DOM
-
2026-06-16days on market $389,000 Active 43 DOM
-
2026-06-15days on market $389,000 Active 42 DOM
-
2026-06-13remarks 37-char remark
-
2026-06-13$389,000 Active 40 DOM
ⓘ Source: listings_history table (triggers on properties + properties_extension) + one-shot
backfill from property_details.listing_events for pre-trigger history.
Tax reassessment forecast NY · Partial reset (capped growth)
- Current annual tax
- $1,621 · $135/mo
- Projected year-2 tax
- $4,098 · $341/mo
- Expected delta
- +$2,476/yr (+$206/mo · 152.7%)
ⓘ Screening estimate from a state-policy table — verify with the county assessor before closing.
Climate risk First Street
- Flood 1/10 Low FEMA zone X (unshaded) · 0% chance over 30 yrs
- Wildfire 1/10 Low
- Heat 6/10 Major 7 d/yr ≥99°F today · 15 d/yr by 30 yrs out
- Wind 6/10 Major 27% chance of damaging wind over 30 yrs
- Air quality 3/10 Moderate 3 unhealthy d/yr today · 4 by 30 yrs out
Nearby sold comps map
Loading sold comps map…
Walkable amenities ~0.75 mi
Loading nearby amenities…
Taxation est. · year 1
- Rental income
- $48,265
- − Mortgage interest
- −$21,790
- − Property taxes
- −$1,621
- − Insurance
- −$1,945
- − Repairs & maintenance
- −$3,861
- − Management
- −$3,861
- − Depreciation
- −$11,316
- Taxable income
- $3,870
- Est. tax owed @ 24.0%
- −$929
- After-tax cash flow
- $9,155/yr
For passive investors: Depreciation is non-cash, so a rental often shows a tax loss while cash-flowing — sheltering income. Rental losses are passive: they offset passive income freely, and up to $25,000/yr can offset ordinary (W-2) income if you actively participate and your MAGI is under $100k (phasing out to $0 by $150k); unused losses carry forward. On sale, claimed depreciation is recaptured at up to 25%, and gains may owe capital-gains tax (a 1031 exchange can defer both). Figures are a year-1 estimate at your 24.0% rate — not tax advice; consult a CPA.
Schools (NCES district)
- District
- Yonkers City School District
- NCES district ID
- 3631920
- Math proficiency
- 41% ▼ -1.00%
- Reading proficiency
- 54% ▲ 14.00%
- Median HH income
- $58,042
- Composite
- 41.43/100
- National rank
- #3471
- State rank
- #413 of 590 in NY
Livability — Yonkers
- Score
- 68/100
- State rank
- #528
- US rank
- #9394
Category grades
Schools grade is shown separately in the Schools card above.
Census & demographics
- Census place
- Yonkers, NY
- County
- Bronx County · 1,197,324 people
- City population
- 212,407
- Metro
- New York-Newark-Jersey City, NY-NJ-PA
- Population (ZIP)
- 58,855
- Household income
- $52,462
- Rent vs Own
- Severe rent burden
- 3913.0
Population outlook (Westchester County) Hauer SSP2
- Today (2025)
- 1,028,035 people
- By 2030
- 1,051,636 · +2.3%
- By 2040
- 1,098,520 · +6.9%
- By 2050
- 1,136,044 · +10.5%
- By 2075
- 1,196,925 · +16.4%
- By 2100
- 1,175,147 · +14.3%
Race, ethnicity, and origin ACS 2023
- Neighborhood character
- Majority Hispanic (59%)
- Race & ethnicity
- Hispanic / Latino 59% Black 34% Two or more races 12% Asian 2% White 2%
- Hispanic origin (detail)
- Puerto Rican 31% Dominican 20%
- Common ancestry
- British 1%
- Foreign-born
- 23% · Canada, Jamaica
- Languages at home
- 51% English-only · Spanish 45% Other Indo-European 1% French/Haitian/Cajun 1%
Political lean MEDSL · Westchester
- 2024 margin
- Strong D (+26.3) · D 63.1% · R 36.9%
- 2008→2024 swing
- -1.3pp toward R · 2008: 27.6pp · 2024: 26.3pp
- All cycles
- 2024: D+26.3 2020: D+36.3 2016: D+32.8 2012: D+22.2 2008: D+27.6
Not yet ingested
- Civics
- —
Market trends
- HPI YoY
- ▼ -212.70%
- Current HPI
- 276.2941
- Rent YoY
- —
- Metro
- New York-Newark-Jersey City, NY-NJ-PA
- State GDP YoY
- ▲ 2.60%
- F500 in state
- 92
Industry mix (Fortune 500 HQ in NY)
| Industry | F500 HQs | Revenue |
|---|---|---|
| Financial Services | 10 | $950B |
|
||
| Consumer Goods | 9 | $162B |
|
||
| Insurance | 4 | $225B |
|
||
| Telecommunications | 2 | $144B |
|
||
| Pharmaceuticals | 2 | $112B |
|
||
| Media / Entertainment | 2 | $69B |
|
||
Price history
+143.1% since first listed45 events — show timeline
- 2026-05-04 Listed $389,000 OneKey® MLS as Distributed by MLS Grid
- 2018-05-07 Sold (Public Records) $465,000 Public Records
- 2017-12-29 Listing Removed — OneKey® MLS as Distributed by MLS Grid
- 2017-12-06 Contingent — OneKey® MLS as Distributed by MLS Grid
- 2017-10-24 Listing Removed — OneKey® MLS as Distributed by MLS Grid
- 2017-10-24 Price Changed $458,000 OneKey® MLS as Distributed by MLS Grid
- 2017-10-24 Listed $458,000 OneKey® MLS as Distributed by MLS Grid
- 2017-09-25 Relisted — OneKey® MLS as Distributed by MLS Grid
- 2017-08-20 Listing Removed — OneKey® MLS as Distributed by MLS Grid
- 2017-07-11 Price Changed $459,000 OneKey® MLS as Distributed by MLS Grid
- 2017-07-11 Relisted — OneKey® MLS as Distributed by MLS Grid
- 2017-05-19 Contingent — OneKey® MLS as Distributed by MLS Grid
- 2017-02-01 Price Changed $475,000 OneKey® MLS as Distributed by MLS Grid
- 2017-01-03 Price Changed $459,000 OneKey® MLS as Distributed by MLS Grid
- 2016-12-20 Price Changed $469,000 OneKey® MLS as Distributed by MLS Grid
- 2016-11-07 Listed $479,000 OneKey® MLS as Distributed by MLS Grid
- 2016-08-19 Price Changed $205,000 HGMLS
- 2016-08-19 Sold (MLS) $205,000 HGMLS
- 2016-08-18 Sold (MLS) $205,000 OneKey® MLS as Distributed by MLS Grid
- 2016-07-27 Contingent — HGMLS
- 2016-07-26 Price Changed $225,000 HGMLS
- 2016-07-20 Listing Removed — OneKey® MLS as Distributed by MLS Grid
- 2016-06-28 Listed $225,000 OneKey® MLS as Distributed by MLS Grid
- 2016-06-28 Listed $225,000 HGMLS
- 2016-06-28 Delisted — HGMLS
- 2016-05-12 Price Changed — HGMLS
- 2016-04-12 Price Changed — HGMLS
- 2016-03-02 Price Changed — HGMLS
- 2016-01-26 Price Changed — HGMLS
- 2015-12-24 Price Changed — HGMLS
- 2015-12-24 Price Changed — HGMLS
- 2015-11-19 Listed — HGMLS
- 2015-11-18 Listed $235,000 OneKey® MLS as Distributed by MLS Grid
- 2014-03-15 Price Changed $525,000 HGMLS
- 2008-02-20 Sold (Public Records) $525,000 Public Records
- 2008-01-04 Delisted — HGMLS
- 2008-01-02 Sold (MLS) $525,000 HGMLS
- 2007-10-12 Price Changed $560,000 HGMLS
- 2007-01-24 Listed $560,000 HGMLS
- 2007-01-02 Sold (Public Records) $525,000 Public Records
- 2006-11-06 Sold (MLS) $525,000 HGMLS
- 2006-09-19 Delisted — HGMLS
- 2006-09-19 Price Changed $569,000 HGMLS
- 2006-06-23 Listed $525,000 HGMLS
- 1989-12-18 Sold (Public Records) $160,000 Public Records
Property tax history
-24.8%/yrLatest (2025): $1,621 · -0.4% YoY. Source: county tax records.
Cash-flow waterfall
monthlySold comps — $/sqft
last 12 mo · ≤1 miLoading sold comps…