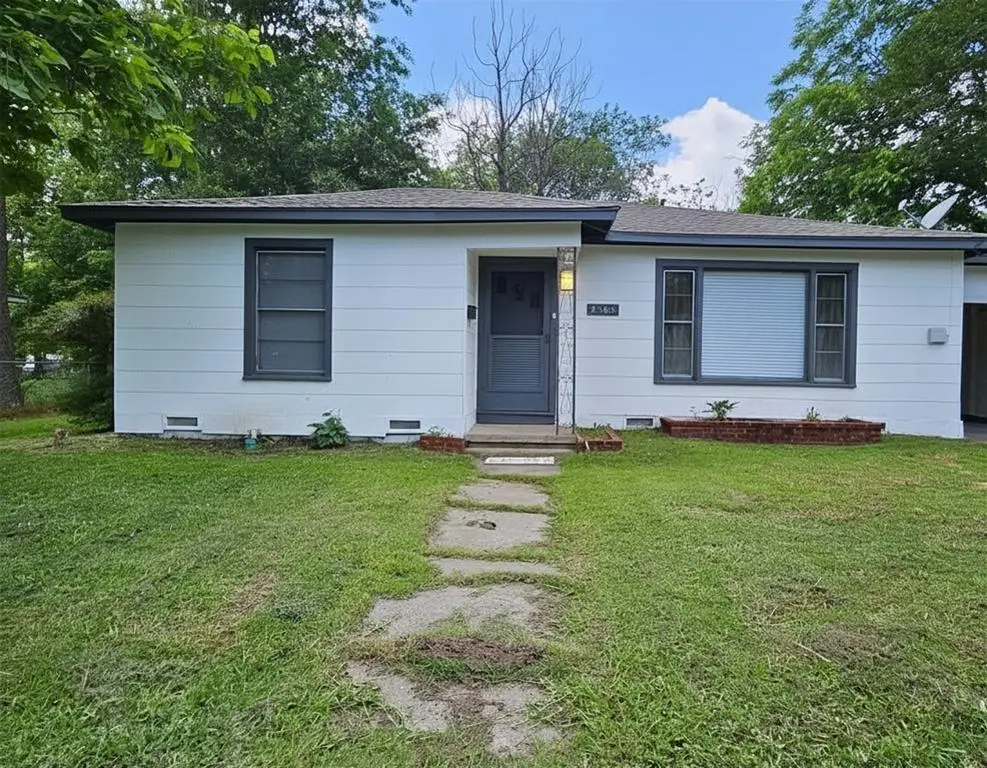
2505 Campbell St · Commerce, TX
Flood risk 1/10 · Minimal
- FEMA flood zone
- X (unshaded)
- Chance of flooding over 30 yrs
- 0.0%
- Est. flood insurance / yr
- $507 – $1,088
Fire risk 7/10 · Major
- Est. fire insurance / yr
- $1,222 – $2,270
Heat risk 7/10 · Major
- Hot days now (above 110°F)
- 7 days/yr
- Hot days in 30 yrs
- 23 days/yr
Wind risk 6/10 · Moderate
- Chance of severe wind over 30 yrs
- 27.0%
Air-quality risk 2/10 · Minimal
- Unhealthy air days now
- 0 days/yr
- Unhealthy air days in 30 yrs
- 1 days/yr
Risk factors via First Street. Map © Google.
Why this score? — see what drove the D+ grade
The composite is a weighted blend of 9 inputs, each scored 0–100. Each bar is that input's sub-score; the figure is the points it added to the 100-point composite (weight × sub-score).
- Cash flow +16.7/30.0
- ARV discount +8.9/15.0
- DSCR +5.2/10.0
- 1% rule +4.5/10.0
- Livability +3.2/5.0
- Rent growth +2.5/5.0
- Condition / age +2.5/5.0
- Schools +2.3/10.0
- Appreciation +0.0/10.0
$135,000
🖨 Deal sheet (PDF) 📄 Offer letter ✓ Due diligence
Listing remarks MLS
Great opportunity to make this home your own! Original hardwood floors! 3 bedrooms, one full bath. Large, fenced backyard.
Key facts
- Open floor plan
- Vinyl plank flooring
- 6,708 sq ft lot
Tags
Property features AI
Finance
- Other: Affordable housing; agent related to owner; Subdivision: College Heights Add
- Financial info: Listing terms: Cash or Conventional; No second mortgage
- HOA & community: No association
Exterior
- Parking: Attached garage (1 car); Covered carport (1 space); Garage faces front
- Security: Smoke detector(s); Carbon monoxide detector(s)
- Utilities: City water; City sewer; Cable available; Not in a municipal utility district
- Home design: Single family residence; Residential property; Entry on one level
- Construction: Built in 1940 (preowned); Siding construction; Composition roof; Pillar/post/pier foundation
- Exterior features: Covered porch(es); Covered patio/porch; Large backyard with grass; Subdivision setting; Chain link fencing
Interior
- Kitchen: Electric range; Microwave; Refrigerator; Dual sinks
- Bedrooms: Primary bedroom (Level 1) — 14 x 12; Bedroom (Level 1) — 12 x 10; Bedroom (Level 1) — 11 x 10
- Flooring: Vinyl flooring
- Bathrooms: 1 full bathroom
- Heating & cooling: Central heating (Natural Gas); Central air; Ceiling fan(s)
- Interior features: Cable TV available; 6 total rooms; One-level layout; 1 living area; 1 dining area
- Laundry & utility: Washer hookup
Neighborhood map
What this means for you Summary
Snapshot
- This is a 3-bed/2.0-bath single-family listed at $135k.
Deal economics
- At list price, monthly cash flow is $83 ($997/yr) — positive.
- The deal already cash-flows at list — no discount required.
- To meet the 1% rule (rent ≥ 1% of price), the offer needs to be $128k (5.3% below list).
- Recommended offer: $128k (5.3% below list) — sets the bar for 1% rule.
- Cap rate 7.0% vs local median 2.1% in Commerce — top-decile yield for the area; either an underpriced asset or a hidden risk that comps aren't pricing in. Stress-test before assuming the spread holds.
Location & tenants
- Location reads 64/100 on livability (#737 in TX) — a middle-class / working-renter tenant base. Strengths: cost of living A+, housing A+, health & safety A-; Watch: crime C-, amenities F, commute F.
- Commerce ISD (rural): math 23% / reading 33% proficiency, ranked #687 of 826 in TX (top 83%) — low school quality limits family demand, transient renter base, plan for 1-2y turnover; 62% free/reduced lunch — lower-income household profile, screen leases tightly.
- Zoned schools: Commerce El (400 students, 78% FRL); Commerce Middle (math 21% / reading 31%, grade F, #1,222 of 1,662 statewide, top 74%, 331 students, 78% FRL); Commerce H S (math 17% / reading 52%, grade F, #963 of 1,632 statewide, top 61%, 465 students, 68% FRL).
- Market conditions: 211 active listings in the ZIP; 18 comparable units currently listed for rent nearby; rentals at typical pace (median 24d on market — plan ~3-4 weeks tenant-placement turnaround); 1,289 units permitted in Hunt County in 2024 (527 in 5+ unit buildings).
Forward outlook
- Local home prices are declining (-3.0%/yr); year-one equity from $933 of loan paydown is wiped out by about $4k of value loss. Plan a longer hold.
- Hunt County population projected at +15% by 2050 — modest demand growth; plan on rents tracking national, not racing it.
Negotiation context
- It's been on market 39 days — a 3% lower offer ($131k) is reasonable based on typical stale-listing flexibility.
- 2 sale attempts; this cycle's ask has dropped $20k (13%) from the opening price — seller is motivated, your offer sets the floor, not the list.
Risks & watch-outs
- Watch-outs: built in 1940 — expect roof / HVAC / electrical / plumbing capex.
- Climate carrying-cost: major wind risk, 27% chance of damaging wind over 30y; major wildfire risk; extreme-heat days projected 7→23/yr by 2055 (HVAC capex compounding) — expect insurance premiums to compound above CPI over the hold.
Questions for the listing agent
- It's been on market 39 days. Have you received any prior offers? Is the seller open to a 5% concession, seller financing, or rate buy-down credit?
- Built in 1940 — when were the roof, HVAC, electrical panel, plumbing, and water heater last replaced?
- Is there a deadline driving the sale (1031 exchange, divorce, estate, relocation)? That informs how much negotiation room exists.
- Schools are F-rated, which usually means shorter tenancies and higher turnover. Who's the typical renter profile here, and what's been the actual vacancy rate?
- The area grade is low — what's the realistic commute time and amenity access for the typical tenant pool here? Any planned neighborhood developments (good or bad) we should know about?
- What's the average days-on-market for RENTAL listings here right now (not sales)? A rising rental-DOM trend means longer vacancies and softer asking-rent achievability than the comps imply.
- What's the recent tenant-quality profile in this submarket — average credit score on applications, eviction rate, late-payment / NSF rate, and stable-employment percentage? A property-management company in the area should have these aggregated.
- How much new for-sale + rental construction is in the pipeline within 1–3 miles? Heavy new supply typically softens prices + rents 12–24 months out; constrained supply supports both.
Investment metrics
- 1% rule
- 0.95% ✗
- Cap rate
- 7.03%
- Cash-on-cash
- 2.64%
- DSCR
- 1.12
- GRM
- 8.8
CMA / ARV
- ARV (on-the-fly)
- $139,320
- Comps found
- 4
Show comp detail 4 sales within ~0.75 mi
| Address | Dist | Beds/Ba | Sqft | Sold | Price | $/sf | Match |
|---|---|---|---|---|---|---|---|
| 1810 Live Oak St | 0.62mi | 3/1.0 | 1,092 (+1%) | 1mo | $100,000 | $92 | 64 |
| 2708 Monroe St | 0.24mi | 3/1.5 | 1,135 (+5%) | 24mo | $205,000 | $181 | 58 |
| 2009 Pecan St | 0.44mi | 2/2.0 (-1) | 1,014 (-6%) | 22mo | $95,000 | $94 | 46 |
| 1410 Bois D Arc St | 0.71mi | 3/1.0 | 1,236 (+14%) | 7mo | $159,900 | $129 | 33 |
Match score weights: distance 35% · size 25% · config 20% · recency 20%. Top-matched comps best support the ARV.
Projected returns pro-forma
-3.0% appreciation · 3.0% rent growth · sell at horizon
- IRR
- -12.1%
- Equity multiple
- 0.56×
- Total profit
- $-16,569
- Equity at exit
- $20,129
- IRR
- -3.0%
- Equity multiple
- 0.80×
- Total profit
- $-7,550
- Equity at exit
- $11,672
Cash invested: $37,800 (down + closing). Projections, not guarantees.
Landlord ↔ Tenant lean methodology
- Overall (STATE)
- 87 Strongly Landlord-Friendly
- State Texas
- 87 Strongly Landlord-Friendly · R+5
- County
- — inherits STATE
- City
- — inherits STATE
ZIP-level market 75428
- Home prices YoY
- -6.5%
- Active inventory
- 211
- Price-to-rent
- 8.8×
Monthly cashflow live
- Estimated rent
- $1,279 high interval (Pro) →
- Mortgage (P&I)
- −$708
- Tax from tax record
- −$163 /mo · $1,958/yr
- Insurance
- −$56
- HOA
- −$0
- Vacancy / Maint / Mgmt
- −$269
- Net cashflow
- $83
Break-even live
Sensitivity live
| Price | -10% $159 | -5% $121 | +0% $83 | +5% $45 | +10% $7 |
|---|---|---|---|---|---|
| Rent | -10% $-18 | -5% $33 | +0% $83 | +5% $134 | +10% $184 |
| Rate | -1.0pp $151 | -0.5pp $117 | base $83 | +0.5pp $48 | +1.0pp $13 |
UW: 25.0% down · 7.5% · 30yr · 1.5% tax · 5.0% vac · 8.0% maint · 8.0% mgmt
Financing live
Cash to close
- Down payment
- $33,750
- Closing costs
- $4,050
- Reserves months
- —
- Total cash needed
- —
Loan-product check · same deal, 3 products live
Conventional
25% down · 7.5% · 30yr
- Down + closing
- —
- Monthly P&I
- —
- Monthly cashflow
- —
- DSCR
- —
- Eligible?
- —
Personal DTI + credit; lowest rate.
DSCR
20% down · 8.5% · 30yr
- Down + closing
- —
- Monthly P&I
- —
- Monthly cashflow
- —
- DSCR
- —
- Eligible?
- —
No personal income docs; deal must DSCR.
Hard money
10% down · 12.0% · 12mo
- Down + closing
- —
- Monthly P&I
- —
- Monthly cashflow
- —
- DSCR
- —
- Eligible?
- —
Short-term bridge; refi at stabilization.
Rent comps 18 comps
| Address | Beds | Baths | Sqft | Rent | $/sqft | DOM | Units | Dist |
|---|---|---|---|---|---|---|---|---|
| 2004 Pecan St Commerce, TX | 2.0 | 3.0 | 1014 | $1,200 | $1.18 | 45d | 1 | 0.49mi |
| 1313 Hunt St Commerce, TX | 3.0 | 2.0 | 1100 | $2,400 | $2.18 | 45d | 1 | 0.55mi |
| 1618 Bois D'Arc St Unit 102 Commerce, TX | 2.0 | 2.0 | 1000 | $895 | $0.90 | 24d | 1 | 0.56mi |
| 1814 Hunt St Unit 1809 Commerce, TX | 2.0 | 1.5 | 872 | $995 | $1.14 | 45d | 1 | 0.59mi |
| 1814 Hunt St Unit 1805 6 Commerce, TX | 2.0 | 1.5 | 872 | $995 | $1.14 | 26d | 1 | 0.59mi |
| 1814 Hunt St Unit 1303 Commerce, TX | 2.0 | 1.0 | 700 | $925 | $1.32 | 45d | 1 | 0.59mi |
| 801 Culver St Unit A05 Commerce, TX | 2.0 | 1.5 | 870 | $1,025 | $1.18 | 0d | 1 | 0.67mi |
| 801 Culver St Unit C209 Commerce, TX | 3.0 | 1.0 | 1053 | $1,175 | $1.12 | 21d | 1 | 0.67mi |
| 801 Culver St Unit D209 Commerce, TX | 2.0 | 2.0 | 770 | $1,250 | $1.62 | 3d | 1 | 0.68mi |
| 600 Maple St Commerce, TX | 4.0 | 4.0 | 1400 | $800 | $0.57 | 26d | 1 | 0.74mi |
| 409 Maple St Unit 409A Commerce, TX | 3.0 | 2.0 | 1098 | $625 | $0.57 | 1d | 1 | 0.84mi |
| 800 Sycamore St Commerce, TX | 2.0 | 2.0 | 1045 | $1,200 | $1.15 | 45d | 1 | 0.96mi |
| 1315 Oneal St Unit B Commerce, TX | 3.0 | 2.0 | 1007 | $1,275 | $1.27 | 3d | 1 | 1.03mi |
| 1315 Oneal St Commerce, TX | 3.0 | 2.0 | 1007 | $1,600 | $1.59 | 0d | 1 | 1.03mi |
| 1004 Park St Commerce, TX | 3.0 | 1.0 | 1082 | $925 | $0.85 | 18d | 1 | 1.06mi |
| 904 N Neal St Commerce, TX | 2.0 | 1.0 | 1033 | $1,250 | $1.21 | 14d | 1 | 1.32mi |
| 904 N Neal St Commerce, TX | 2.0 | 1.0 | 1033 | $1,250 | $1.21 | 17d | 1 | 1.32mi |
| 811 Bishop St Commerce, TX | 2.0 | 1.0 | 810 | $850 | $1.05 | 45d | 1 | 1.44mi |
Listing history 24 events
-
2026-06-21days on market $135,000 Active 39 DOM
-
2026-06-18days on market $135,000 Active 36 DOM
-
2026-06-17days on market $135,000 Active 35 DOM
-
2026-06-16days on market $135,000 Active 34 DOM
-
2026-06-15days on market $135,000 Active 33 DOM
-
2026-06-13days on market $135,000 Active 31 DOM
-
2026-06-13days on market $135,000 Active 30 DOM
-
2026-06-09days on market $135,000 Active 27 DOM
-
2026-06-08days on market $135,000 Active 26 DOM
-
2026-06-07days on market $135,000 Active 25 DOM
-
2026-06-04days on market $135,000 Active 22 DOM
-
2026-06-03days on market $135,000 Active 21 DOM
-
2026-06-02days on market $135,000 Active 20 DOM
-
2026-06-01days on market $135,000 Active 19 DOM
-
2026-05-31days on market $135,000 Active 18 DOM
-
2026-05-13$155,000 Active
-
2025-11-17soldstatus
-
2025-11-13soldstatus Closed 122-char remark
Show marketing remark (122 chars)
Great opportunity to make this home your own! Original hardwood floors! 3 bedrooms, one full bath. Large, fenced backyard.
-
2025-11-04status Pending 122-char remark
Show marketing remark (122 chars)
Great opportunity to make this home your own! Original hardwood floors! 3 bedrooms, one full bath. Large, fenced backyard.
-
2025-10-25historical Active Option Contract 122-char remark
Show marketing remark (122 chars)
Great opportunity to make this home your own! Original hardwood floors! 3 bedrooms, one full bath. Large, fenced backyard.
-
2025-10-17$69,900 Active 122-char remark
Show marketing remark (122 chars)
Great opportunity to make this home your own! Original hardwood floors! 3 bedrooms, one full bath. Large, fenced backyard.
-
2014-09-26soldstatus
-
2010-09-03soldstatus
-
1989-08-29soldstatus
ⓘ Source: listings_history table (triggers on properties + properties_extension) + one-shot
backfill from property_details.listing_events for pre-trigger history.
Tax reassessment forecast TX · Resets to sale price
- Current annual tax
- $1,958 · $163/mo
- Projected year-2 tax
- $2,470 · $206/mo
- Expected delta
- +$513/yr (+$43/mo · 26.2%)
ⓘ Screening estimate from a state-policy table — verify with the county assessor before closing.
Climate risk First Street
- Flood 1/10 Low FEMA zone X (unshaded) · 0% chance over 30 yrs
- Wildfire 7/10 Severe
- Heat 7/10 Severe 7 d/yr ≥110°F today · 23 d/yr by 30 yrs out
- Wind 6/10 Major 27% chance of damaging wind over 30 yrs
- Air quality 2/10 Low 0 unhealthy d/yr today · 1 by 30 yrs out
Nearby sold comps map
Loading sold comps map…
Walkable amenities ~0.75 mi
Loading nearby amenities…
Taxation est. · year 1
- Rental income
- $15,348
- − Mortgage interest
- −$7,562
- − Property taxes
- −$1,958
- − Insurance
- −$675
- − Repairs & maintenance
- −$1,228
- − Management
- −$1,228
- − Depreciation
- −$3,927
- Taxable loss
- −$1,230
- Est. tax savings @ 24.0%
- +$295
- After-tax cash flow
- $1,292/yr
For passive investors: Depreciation is non-cash, so a rental often shows a tax loss while cash-flowing — sheltering income. Rental losses are passive: they offset passive income freely, and up to $25,000/yr can offset ordinary (W-2) income if you actively participate and your MAGI is under $100k (phasing out to $0 by $150k); unused losses carry forward. On sale, claimed depreciation is recaptured at up to 25%, and gains may owe capital-gains tax (a 1031 exchange can defer both). Figures are a year-1 estimate at your 24.0% rate — not tax advice; consult a CPA.
Schools (NCES district)
- District
- Commerce ISD
- NCES district ID
- 4814820
- Math proficiency
- 23% ▼ -10.00%
- Reading proficiency
- 33% ▬ 0.00%
- Median HH income
- $34,295
- Composite
- 23.01/100
- National rank
- #7977
- State rank
- #687 of 826 in TX
Livability — Commerce
- Score
- 64/100
- State rank
- #737
- US rank
- #13696
Category grades
Schools grade is shown separately in the Schools card above.
Census & demographics
- Census place
- Commerce, TX
- County
- Hunt County · 71,969 people
- City population
- 11,531
- Metro
- Dallas-Fort Worth-Arlington, TX
- Population (ZIP)
- 11,531
- Household income
- $51,424
- Rent vs Own
- Severe rent burden
- 546.0
Population outlook (Hunt County) Hauer SSP2
- Today (2025)
- 97,090 people
- By 2030
- 100,452 · +3.5%
- By 2040
- 106,544 · +9.7%
- By 2050
- 111,218 · +14.6%
- By 2075
- 121,695 · +25.3%
- By 2100
- 123,683 · +27.4%
Race, ethnicity, and origin ACS 2023
- Neighborhood character
- Diverse neighborhood (Simpson 0.63)
- Race & ethnicity
- White 55% Hispanic / Latino 23% Black 14% Two or more races 9% Asian 2% Native American 1%
- Hispanic origin (detail)
- Mexican 19%
- Common ancestry
- Slovak 2% Romanian 2% Lithuanian 2%
- Foreign-born
- 9% · Canada, China
- Languages at home
- 79% English-only · Spanish 16% Other Indo-European 1% German/W. Germanic 1%
Political lean MEDSL · Hunt
- 2024 margin
- Solid R (+55.5) · D 21.9% · R 77.4%
- 2008→2024 swing
- -14.9pp toward R · 2008: -40.6pp · 2024: -55.5pp
- All cycles
- 2024: R+55.5 2020: R+52.5 2016: R+56.3 2012: R+51.2 2008: R+40.6
Not yet ingested
- Civics
- —
Market trends
- HPI YoY
- ▼ -20.08%
- Current HPI
- 289.0436
- Rent YoY
- —
- Metro
- Dallas-Fort Worth-Arlington, TX
- State GDP YoY
- ▲ 3.95%
- F500 in state
- 110
Industry mix (Fortune 500 HQ in TX)
| Industry | F500 HQs | Revenue |
|---|---|---|
| Energy | 16 | $1,198B |
|
||
| Technology | 5 | $198B |
|
||
| Engineering / Construction | 4 | $72B |
|
||
| Energy Services | 3 | $60B |
|
||
| Utilities | 3 | $41B |
|
||
| Healthcare | 2 | $330B |
|
||
Price history
+121.7% since first listed9 events — show timeline
- 2026-05-13 Listed $155,000 NTREIS
- 2025-11-17 Sold (Public Records) — Public Records
- 2025-11-13 Sold (MLS) — NTREIS
- 2025-11-04 Pending — NTREIS
- 2025-10-25 Contingent — NTREIS
- 2025-10-17 Listed $69,900 NTREIS
- 2014-09-26 Sold (Public Records) — Public Records
- 2010-09-03 Sold (Public Records) — Public Records
- 1989-08-29 Sold (Public Records) — Public Records
Property tax history
+4.4%/yrLatest (2025): $1,958 · -10.7% YoY. Source: county tax records.
Cash-flow waterfall
monthlySold comps — $/sqft
last 12 mo · ≤1 miLoading sold comps…