 🏗️ New Construction
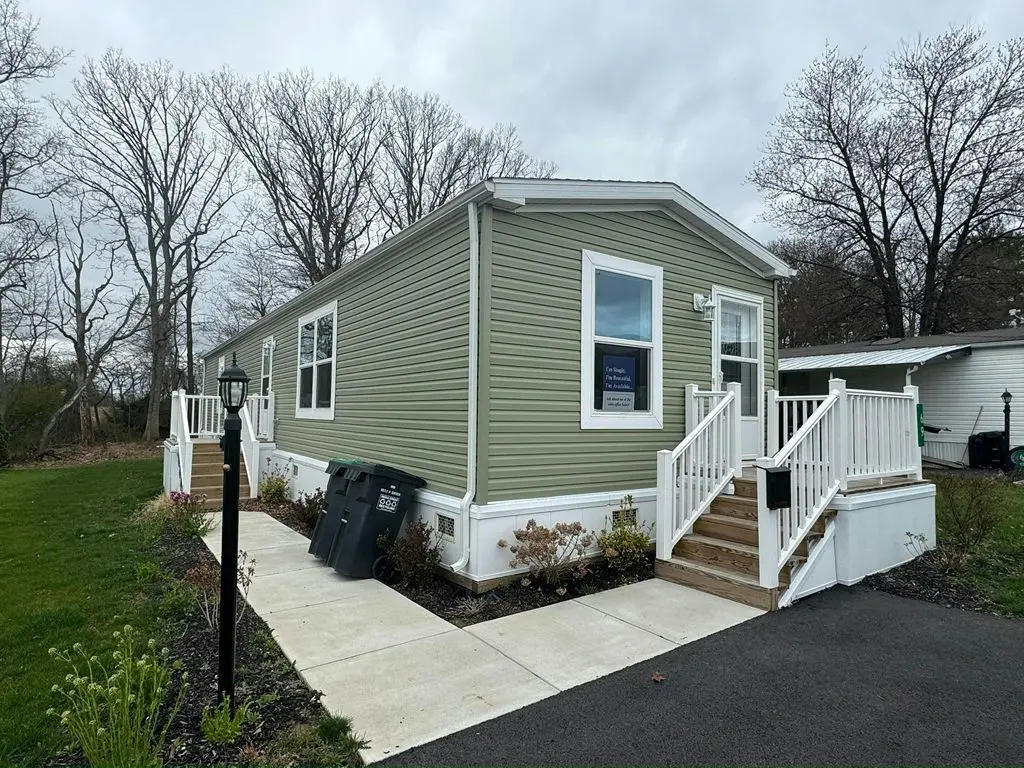
Lawrence 7016 - 707 Plan · Lehigh, PA
Flood risk 1/10 · Minimal
- FEMA flood zone
- X (unshaded)
- Chance of flooding over 30 yrs
- 0.0%
- Est. flood insurance / yr
- $473 – $860
Fire risk 3/10 · Minor
- Est. fire insurance / yr
- $511 – $949
Heat risk 4/10 · Minor
- Hot days now (above 97°F)
- 7 days/yr
- Hot days in 30 yrs
- 15 days/yr
Wind risk 4/10 · Minor
- Chance of severe wind over 30 yrs
- 15.0%
Air-quality risk 2/10 · Minimal
- Unhealthy air days now
- 1 days/yr
- Unhealthy air days in 30 yrs
- 2 days/yr
Risk factors via First Street. Map © Google.
Why this score? — see what drove the B grade
The composite is a weighted blend of 9 inputs, each scored 0–100. Each bar is that input's sub-score; the figure is the points it added to the 100-point composite (weight × sub-score).
- Cash flow +30.0/30.0
- 1% rule +10.0/10.0
- DSCR +10.0/10.0
- ARV discount +7.5/15.0
- Condition / age +4.8/5.0
- Schools +4.4/10.0
- Rent growth +2.5/5.0
- Livability +2.5/5.0
- Appreciation +0.0/10.0
$109,000
🖨 Deal sheet 📄 Offer letter ✓ Due diligence
Listing remarks MLS
Are you ready for a fresh start? Picture yourself in a great neighborhood at the base of Blue Mountain. Lehigh Township is the perfect place to feel like you're living off the beaten path, yet you're close to everything, including Blue Mountain Ski Resort and Penns Peak. Mountain View MHC currently has a gorgeous 3 bed/2 bath, 2022 Clayton home that is move in ready! Call today to speak with one of our representatives and schedule a viewing of this home.
Key facts
- Mountain view mhc
- 2022 clayton home
- Listed 785 days
Tags
Neighborhood map
What this means for you Summary
Snapshot
- This is a 3-bed/2.0-bath manufactured listed at $109k. Condition is rated excellent.
Deal economics
- At list price, monthly cash flow is $1k ($13k/yr) — positive.
- The deal already cash-flows at list — no discount required.
- Meets the 1% rule at list price ($2k rent vs $109k).
- Recommended offer: $96k (12.0% below list) — sets the bar for market timing.
Location & tenants
- Location reads: area grade B — affects rentability + tenant quality, not the cash-flow math above.
- Northampton Area SD (suburban): math 47% / reading 54% proficiency, ranked #153 of 539 in PA (top 28%) — acceptable for families but not a draw, mixed tenant base, ~2y average lease.
- Market conditions: 43 active listings in the ZIP; 567 units permitted in Northampton County in 2024 (151 in 5+ unit buildings).
Forward outlook
- Local home prices are declining (-3.0%/yr); year-one equity from $415 of loan paydown is wiped out by about $2k of value loss. Plan a longer hold.
- At projected returns (-3.0% appreciation + 3.0% rent growth), your $17k cash investment doubles in ~2 years — after that, you're playing with house money.
Negotiation context
- It's been on market 785 days — a 12% lower offer ($96k) is reasonable based on typical stale-listing flexibility.
Questions for the listing agent
- It's been on market 785 days. Have you received any prior offers? Is the seller open to a 12% concession, seller financing, or rate buy-down credit?
- Why hasn't it sold? Are there any deal-killer items the seller is aware of (foundation, flood, title, zoning, code violations)?
- Is there a deadline driving the sale (1031 exchange, divorce, estate, relocation)? That informs how much negotiation room exists.
- What's the average days-on-market for RENTAL listings here right now (not sales)? A rising rental-DOM trend means longer vacancies and softer asking-rent achievability than the comps imply.
- What's the recent tenant-quality profile in this submarket — average credit score on applications, eviction rate, late-payment / NSF rate, and stable-employment percentage? A property-management company in the area should have these aggregated.
- How much new for-sale + rental construction is in the pipeline within 1–3 miles? Heavy new supply typically softens prices + rents 12–24 months out; constrained supply supports both.
Investment metrics
- 1% rule
- 3.10% ✓
- Cap rate
- 27.41%
- Cash-on-cash
- 75.43%
- DSCR
- 4.36
- GRM
- 2.7
CMA / ARV
- ARV (median comp)
- $59,918
- List price
- $109,000
- Delta
- 81.91%
- Verdict
- OVERPRICED
- Comps
- 6 within 1.0 mi
Show comp detail 3 sales within ~0.75 mi
| Address | Dist | Beds/Ba | Sqft | Sold | Price | $/sf | Match |
|---|---|---|---|---|---|---|---|
| 95 Nashua St | 0.16mi | 3/2.0 | 1,100 (+4%) | 6mo | $60,000 | $55 | 80 |
| 161 Windsor St | 0.04mi | 3/1.5 | 917 (-13%) | 2mo | $42,000 | $46 | 73 |
| 1237 Valley Forge Dr | 0.71mi | 3/2.0 | 1,188 (+12%) | 10mo | $112,000 | $94 | 37 |
Match score weights: distance 35% · size 25% · config 20% · recency 20%. Top-matched comps best support the ARV.
Projected returns pro-forma
-3.0% appreciation · 3.0% rent growth · sell at horizon
- IRR
- 75.3%
- Equity multiple
- 4.43×
- Total profit
- $57,487
- Equity at exit
- $8,934
- IRR
- 79.0%
- Equity multiple
- 9.15×
- Total profit
- $136,663
- Equity at exit
- $5,181
Cash invested: $16,777 (down + closing). Projections, not guarantees.
Landlord ↔ Tenant lean methodology
- Overall (STATE)
- 62 Landlord-Friendly
- State Pennsylvania
- 62 Landlord-Friendly · EVEN
- County
- — inherits STATE
- City
- — inherits STATE
ZIP-level market 18088
- Active inventory
- 43
- Price-to-rent
- 4.9×
Monthly cashflow live
- Estimated rent
- $1,859 medium interval (Pro) →
- Mortgage (P&I)
- −$314
- Tax est. 1.5%
- −$75 /mo · $899/yr
- Insurance
- −$25
- HOA
- −$0
- Vacancy / Maint / Mgmt
- −$390
- Net cashflow
- $1,055
Break-even live
UW: 25.0% down · 7.5% · 30yr · 1.5% tax · 5.0% vac · 8.0% maint · 8.0% mgmt
Financing live
Cash to close
- Down payment
- $14,980
- Closing costs
- $1,798
- Reserves months
- —
- Total cash needed
- —
Loan-product check · same deal, 3 products live
Conventional
25% down · 7.5% · 30yr
- Down + closing
- —
- Monthly P&I
- —
- Monthly cashflow
- —
- DSCR
- —
- Eligible?
- —
Personal DTI + credit; lowest rate.
DSCR
20% down · 8.5% · 30yr
- Down + closing
- —
- Monthly P&I
- —
- Monthly cashflow
- —
- DSCR
- —
- Eligible?
- —
No personal income docs; deal must DSCR.
Hard money
10% down · 12.0% · 12mo
- Down + closing
- —
- Monthly P&I
- —
- Monthly cashflow
- —
- DSCR
- —
- Eligible?
- —
Short-term bridge; refi at stabilization.
Listing history 16 events
-
2026-06-18days on market $109,000 Active 785 DOM
-
2026-06-17days on market $109,000 Active 784 DOM
-
2026-06-16days on market $109,000 Active 783 DOM
-
2026-06-15days on market $109,000 Active 782 DOM
-
2026-06-14days on market $109,000 Active 780 DOM
-
2026-06-10days on market $109,000 Active 777 DOM
-
2026-06-09days on market $109,000 Active 776 DOM
-
2026-06-08days on market $109,000 Active 775 DOM
-
2026-06-07days on market $109,000 Active 774 DOM
-
2026-06-05days on market $109,000 Active 771 DOM
-
2026-06-03days on market $109,000 Active 770 DOM
-
2026-06-02days on market $109,000 Active 769 DOM
-
2026-06-01days on market $109,000 Active 768 DOM
-
2026-05-31days on market $109,000 Active 767 DOM
-
2026-05-31days on market $109,000 Active 766 DOM
-
2024-04-24$109,000 Active 458-char remark
Show marketing remark (458 chars)
Are you ready for a fresh start? Picture yourself in a great neighborhood at the base of Blue Mountain. Lehigh Township is the perfect place to feel like you're living off the beaten path, yet you're close to everything, including Blue Mountain Ski Resort and Penns Peak. Mountain View MHC currently has a gorgeous 3 bed/2 bath, 2022 Clayton home that is move in ready! Call today to speak with one of our representatives and schedule a viewing of this home.
ⓘ Source: listings_history table (triggers on properties + properties_extension) + one-shot
backfill from property_details.listing_events for pre-trigger history.
Climate risk First Street
- Flood 1/10 Low FEMA zone X (unshaded) · 0% chance over 30 yrs
- Wildfire 3/10 Moderate
- Heat 4/10 Moderate 7 d/yr ≥97°F today · 15 d/yr by 30 yrs out
- Wind 4/10 Moderate 15% chance of damaging wind over 30 yrs
- Air quality 2/10 Low 1 unhealthy d/yr today · 2 by 30 yrs out
Nearby sold comps map
Loading sold comps map…
Walkable amenities ~0.75 mi
Loading nearby amenities…
Taxation est. · year 1
- Rental income
- $22,309
- − Mortgage interest
- −$3,356
- − Property taxes
- −$899
- − Insurance
- −$300
- − Repairs & maintenance
- −$1,785
- − Management
- −$1,785
- − Depreciation
- −$1,743
- Taxable income
- $12,442
- Est. tax owed @ 24.0%
- −$2,986
- After-tax cash flow
- $9,669/yr
For passive investors: Depreciation is non-cash, so a rental often shows a tax loss while cash-flowing — sheltering income. Rental losses are passive: they offset passive income freely, and up to $25,000/yr can offset ordinary (W-2) income if you actively participate and your MAGI is under $100k (phasing out to $0 by $150k); unused losses carry forward. On sale, claimed depreciation is recaptured at up to 25%, and gains may owe capital-gains tax (a 1031 exchange can defer both). Figures are a year-1 estimate at your 24.0% rate — not tax advice; consult a CPA.
Condition & rehab AI · 12 photos
This move-in ready manufactured home is in excellent condition with modern finishes and a well-maintained exterior. It offers a great opportunity for investors looking to increase its value through minor updates and improvements.
Value-add opportunities
- Both Painting the exterior and interior walls — Fresh paint can enhance curb appeal and interior aesthetics.
- Both Landscaping improvements — Enhanced landscaping can improve curb appeal and attract potential buyers/tenants.
- Both Adding smart home features — Smart home features can increase the home's appeal and market value.
- Both Upgrading the kitchen appliances — Modernizing the kitchen can make the home more appealing to potential buyers/tenants.
- Both Adding a smart thermostat — A smart thermostat can improve energy efficiency and comfort, making the home more attractive to potential buyers/tenants.
Renovation cost estimate screening
Value-add ROI direction
- Both Painting the exterior and interior walls — Fresh paint can enhance curb appeal and interior aesthetics. ↑
- Both Landscaping improvements — Enhanced landscaping can improve curb appeal and attract potential buyers/tenants. ↑
- Both Adding smart home features — Smart home features can increase the home's appeal and market value. ↑
- Both Upgrading the kitchen appliances — Modernizing the kitchen can make the home more appealing to potential buyers/tenants. ↑
- Both Adding a smart thermostat — A smart thermostat can improve energy efficiency and comfort, making the home more attractive to potential buyers/tenants. ↑
ⓘ Cost ranges are severity-bucket heuristics (US national rule-of-thumb). Get contractor quotes + a written scope before underwriting a rehab budget.
Schools (NCES district)
- District
- Northampton Area SD
- NCES district ID
- 4217370
- Math proficiency
- 47% ▼ -1.00%
- Reading proficiency
- 54% ▼ -13.00%
- Median HH income
- $62,326
- Composite
- 44.35/100
- National rank
- #2822
- State rank
- #153 of 539 in PA
Livability — Lehigh
No livability data for this city. (Only ~50 U.S. cities are tracked.)
Census & demographics
- Population (ZIP)
- 8,162
Population outlook (Northampton County) Hauer SSP2
- Today (2025)
- 312,227 people
- By 2030
- 314,769 · +0.8%
- By 2040
- 316,914 · +1.5%
- By 2050
- 318,037 · +1.9%
- By 2075
- 334,003 · +7.0%
- By 2100
- 344,696 · +10.4%
Race, ethnicity, and origin ACS 2023
- Neighborhood character
- Predominantly White (89%)
- Race & ethnicity
- White 89% Two or more races 5% Hispanic / Latino 4% Black 2% Asian 1%
- Common ancestry
- Polish 7% Romanian 3% Danish 3%
- Foreign-born
- 2% · India, Canada
- Languages at home
- 96% English-only · Other Indo-European 2% Spanish 1%
Political lean MEDSL · Northampton
- 2024 margin
- Toss-up / Even · D 48.6% · R 50.4%
- 2008→2024 swing
- -14.1pp toward R · 2008: 12.3pp · 2024: -1.8pp
- All cycles
- 2024: R+1.8 2020: D+0.7 2016: R+3.8 2012: D+4.6 2008: D+12.3
Not yet ingested
- Civics
- —
Market trends
- HPI YoY
- ▼ -137.19%
- Current HPI
- 203.2109
- Rent YoY
- —
- Metro
- —
- State GDP YoY
- ▲ 1.68%
- F500 in state
- 34
Industry mix (Fortune 500 HQ in PA)
| Industry | F500 HQs | Revenue |
|---|---|---|
| Healthcare | 2 | $309B |
|
||
| Insurance | 2 | $27B |
|
||
| Telecommunications / Media | 1 | $124B |
|
||
| Industrial Distribution | 1 | $22B |
|
||
| Financial Services | 1 | $20B |
|
||
| Chemicals / Materials | 1 | $18B |
|
||
Price history
1 event — show timeline
- 2024-04-24 Listed $109,000 Zillow
Cash-flow waterfall
monthlySold comps — $/sqft
last 12 mo · ≤1 miLoading sold comps…