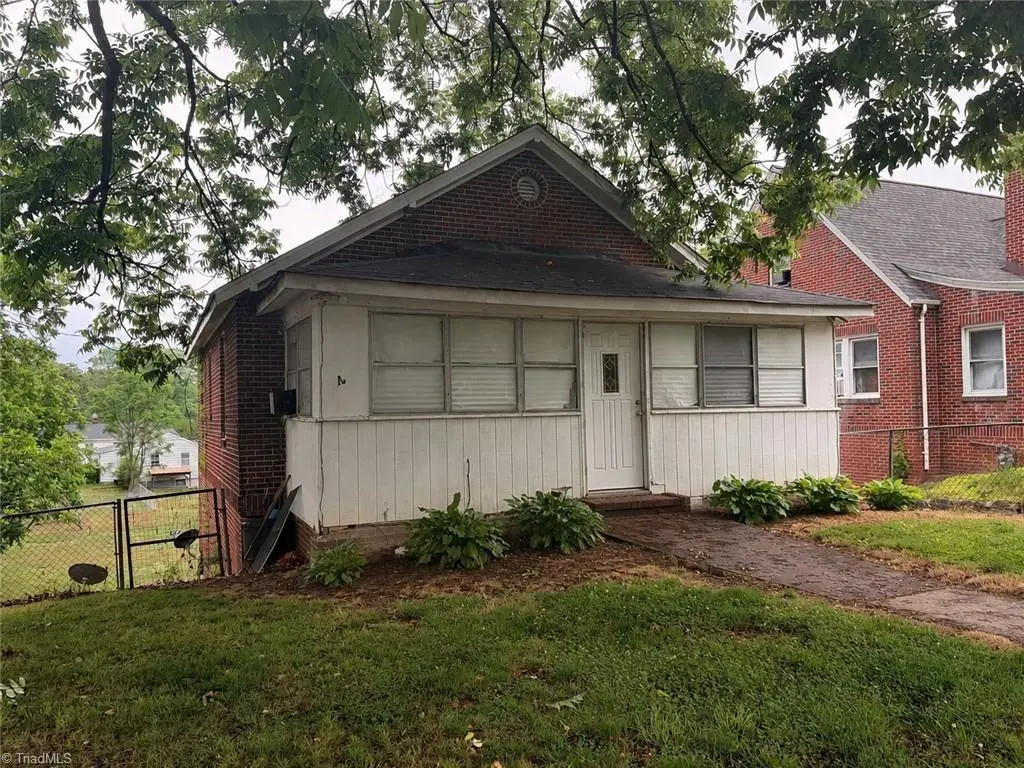
309 Wentworth St · Reidsville, NC
Flood risk 3/10 · Minor
- FEMA flood zone
- X (unshaded)
- Chance of flooding over 30 yrs
- 0.2%
- Est. flood insurance / yr
- $507 – $1,088
Fire risk 3/10 · Minor
- Est. fire insurance / yr
- $906 – $1,684
Heat risk 6/10 · Moderate
- Hot days now (above 103°F)
- 7 days/yr
- Hot days in 30 yrs
- 18 days/yr
Wind risk 4/10 · Minor
- Chance of severe wind over 30 yrs
- 10.0%
Air-quality risk 3/10 · Minor
- Unhealthy air days now
- 2 days/yr
- Unhealthy air days in 30 yrs
- 3 days/yr
Risk factors via First Street. Map © Google.
Why this score? — see what drove the C- grade
The composite is a weighted blend of 9 inputs, each scored 0–100. Each bar is that input's sub-score; the figure is the points it added to the 100-point composite (weight × sub-score).
- Cash flow +16.2/30.0
- ARV discount +15.0/15.0
- DSCR +5.0/10.0
- 1% rule +3.4/10.0
- Schools +3.3/10.0
- Livability +3.0/5.0
- Rent growth +2.5/5.0
- Condition / age +2.5/5.0
- Appreciation +0.0/10.0
$109,000
🖨 Deal sheet (PDF) 📄 Offer letter ✓ Due diligence
Listing remarks
Investment opportunity in a central Reidsville location convenient to downtown and just minutes from Highway 29. This 1930 brick home offers potential for renovation, resale, or rental portfolio addition. The floor plan includes an open living room and kitchen concept, an enclosed front porch, full bath, and flexible room layout. Outside, the property features a fenced yard with an expansive backyard offering plenty of usable outdoor space, along with an additional storage building/shop that provides great potential for future use. Home needs repairs and updates and is best suited for a cash buyer or renovation financing. Buyer to verify bedroom count, square footage, heating, driveway/acce
Key facts
- 0.3 acre lot
- Built 1930
- Listed 11 days
Property features AI
Finance
- Other: Lot approximately 0.3 acre (69 x 191); Public maintained road access; Building total area reported as 864; Directions: Scales Street to Wentworth
- Financial info: Tax amount provided but financial details excluded
- HOA & community: No association
Exterior
- Parking: On-street parking
- Security: Security details not provided
- Utilities: Public water; Public sewer; Water heater unknown
- Home design: Residential stick/site-built house; One story; Built in 1930; Existing structure
- Construction: Brick and wood siding construction; Crawl space foundation
- Exterior features: Exterior features described in remarks; Storage structure on property; No pool
Interior
- Kitchen: Kitchen details not provided
- Bedrooms: Bedroom details not provided
- Flooring: Flooring details not provided
- Bathrooms: 1 full bathroom
- Heating & cooling: Forced air heating; Natural gas heating; Window unit(s) for cooling; No central air
- Interior features: Primary suite on main level
- Laundry & utility: Washer/dryer details not provided
Neighborhood map
What this means for you Summary
Snapshot
- This is a 2-bed/1.0-bath single-family listed at $109k.
Deal economics
- At list price, monthly cash flow is $58 ($697/yr) — positive.
- The deal already cash-flows at list — no discount required.
- To meet the 1% rule (rent ≥ 1% of price), the offer needs to be $92k (15.9% below list).
- Recommended offer: $92k (15.9% below list) — sets the bar for 1% rule.
- Cap rate 6.9% vs local median 3.7% in Reidsville — top-decile yield for the area; either an underpriced asset or a hidden risk that comps aren't pricing in. Stress-test before assuming the spread holds.
Location & tenants
- Location reads 59/100 on livability (#553 in NC) — a working-class tenant base; expect higher turnover. Strengths: cost of living A+, housing A; Watch: crime F, amenities F, commute F.
- Rockingham County Schools (rural): math 38% / reading 40% proficiency, ranked #120 of 178 in NC (top 67%) — families likely to look elsewhere, expect single-tenant / working-renter base with shorter leases.
- Zoned schools: Reidsville Middle (math 27% / reading 33%, grade F, #335 of 475 statewide, top 72%, 614 students, 100% FRL); Reidsville High (math 42% / reading 32%, grade F, #414 of 535 statewide, top 79%, 753 students, 100% FRL) — zoned schools average 100% FRL vs 52% district-wide (48 pts higher); higher-poverty schools than district average — tighter screening recommended.
- Market conditions: 258 active listings in the ZIP; 6 comparable units currently listed for rent nearby; rentals at typical pace (median 25d on market — plan ~3-4 weeks tenant-placement turnaround); 344 units permitted in Rockingham County in 2024 (0 in 5+ unit buildings).
Forward outlook
- Local home prices are declining (-3.0%/yr); year-one equity from $754 of loan paydown is wiped out by about $3k of value loss. Plan a longer hold.
- Rockingham County population projected at -22% by 2050 — secular population decline; favor cash flow + early exit over multi-decade hold.
Negotiation context
- Only 12 days on market — expect competitive offers; lowballing is unlikely to land.
Risks & watch-outs
- Watch-outs: built in 1930 — expect roof / HVAC / electrical / plumbing capex.
- Climate carrying-cost: extreme-heat days projected 7→18/yr by 2055 (HVAC capex compounding) — expect insurance premiums to compound above CPI over the hold.
Questions for the listing agent
- Built in 1930 — when were the roof, HVAC, electrical panel, plumbing, and water heater last replaced?
- Is there a deadline driving the sale (1031 exchange, divorce, estate, relocation)? That informs how much negotiation room exists.
- Schools are D-rated, which usually means shorter tenancies and higher turnover. Who's the typical renter profile here, and what's been the actual vacancy rate?
- Crime grade is F in this area — have there been break-ins, vandalism, or insurance claims at this property in the last 3 years? What carrier currently insures it and at what premium?
- What's the average days-on-market for RENTAL listings here right now (not sales)? A rising rental-DOM trend means longer vacancies and softer asking-rent achievability than the comps imply.
- What's the recent tenant-quality profile in this submarket — average credit score on applications, eviction rate, late-payment / NSF rate, and stable-employment percentage? A property-management company in the area should have these aggregated.
- How much new for-sale + rental construction is in the pipeline within 1–3 miles? Heavy new supply typically softens prices + rents 12–24 months out; constrained supply supports both.
Investment metrics
- 1% rule
- 0.84% ✗
- Cap rate
- 6.93%
- Cash-on-cash
- 2.28%
- DSCR
- 1.10
- GRM
- 9.9
CMA / ARV
- ARV (on-the-fly)
- $143,360
- Comps found
- 12
Show comp detail 12 sales within ~0.75 mi
| Address | Dist | Beds/Ba | Sqft | Sold | Price | $/sf | Match |
|---|---|---|---|---|---|---|---|
| 503 Carroll St | 0.13mi | 3/1.0 (+1) | 884 (-1%) | 0mo | $156,500 | $177 | 86 |
| 704 Roach St | 0.35mi | 2/1.5 | 874 (-2%) | 2mo | $33,000 | $38 | 76 |
| 319 N Washington Ave | 0.42mi | 1/1.0 (-1) | 869 (-3%) | 3mo | $20,000 | $23 | 68 |
| 903 Norman St | 0.35mi | 3/1.0 (+1) | 957 (+7%) | 1mo | $180,000 | $188 | 67 |
| 626 King St | 0.32mi | 3/1.0 (+1) | 965 (+8%) | 2mo | $160,000 | $166 | 66 |
| 405 Graves St | 0.47mi | 2/1.0 | 984 (+10%) | 1mo | $127,000 | $129 | 61 |
| 702 Roach St | 0.35mi | 2/1.0 | 812 (-9%) | 10mo | $130,000 | $160 | 60 |
| 329 N Washington Ave | 0.39mi | 1/1.0 (-1) | 800 (-11%) | 5mo | $179,000 | $224 | 55 |
| 818 Sunset St | 0.55mi | 2/1.0 | 832 (-7%) | 9mo | $20,000 | $24 | 55 |
| 304 Roanoke St | 0.34mi | 3/1.0 (+1) | 1,025 (+14%) | 3mo | $175,000 | $171 | 52 |
| 827 Moore St | 0.55mi | 2/1.0 | 768 (-14%) | 9mo | $40,000 | $52 | 43 |
| 971 Willow St | 0.72mi | 3/1.0 (+1) | 1,020 (+14%) | 3mo | $152,500 | $150 | 36 |
Match score weights: distance 35% · size 25% · config 20% · recency 20%. Top-matched comps best support the ARV.
Projected returns pro-forma
-3.0% appreciation · 3.0% rent growth · sell at horizon
- IRR
- -12.7%
- Equity multiple
- 0.54×
- Total profit
- $-14,002
- Equity at exit
- $16,252
- IRR
- -3.7%
- Equity multiple
- 0.75×
- Total profit
- $-7,590
- Equity at exit
- $9,424
Cash invested: $30,520 (down + closing). Projections, not guarantees.
Landlord ↔ Tenant lean methodology
- Overall (STATE)
- 85 Strongly Landlord-Friendly
- State North Carolina
- 85 Strongly Landlord-Friendly · R+3
- County
- — inherits STATE
- City
- — inherits STATE
ZIP-level market 27320
- Home prices YoY
- -30.8%
- Active inventory
- 258
- Price-to-rent
- 9.9×
Monthly cashflow live
- Estimated rent
- $917 high interval (Pro) →
- Mortgage (P&I)
- −$572
- Tax from tax record
- −$49 /mo · $589/yr
- Insurance
- −$45
- HOA
- −$0
- Vacancy / Maint / Mgmt
- −$193
- Net cashflow
- $58
Break-even live
Sensitivity live
| Price | -10% $120 | -5% $89 | +0% $58 | +5% $27 | +10% $-4 |
|---|---|---|---|---|---|
| Rent | -10% $-14 | -5% $22 | +0% $58 | +5% $94 | +10% $131 |
| Rate | -1.0pp $113 | -0.5pp $86 | base $58 | +0.5pp $30 | +1.0pp $1 |
UW: 25.0% down · 7.5% · 30yr · 1.5% tax · 5.0% vac · 8.0% maint · 8.0% mgmt
Financing live
Cash to close
- Down payment
- $27,250
- Closing costs
- $3,270
- Reserves months
- —
- Total cash needed
- —
Loan-product check · same deal, 3 products live
Conventional
25% down · 7.5% · 30yr
- Down + closing
- —
- Monthly P&I
- —
- Monthly cashflow
- —
- DSCR
- —
- Eligible?
- —
Personal DTI + credit; lowest rate.
DSCR
20% down · 8.5% · 30yr
- Down + closing
- —
- Monthly P&I
- —
- Monthly cashflow
- —
- DSCR
- —
- Eligible?
- —
No personal income docs; deal must DSCR.
Hard money
10% down · 12.0% · 12mo
- Down + closing
- —
- Monthly P&I
- —
- Monthly cashflow
- —
- DSCR
- —
- Eligible?
- —
Short-term bridge; refi at stabilization.
Rent comps 6 comps
| Address | Beds | Baths | Sqft | Rent | $/sqft | DOM | Units | Dist |
|---|---|---|---|---|---|---|---|---|
| 202 Mulberry St Reidsville, NC | 2.0 | 1.0 | 899 | $1,025 | $1.14 | 25d | 1 | 0.09mi |
| 528 N Scales St Unit C Reidsville, NC | 2.0 | 1.0 | 1080 | $825 | $0.76 | 25d | 1 | 0.11mi |
| 110 Arlington St Reidsville, NC | 2.0 | 1.0 | 1000 | $850 | $0.85 | 25d | 1 | 0.52mi |
| 411 W Ransom St Apt 1 Reidsville, NC | 2.0 | 1.0 | 900 | $825 | $0.92 | 25d | 1 | 1.39mi |
| 411 W Ransom St Reidsville, NC | 2.0 | 1.0 | 900 | $825 | $0.92 | 20d | 1 | 1.39mi |
| 744 Crescent Dr Unit 4 Reidsville, NC | 1.0 | 1.0 | 990 | $670 | $0.68 | 20d | 1 | 1.40mi |
Listing history 9 events
-
2026-06-22days on market $109,000 Active 12 DOM
-
2026-06-18days on market $109,000 Active 9 DOM
-
2026-06-17days on market $109,000 Active 8 DOM
-
2026-06-16days on market $109,000 Active 7 DOM
-
2026-06-15days on market $109,000 Active 6 DOM
-
2026-06-14days on market $109,000 Active 4 DOM
-
2026-06-13days on market $109,000 Active 3 DOM
-
2026-06-10remarks 699-char remark
-
2026-06-10$109,000 Active 1 DOM
ⓘ Source: listings_history table (triggers on properties + properties_extension) + one-shot
backfill from property_details.listing_events for pre-trigger history.
Tax reassessment forecast NC · Resets to sale price
- Current annual tax
- $589 · $49/mo
- Projected year-2 tax
- $894 · $74/mo
- Expected delta
- +$305/yr (+$25/mo · 51.9%)
ⓘ Screening estimate from a state-policy table — verify with the county assessor before closing.
Climate risk First Street
- Flood 3/10 Moderate FEMA zone X (unshaded) · 20% chance over 30 yrs
- Wildfire 3/10 Moderate
- Heat 6/10 Major 7 d/yr ≥103°F today · 18 d/yr by 30 yrs out
- Wind 4/10 Moderate 10% chance of damaging wind over 30 yrs
- Air quality 3/10 Moderate 2 unhealthy d/yr today · 3 by 30 yrs out
Nearby sold comps map
Loading sold comps map…
Walkable amenities ~0.75 mi
Loading nearby amenities…
Taxation est. · year 1
- Rental income
- $11,000
- − Mortgage interest
- −$6,106
- − Property taxes
- −$589
- − Insurance
- −$545
- − Repairs & maintenance
- −$880
- − Management
- −$880
- − Depreciation
- −$3,171
- Taxable loss
- −$1,170
- Est. tax savings @ 24.0%
- +$281
- After-tax cash flow
- $978/yr
For passive investors: Depreciation is non-cash, so a rental often shows a tax loss while cash-flowing — sheltering income. Rental losses are passive: they offset passive income freely, and up to $25,000/yr can offset ordinary (W-2) income if you actively participate and your MAGI is under $100k (phasing out to $0 by $150k); unused losses carry forward. On sale, claimed depreciation is recaptured at up to 25%, and gains may owe capital-gains tax (a 1031 exchange can defer both). Figures are a year-1 estimate at your 24.0% rate — not tax advice; consult a CPA.
Schools (NCES district)
- District
- Rockingham County Schools
- NCES district ID
- 3703990
- Math proficiency
- 38% ▼ -2.00%
- Reading proficiency
- 40% ▲ 1.00%
- Median HH income
- $38,914
- Composite
- 32.6/100
- National rank
- #5673
- State rank
- #120 of 178 in NC
Livability — Reidsville
- Score
- 59/100
- State rank
- #553
- US rank
- #20359
Category grades
Schools grade is shown separately in the Schools card above.
Census & demographics
- Census place
- Reidsville, NC
- City population
- 38,610
- Population (ZIP)
- 38,610
Population outlook (Rockingham County) Hauer SSP2
- Today (2025)
- 87,103 people
- By 2030
- 83,763 · -3.8%
- By 2040
- 76,082 · -12.7%
- By 2050
- 68,106 · -21.8%
- By 2075
- 52,531 · -39.7%
- By 2100
- 39,871 · -54.2%
Race, ethnicity, and origin ACS 2023
- Neighborhood character
- Majority White (64%)
- Race & ethnicity
- White 64% Black 23% Two or more races 8% Hispanic / Latino 7%
- Hispanic origin (detail)
- Mexican 4%
- Common ancestry
- Slovak 2% Serbian 2% Italian 2%
- Foreign-born
- 3% · Canada
- Languages at home
- 94% English-only · Spanish 5%
Political lean MEDSL · Rockingham
- 2024 margin
- Solid R (+35.9) · D 31.7% · R 67.6%
- 2008→2024 swing
- -19.9pp toward R · 2008: -16.0pp · 2024: -35.9pp
- All cycles
- 2024: R+35.9 2020: R+32.0 2016: R+30.0 2012: R+21.3 2008: R+16.0
Not yet ingested
- Civics
- —
Market trends
- HPI YoY
- ▼ -91.42%
- Current HPI
- 205.028
- Rent YoY
- —
- Metro
- —
- State GDP YoY
- ▲ 3.28%
- F500 in state
- 26
Industry mix (Fortune 500 HQ in NC)
| Industry | F500 HQs | Revenue |
|---|---|---|
| Financial Services | 2 | $213B |
|
||
| Retail | 2 | $95B |
|
||
| Industrial Conglomerate | 1 | $38B |
|
||
| Metals / Steel | 1 | $35B |
|
||
| Utilities | 1 | $30B |
|
||
| Industrial Machinery | 1 | $19B |
|
||
Price history
+0.0% since first listed2 events — show timeline
- 2026-06-10 Listed $109,000 Triad MLS
- 2026-06-09 Coming Soon $109,000 Triad MLS
Property tax history
+1.8%/yrLatest (2025): $589 · +0.0% YoY. Source: county tax records.
Cash-flow waterfall
monthlySold comps — $/sqft
last 12 mo · ≤1 miLoading sold comps…