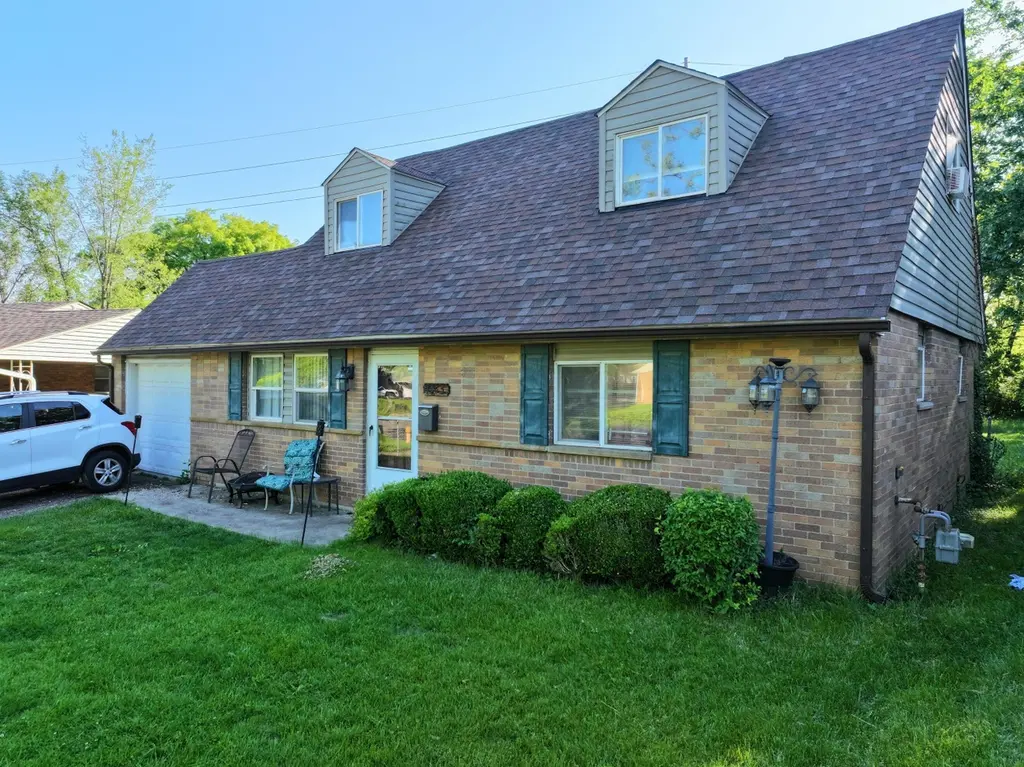
1565 Vilardo Ln · Columbus, OH
Flood risk 1/10 · Minimal
- FEMA flood zone
- X (unshaded)
- Chance of flooding over 30 yrs
- 0.0%
- Est. flood insurance / yr
- $507 – $1,088
Fire risk 1/10 · Minimal
- Est. fire insurance / yr
- $713 – $1,323
Heat risk 4/10 · Minor
- Hot days now (above 99°F)
- 7 days/yr
- Hot days in 30 yrs
- 18 days/yr
Wind risk 2/10 · Minimal
- Chance of severe wind over 30 yrs
- 1.0%
Air-quality risk 2/10 · Minimal
- Unhealthy air days now
- 1 days/yr
- Unhealthy air days in 30 yrs
- 1 days/yr
Risk factors via First Street. Map © Google.
Why this score? — see what drove the C grade
The composite is a weighted blend of 9 inputs, each scored 0–100. Each bar is that input's sub-score; the figure is the points it added to the 100-point composite (weight × sub-score).
- Cash flow +19.5/30.0
- ARV discount +13.9/15.0
- DSCR +6.2/10.0
- 1% rule +5.1/10.0
- Livability +4.0/5.0
- Rent growth +3.8/5.0
- Condition / age +2.5/5.0
- Schools +1.7/10.0
- Appreciation +0.0/10.0
$169,990
🖨 Deal sheet 📄 Offer letter ✓ Due diligence
Listing remarks
Solid 4-bedroom, 1.5-story home in a well-established Columbus neighborhood with a lot of the features buyers are looking for. This single-family property offers a functional layout, 1.5 bathrooms, a large detached garage, and a fully fenced backyard with plenty of room to spread out, entertain, or let pets and kids play freely. The home has a comfortable feel with good usable space both inside and out, while the location keeps you close to everyday conveniences, restaurants, shopping, and major routes around Columbus. Hard to find this combination of lot space, garage size, and bedroom count in a strong area at a reasonable value.
Key facts
- Functional layout
- Detached garage
- 8,712 sq ft lot
Tags
Property features AI
Finance
- Other: Home warranty included
Exterior
- Parking: Attached garage with garage door opener (1 car)
- Utilities: Public water; Public sewer
- Home design: Single-family residence; One-and-a-half story; Built in 1958; No shared/common walls
- Construction: Block foundation
- Exterior features: Patio; Fenced yard; Above-ground pool
Interior
- Bedrooms: Two main-level bedrooms
- Flooring: Wood flooring; Carpeted areas
- Bathrooms: One full bathroom; One half bathroom
- Heating & cooling: Electric heating; Window air conditioning units
- Interior features: Insulated windows throughout; Crawl space basement
Neighborhood map
What this means for you Summary
Snapshot
- This is a 4-bed/1.5-bath single-family listed at $170k.
Deal economics
- At list price, monthly cash flow is $193 ($2k/yr) — positive.
- The deal already cash-flows at list — no discount required.
- Meets the 1% rule at list price ($2k rent vs $170k).
- Cap rate 7.7% vs local median 3.8% in Columbus — top-decile yield for the area; either an underpriced asset or a hidden risk that comps aren't pricing in. Stress-test before assuming the spread holds.
Location & tenants
- Location reads 81/100 on livability (#97 in OH, #1,491 nationally) — a professional / high-income tenant draw. Strengths: commute A+, cost of living A+, housing A+; Watch: employment C-, crime F.
- Columbus City School District (urban): math 15% / reading 26% proficiency, ranked #626 of 656 in OH (top 95%) — low school quality limits family demand, transient renter base, plan for 1-2y turnover; 72% free/reduced lunch — lower-income household profile, screen leases tightly.
- Market conditions: Rents rising fast (+5.2%/yr); 61 active listings in the ZIP; 20 comparable units currently listed for rent nearby; rentals lingering (median 44d on market — plan ~5-8 weeks vacancy on turnover, expect pricing pressure); 55% of comp listings sitting > 30 days — soft ceiling on asking rent; 8,139 units permitted in Franklin County in 2024 (5,940 in 5+ unit buildings).
- This rent runs 43% of the median local income ($48k/yr) — at the standard rent-burdened threshold; future hikes will face affordability resistance.
Forward outlook
- Local home prices are declining (-3.0%/yr); year-one equity from $1k of loan paydown is wiped out by about $5k of value loss. Plan a longer hold.
- Franklin County population projected at +34% by 2050 — long-run rental-demand tailwind backs the buy-and-hold thesis.
Negotiation context
- Only 14 days on market — expect competitive offers; lowballing is unlikely to land.
- 6 sale attempts since 25y ago with the ask held roughly flat each time — persistent listings suggest the price (not the market) is what's stuck; bring a comps-based counter.
- Current owner paid $92k; list at $170k implies a 85% gain — meaningful room to come down on a strong offer.
Risks & watch-outs
- Watch-outs: built in 1958 — expect roof / HVAC / electrical / plumbing capex.
Questions for the listing agent
- Built in 1958 — when were the roof, HVAC, electrical panel, plumbing, and water heater last replaced?
- Is there a deadline driving the sale (1031 exchange, divorce, estate, relocation)? That informs how much negotiation room exists.
- Crime grade is F in this area — have there been break-ins, vandalism, or insurance claims at this property in the last 3 years? What carrier currently insures it and at what premium?
- What's the average days-on-market for RENTAL listings here right now (not sales)? A rising rental-DOM trend means longer vacancies and softer asking-rent achievability than the comps imply.
- What's the recent tenant-quality profile in this submarket — average credit score on applications, eviction rate, late-payment / NSF rate, and stable-employment percentage? A property-management company in the area should have these aggregated.
- How much new for-sale + rental construction is in the pipeline within 1–3 miles? Heavy new supply typically softens prices + rents 12–24 months out; constrained supply supports both.
Investment metrics
- 1% rule
- 1.01% ✓
- Cap rate
- 7.65%
- Cash-on-cash
- 4.86%
- DSCR
- 1.22
- GRM
- 8.3
CMA / ARV
- ARV (median comp)
- $198,266
- List price
- $169,990
- Delta
- -14.26%
- Verdict
- UNDERPRICED
- Comps
- 20 within 1.0 mi
Show comp detail 12 sales within ~0.75 mi
| Address | Dist | Beds/Ba | Sqft | Sold | Price | $/sf | Match |
|---|---|---|---|---|---|---|---|
| 1642 Vilardo Ln | 0.13mi | 4/1.5 | 1,319 (0%) | 0mo | $135,000 | $102 | 94 |
| 1628 Burlington Ave | 0.42mi | 4/1.5 | 1,483 (+12%) | 1mo | $199,000 | $134 | 59 |
| 3566 Seabrook Ave | 0.52mi | 3/2.0 (-1) | 1,364 (+3%) | 6mo | $243,000 | $178 | 58 |
| 3457 Roswell Dr | 0.62mi | 4/2.0 | 1,404 (+6%) | 1mo | $250,000 | $178 | 58 |
| 1254 Elderwood Ave | 0.45mi | 4/1.0 | 1,208 (-8%) | 7mo | $165,000 | $137 | 57 |
| 1693 Gaynor Rd | 0.74mi | 3/1.5 (-1) | 1,320 (+0%) | 7mo | $200,000 | $152 | 55 |
| 1721 Bostwick Rd | 0.22mi | 3/2.0 (-1) | 1,494 (+13%) | 7mo | $265,000 | $177 | 55 |
| 1543 S Hamilton Rd | 0.68mi | 4/2.0 | 1,376 (+4%) | 6mo | $250,000 | $182 | 54 |
| 3945 Dillon Dr | 0.61mi | 4/2.0 | 1,412 (+7%) | 6mo | $235,000 | $166 | 53 |
| 4181 Colby Ave | 0.47mi | 3/1.0 (-1) | 1,182 (-10%) | 4mo | $200,000 | $169 | 50 |
| 1241 Erickson Rd | 0.59mi | 4/2.0 | 1,505 (+14%) | 1mo | $274,900 | $183 | 46 |
| 4297 E Livingston Ave | 0.59mi | 3/1.5 (-1) | 1,484 (+12%) | 8mo | $190,000 | $128 | 40 |
Match score weights: distance 35% · size 25% · config 20% · recency 20%. Top-matched comps best support the ARV.
Projected returns pro-forma
-3.0% appreciation · 5.22% rent growth · sell at horizon
- IRR
- -6.3%
- Equity multiple
- 0.76×
- Total profit
- $-11,329
- Equity at exit
- $25,346
- IRR
- 5.9%
- Equity multiple
- 1.48×
- Total profit
- $22,835
- Equity at exit
- $14,698
Cash invested: $47,597 (down + closing). Projections, not guarantees.
Landlord ↔ Tenant lean methodology
- Overall (STATE)
- 73 Landlord-Friendly
- State Ohio
- 73 Landlord-Friendly · R+6
- County
- — inherits STATE
- City
- — inherits STATE
ZIP-level market 43227
- Rents YoY
- 5.2%
- Active inventory
- 61
- Price-to-rent
- 8.3×
Monthly cashflow live
- Estimated rent
- $1,715 high interval (Pro) →
- Mortgage (P&I)
- −$891
- Tax from tax record
- −$199 /mo · $2,392/yr
- Insurance
- −$71
- HOA
- −$0
- Vacancy / Maint / Mgmt
- −$360
- Net cashflow
- $193
Break-even live
UW: 25.0% down · 7.5% · 30yr · 1.5% tax · 5.0% vac · 8.0% maint · 8.0% mgmt
Financing live
Cash to close
- Down payment
- $42,498
- Closing costs
- $5,100
- Reserves months
- —
- Total cash needed
- —
Loan-product check · same deal, 3 products live
Conventional
25% down · 7.5% · 30yr
- Down + closing
- —
- Monthly P&I
- —
- Monthly cashflow
- —
- DSCR
- —
- Eligible?
- —
Personal DTI + credit; lowest rate.
DSCR
20% down · 8.5% · 30yr
- Down + closing
- —
- Monthly P&I
- —
- Monthly cashflow
- —
- DSCR
- —
- Eligible?
- —
No personal income docs; deal must DSCR.
Hard money
10% down · 12.0% · 12mo
- Down + closing
- —
- Monthly P&I
- —
- Monthly cashflow
- —
- DSCR
- —
- Eligible?
- —
Short-term bridge; refi at stabilization.
Rent comps 20 comps
| Address | Beds | Baths | Sqft | Rent | $/sqft | DOM | Units | Dist |
|---|---|---|---|---|---|---|---|---|
| 4003 Carlton Ave Columbus, OH | 4.0 | 1.0 | 1300 | $1,700 | $1.31 | 44d | 1 | 0.18mi |
| 1665 Elaine Rd Columbus, OH | 3.0 | 1.0 | 1240 | $1,500 | $1.21 | 44d | 1 | 0.29mi |
| 4048 E Livingston Ave Columbus, OH | 3.0 | 1.0 | 961 | $1,000 | $1.04 | 20d | 1 | 0.31mi |
| 1303 Dellwood Ave Columbus, OH | 3.0 | 1.0 | 900 | $1,500 | $1.67 | 44d | 1 | 0.34mi |
| 1246 Arkwood Ave Columbus, OH | 3.0 | 1.0 | 1094 | $1,740 | $1.59 | 44d | 1 | 0.46mi |
| 3486 Roswell Dr Columbus, OH | 3.0 | 2.0 | 1116 | $1,625 | $1.46 | 44d | 1 | 0.59mi |
| 1537 Duffield Dr Columbus, OH | 3.0 | 2.0 | 1020 | $1,500 | $1.47 | 44d | 1 | 0.75mi |
| 3855 E Mound St Columbus, OH | 3.0 | 1.0 | 1476 | $1,885 | $1.28 | 44d | 1 | 0.78mi |
| 1317 Barnett Rd Columbus, OH | 3.0 | 1.0 | 1057 | $1,299 | $1.23 | 12d | 1 | 0.86mi |
| 2233 Courtside Dr Columbus, OH | 3.0 | 1.0 | 812 | $1,167 | $1.44 | 2d | 10 | 1.07mi |
| 3409 Bexvie Ave Columbus, OH | 2.0–3.0 | 1.5 | 990 | $1,400 | $1.41 | 2d | 3 | 1.13mi |
| 1892 Somerset Ct E Columbus, OH | 4.0 | 2.0 | 1300 | $1,725 | $1.33 | 24d | 1 | 1.17mi |
| 4728 E Livingston Ave Columbus, OH | 4.0 | 2.0 | 1638 | $1,935 | $1.18 | 44d | 1 | 1.18mi |
| 1660 Huxley Dr Columbus, OH | 3.0 | 1.0 | 1248 | $1,695 | $1.36 | 8d | 1 | 1.22mi |
| 914 S Weyant Ave Columbus, OH | 3.0 | 1.5 | 1089 | $1,099 | $1.01 | 17d | 1 | 1.22mi |
| 802 Ruby Ave Columbus, OH | 3.0 | 2.0 | 1004 | $1,875 | $1.87 | 44d | 1 | 1.25mi |
| 849 Byron Ave Columbus, OH | 3.0 | 1.5 | 936 | $1,400 | $1.50 | 8d | 1 | 1.25mi |
| 1634 S James Rd Columbus, OH | 3.0 | 1.5 | 1120 | $1,945 | $1.74 | 44d | 1 | 1.32mi |
| 1728 Penfield Rd Columbus, OH | 3.0 | 1.0 | 1224 | $1,925 | $1.57 | 44d | 1 | 1.32mi |
| 925 S Ashburton Rd Columbus, OH | 3.0 | 1.0 | 963 | $1,500 | $1.56 | 24d | 1 | 1.43mi |
Listing history 17 events
-
2026-05-11$173,000 Active 639-char remark
-
2010-10-28soldstatus $92,000
-
2010-09-30historical
-
2010-04-02historical
-
2010-04-02$79,900
-
2008-07-17$84,900
-
2008-04-11soldstatus $41,000
-
2008-02-29historical
-
2008-01-29$44,900
-
2006-01-26soldstatus $122,000
-
2003-05-16historical
-
2002-08-15$105,000
-
2002-01-29soldstatus $58,000
-
2002-01-25soldstatus $58,000
-
2001-11-19historical
-
2001-11-06$64,000
-
1993-05-04soldstatus $56,500
ⓘ Source: listings_history table (triggers on properties + properties_extension) + one-shot
backfill from property_details.listing_events for pre-trigger history.
Tax reassessment forecast OH · Partial reset (capped growth)
- Current annual tax
- $2,392 · $199/mo
- Projected year-2 tax
- $2,522 · $210/mo
- Expected delta
- +$130/yr (+$11/mo · 5.4%)
ⓘ Screening estimate from a state-policy table — verify with the county assessor before closing.
Climate risk First Street
- Flood 1/10 Low FEMA zone X (unshaded) · 0% chance over 30 yrs
- Wildfire 1/10 Low
- Heat 4/10 Moderate 7 d/yr ≥99°F today · 18 d/yr by 30 yrs out
- Wind 2/10 Low 100% chance of damaging wind over 30 yrs
- Air quality 2/10 Low 1 unhealthy d/yr today · 1 by 30 yrs out
Nearby sold comps map
Loading sold comps map…
Walkable amenities ~0.75 mi
Loading nearby amenities…
Taxation est. · year 1
- Rental income
- $20,574
- − Mortgage interest
- −$9,522
- − Property taxes
- −$2,392
- − Insurance
- −$850
- − Repairs & maintenance
- −$1,646
- − Management
- −$1,646
- − Depreciation
- −$4,945
- Taxable loss
- −$427
- Est. tax savings @ 24.0%
- +$102
- After-tax cash flow
- $2,417/yr
For passive investors: Depreciation is non-cash, so a rental often shows a tax loss while cash-flowing — sheltering income. Rental losses are passive: they offset passive income freely, and up to $25,000/yr can offset ordinary (W-2) income if you actively participate and your MAGI is under $100k (phasing out to $0 by $150k); unused losses carry forward. On sale, claimed depreciation is recaptured at up to 25%, and gains may owe capital-gains tax (a 1031 exchange can defer both). Figures are a year-1 estimate at your 24.0% rate — not tax advice; consult a CPA.
Schools (NCES district)
- District
- Columbus City School District
- NCES district ID
- 3904380
- Math proficiency
- 15% ▼ -17.00%
- Reading proficiency
- 26% ▼ -12.00%
- Median HH income
- $38,483
- Composite
- 17.19/100
- National rank
- #9105
- State rank
- #626 of 656 in OH
Livability — Columbus
- Score
- 81/100
- State rank
- #97
- US rank
- #1491
Category grades
Schools grade is shown separately in the Schools card above.
Census & demographics
- Census place
- Columbus, OH
- County
- Franklin County · 1,351,780 people
- City population
- 612,189
- Metro
- Columbus, OH
- Population (ZIP)
- 25,358
- Household income
- $48,159
- Rent vs Own
- Severe rent burden
- 1467.0
Population outlook (Franklin County) Hauer SSP2
- Today (2025)
- 1,456,139 people
- By 2030
- 1,556,890 · +6.9%
- By 2040
- 1,757,349 · +20.7%
- By 2050
- 1,950,539 · +34.0%
- By 2075
- 2,376,171 · +63.2%
- By 2100
- 2,636,796 · +81.1%
Race, ethnicity, and origin ACS 2023
- Neighborhood character
- Majority Black (63%)
- Race & ethnicity
- Black 63% White 23% Hispanic / Latino 9% Two or more races 5%
- Hispanic origin (detail)
- Mexican 3%
- Common ancestry
- Swiss 1% Slovak 1%
- Foreign-born
- 11% · Canada
- Languages at home
- 87% English-only · Spanish 7% French/Haitian/Cajun 1%
Political lean MEDSL · Franklin
- 2024 margin
- Strong D (+28.4) · D 63.7% · R 35.3% · Other 1.0%
- 2008→2024 swing
- +7.7pp toward D · 2008: 20.7pp · 2024: 28.4pp
- All cycles
- 2024: D+28.4 2020: D+31.4 2016: D+25.9 2012: D+21.7 2008: D+20.7
Not yet ingested
- Civics
- —
Market trends
- HPI YoY
- ▼ -193.50%
- Current HPI
- 301.3767
- Rent YoY
- ▲ 5.22%
- Metro
- Columbus, OH
- State GDP YoY
- ▲ 1.98%
- F500 in state
- 48
Industry mix (Fortune 500 HQ in OH)
| Industry | F500 HQs | Revenue |
|---|---|---|
| Insurance | 3 | $145B |
|
||
| Industrial Machinery | 3 | $49B |
|
||
| Financial Services | 3 | $24B |
|
||
| Consumer Goods | 2 | $93B |
|
||
| Aerospace / Defense | 2 | $47B |
|
||
| Utilities | 2 | $33B |
|
||
Price history
+200.9% since first listed19 events — show timeline
- 2026-05-25 Pending — CBRMLS
- 2026-05-19 Price Changed $169,990 CBRMLS
- 2026-05-11 Listed $173,000 CBRMLS
- 2010-10-28 Sold (Public Records) $92,000 Public Records
- 2010-09-30 Listing Removed — CBRMLS
- 2010-04-02 Listed $79,900 CBRMLS
- 2010-04-02 Listing Removed — CBRMLS
- 2008-07-17 Listed $84,900 CBRMLS
- 2008-04-11 Sold (MLS) $41,000 CBRMLS
- 2008-02-29 Listing Removed — CBRMLS
- 2008-01-29 Listed $44,900 CBRMLS
- 2006-01-26 Sold (Public Records) $122,000 Public Records
- 2003-05-16 Listing Removed — CBRMLS
- 2002-08-15 Listed $105,000 CBRMLS
- 2002-01-29 Sold (Public Records) $58,000 Public Records
- 2002-01-25 Sold (MLS) $58,000 CBRMLS
- 2001-11-19 Listing Removed — CBRMLS
- 2001-11-06 Listed $64,000 CBRMLS
- 1993-05-04 Sold (Public Records) $56,500 Public Records
Property tax history
+4.9%/yrLatest (2024): $2,392 · +1.3% YoY. Source: county tax records.
Cash-flow waterfall
monthlySold comps — $/sqft
last 12 mo · ≤1 miLoading sold comps…