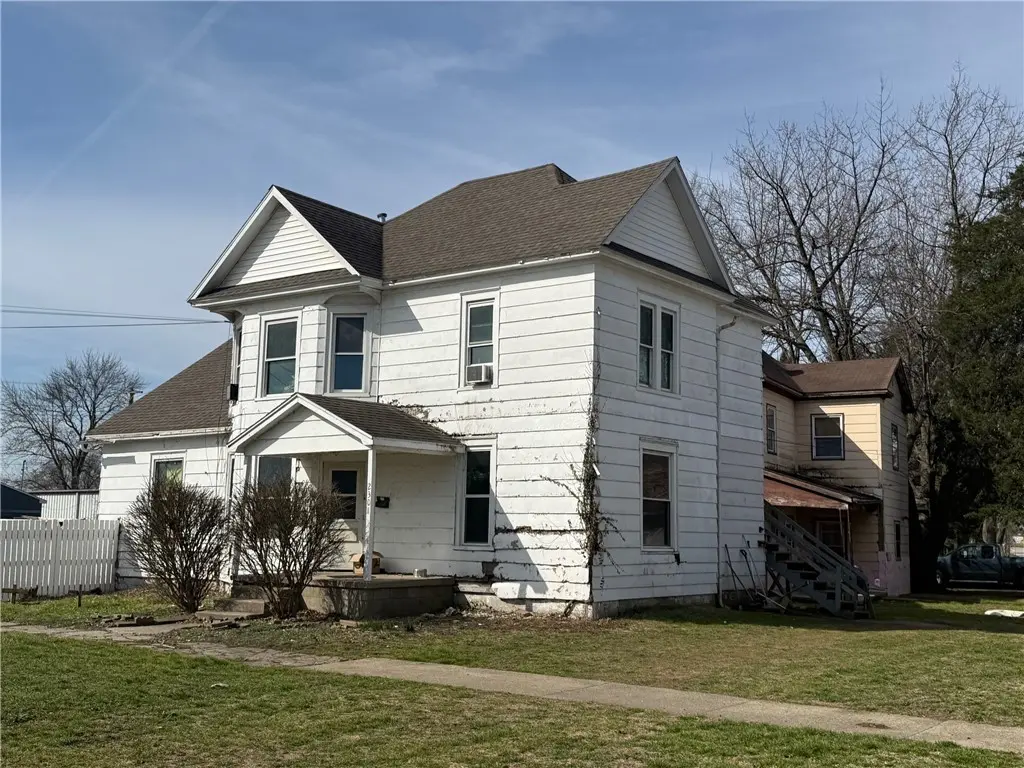
2301 Charleston Ave · Mattoon, IL
Flood risk 1/10 · Minimal
- FEMA flood zone
- X (unshaded)
- Chance of flooding over 30 yrs
- 0.0%
- Est. flood insurance / yr
- $473 – $860
Fire risk 1/10 · Minimal
- Est. fire insurance / yr
- $804 – $1,492
Heat risk 4/10 · Minor
- Hot days now (above 104°F)
- 7 days/yr
- Hot days in 30 yrs
- 19 days/yr
Wind risk 2/10 · Minimal
- Chance of severe wind over 30 yrs
- 1.0%
Air-quality risk 2/10 · Minimal
- Unhealthy air days now
- 1 days/yr
- Unhealthy air days in 30 yrs
- 2 days/yr
Risk factors via First Street. Map © Google.
Why this score? — see what drove the B- grade
The composite is a weighted blend of 9 inputs, each scored 0–100. Each bar is that input's sub-score; the figure is the points it added to the 100-point composite (weight × sub-score).
- Cash flow +30.0/30.0
- 1% rule +10.0/10.0
- DSCR +10.0/10.0
- ARV discount +7.5/15.0
- Livability +3.2/5.0
- Rent growth +2.5/5.0
- Condition / age +2.5/5.0
- Schools +1.6/10.0
- Appreciation +0.0/10.0
$33,500
🖨 Deal sheet 📄 Offer letter ✓ Due diligence
Listing remarks
Looking for an income producing property? This is the one for you! It is a 2-unit building with some updating needed but priced to sell! Call us today to schedule your showing.
Key facts
- 4,792 sq ft lot
- Built 1900
- Listed 55 days
Property features AI
Finance
- Financial info: Annual tax amount listed
Exterior
- Utilities: Public water; Public sewer
- Home design: Duplex residential income property; Two-story
- Exterior features: Shingle roof; Lot approximately 0.11 acres; Zoned MLT
Interior
- Heating & cooling: Natural gas heating; No cooling
- Interior features: Gas water heater
Neighborhood map
What this means for you Summary
Snapshot
- This is a 6-bed/3.0-bath single-family listed at $34k.
Deal economics
- At list price, monthly cash flow is $591 ($7k/yr) — positive.
- The deal already cash-flows at list — no discount required.
- Meets the 1% rule at list price ($1k rent vs $34k).
- Recommended offer: $32k (3.0% below list) — sets the bar for market timing.
- Cap rate 27.5% vs local median 3.6% in Mattoon — top-decile yield for the area; either an underpriced asset or a hidden risk that comps aren't pricing in. Stress-test before assuming the spread holds.
Location & tenants
- Location reads 64/100 on livability (#706 in IL) — a middle-class / working-renter tenant base. Strengths: cost of living A+, housing A+; Watch: crime D, schools D-, amenities F.
- Mattoon CUSD 2 (town): math 13% / reading 24% proficiency, ranked #462 of 620 in IL (top 74%) — low school quality limits family demand, transient renter base, plan for 1-2y turnover.
- Market conditions: 117 active listings in the ZIP; 34 units permitted in Coles County in 2024 (30 in 5+ unit buildings).
Forward outlook
- Local home prices are declining (-3.0%/yr); year-one equity from $232 of loan paydown is wiped out by about $1k of value loss. Plan a longer hold.
- Coles County population projected to shrink 7% by 2050 — rents likely to lag national; underwrite the cash flow, not the appreciation.
- At projected returns (-3.0% appreciation + 3.0% rent growth), your $9k cash investment doubles in ~2 years — after that, you're playing with house money.
Negotiation context
- It's been on market 56 days — a 3% lower offer ($32k) is reasonable based on typical stale-listing flexibility.
- 3 sale attempts; this cycle's ask has dropped $16k (33%) from the opening price — seller is motivated, your offer sets the floor, not the list.
Risks & watch-outs
- Watch-outs: property tax is 3.9% of price; built in 1900 — expect roof / HVAC / electrical / plumbing capex.
Questions for the listing agent
- It's been on market 56 days. Have you received any prior offers? Is the seller open to a 3% concession, seller financing, or rate buy-down credit?
- Built in 1900 — when were the roof, HVAC, electrical panel, plumbing, and water heater last replaced?
- Property tax is high relative to price — has the assessment been appealed recently, and will the sale trigger a re-assessment?
- Is there a deadline driving the sale (1031 exchange, divorce, estate, relocation)? That informs how much negotiation room exists.
- Schools are D-rated, which usually means shorter tenancies and higher turnover. Who's the typical renter profile here, and what's been the actual vacancy rate?
- Crime grade is D in this area — have there been break-ins, vandalism, or insurance claims at this property in the last 3 years? What carrier currently insures it and at what premium?
- What's the average days-on-market for RENTAL listings here right now (not sales)? A rising rental-DOM trend means longer vacancies and softer asking-rent achievability than the comps imply.
- What's the recent tenant-quality profile in this submarket — average credit score on applications, eviction rate, late-payment / NSF rate, and stable-employment percentage? A property-management company in the area should have these aggregated.
- How much new for-sale + rental construction is in the pipeline within 1–3 miles? Heavy new supply typically softens prices + rents 12–24 months out; constrained supply supports both.
Investment metrics
- 1% rule
- 3.37% ✓
- Cap rate
- 27.48%
- Cash-on-cash
- 75.66%
- DSCR
- 4.37
- GRM
- 2.5
CMA / ARV
- ARV (on-the-fly)
- $193,224
- Comps found
- 3
Show comp detail 3 sales within ~0.75 mi
| Address | Dist | Beds/Ba | Sqft | Sold | Price | $/sf | Match |
|---|---|---|---|---|---|---|---|
| 2421 Western Ave | 0.22mi | 5/2.5 (-1) | 2,252 (-3%) | 17mo | $173,900 | $77 | 63 |
| 2316 Western Ave | 0.22mi | 5/2.0 (-1) | 2,178 (-6%) | 13mo | $219,500 | $101 | 59 |
| 2521 Western Ave | 0.27mi | 5/2.0 (-1) | 2,456 (+6%) | 13mo | $203,000 | $83 | 59 |
Match score weights: distance 35% · size 25% · config 20% · recency 20%. Top-matched comps best support the ARV.
Projected returns pro-forma
-3.0% appreciation · 3.0% rent growth · sell at horizon
- IRR
- 75.6%
- Equity multiple
- 4.44×
- Total profit
- $32,296
- Equity at exit
- $4,995
- IRR
- 79.3%
- Equity multiple
- 9.19×
- Total profit
- $76,861
- Equity at exit
- $2,896
Cash invested: $9,380 (down + closing). Projections, not guarantees.
Landlord ↔ Tenant lean methodology
- Overall (STATE)
- 43 Moderately Tenant-Leaning
- State Illinois
- 43 Moderately Tenant-Leaning · D+7
- County
- — inherits STATE
- City
- — inherits STATE
ZIP-level market 61938
- Active inventory
- 117
- Price-to-rent
- 2.5×
Monthly cashflow live
- Estimated rent
- $1,127 medium interval (Pro) →
- Mortgage (P&I)
- −$176
- Tax from tax record
- −$110 /mo · $1,315/yr
- Insurance
- −$14
- HOA
- −$0
- Vacancy / Maint / Mgmt
- −$237
- Net cashflow
- $591
Break-even live
UW: 25.0% down · 7.5% · 30yr · 1.5% tax · 5.0% vac · 8.0% maint · 8.0% mgmt
Financing live
Cash to close
- Down payment
- $8,375
- Closing costs
- $1,005
- Reserves months
- —
- Total cash needed
- —
Loan-product check · same deal, 3 products live
Conventional
25% down · 7.5% · 30yr
- Down + closing
- —
- Monthly P&I
- —
- Monthly cashflow
- —
- DSCR
- —
- Eligible?
- —
Personal DTI + credit; lowest rate.
DSCR
20% down · 8.5% · 30yr
- Down + closing
- —
- Monthly P&I
- —
- Monthly cashflow
- —
- DSCR
- —
- Eligible?
- —
No personal income docs; deal must DSCR.
Hard money
10% down · 12.0% · 12mo
- Down + closing
- —
- Monthly P&I
- —
- Monthly cashflow
- —
- DSCR
- —
- Eligible?
- —
Short-term bridge; refi at stabilization.
Listing history 24 events
-
2026-06-19days on market $33,500 Active 56 DOM
-
2026-06-18days on market $33,500 Active 55 DOM
-
2026-06-17days on market $33,500 Active 54 DOM
-
2026-06-16days on market $33,500 Active 53 DOM
-
2026-06-15days on market $33,500 Active 52 DOM
-
2026-06-14days on market $33,500 Active 50 DOM
-
2026-06-12days on market $33,500 Active 49 DOM
-
2026-06-09days on market $33,500 Active 46 DOM
-
2026-06-08days on market $33,500 Active 45 DOM
-
2026-06-07days on market $33,500 Active 44 DOM
-
2026-06-03days on market $33,500 Active 40 DOM
-
2026-06-02days on market $33,500 Active 39 DOM
-
2026-06-01days on market $33,500 Active 38 DOM
-
2026-05-31days on market $33,500 Active 37 DOM
-
2026-05-30days on market $33,500 Active 36 DOM
-
2026-05-22status Active
-
2026-05-22price $33,500
-
2026-04-22status Pending
-
2026-04-09price $39,900
-
2026-03-20$49,900 Active
-
2025-12-12price $52,000
-
2025-11-24$67,000 Active
-
2020-10-01historical
-
2005-03-26historical
ⓘ Source: listings_history table (triggers on properties + properties_extension) + one-shot
backfill from property_details.listing_events for pre-trigger history.
Tax reassessment forecast IL · Partial reset (capped growth)
- Current annual tax
- $1,315 · $110/mo
- Projected year-2 tax
- $1,315 · $110/mo
- Expected delta
- $0/yr ($0/mo · 0.0%)
ⓘ Screening estimate from a state-policy table — verify with the county assessor before closing.
Climate risk First Street
- Flood 1/10 Low FEMA zone X (unshaded) · 0% chance over 30 yrs
- Wildfire 1/10 Low
- Heat 4/10 Moderate 7 d/yr ≥104°F today · 19 d/yr by 30 yrs out
- Wind 2/10 Low 100% chance of damaging wind over 30 yrs
- Air quality 2/10 Low 1 unhealthy d/yr today · 2 by 30 yrs out
Nearby sold comps map
Loading sold comps map…
Walkable amenities ~0.75 mi
Loading nearby amenities…
Taxation est. · year 1
- Rental income
- $13,528
- − Mortgage interest
- −$1,877
- − Property taxes
- −$1,315
- − Insurance
- −$168
- − Repairs & maintenance
- −$1,082
- − Management
- −$1,082
- − Depreciation
- −$975
- Taxable income
- $7,030
- Est. tax owed @ 24.0%
- −$1,687
- After-tax cash flow
- $5,409/yr
For passive investors: Depreciation is non-cash, so a rental often shows a tax loss while cash-flowing — sheltering income. Rental losses are passive: they offset passive income freely, and up to $25,000/yr can offset ordinary (W-2) income if you actively participate and your MAGI is under $100k (phasing out to $0 by $150k); unused losses carry forward. On sale, claimed depreciation is recaptured at up to 25%, and gains may owe capital-gains tax (a 1031 exchange can defer both). Figures are a year-1 estimate at your 24.0% rate — not tax advice; consult a CPA.
Schools (NCES district)
- District
- Mattoon CUSD 2
- NCES district ID
- 1725050
- Math proficiency
- 13% ▼ -9.00%
- Reading proficiency
- 24% ▼ -12.00%
- Median HH income
- $40,452
- Composite
- 15.71/100
- National rank
- #9280
- State rank
- #462 of 620 in IL
Livability — Mattoon
- Score
- 64/100
- State rank
- #706
- US rank
- #14352
Category grades
Schools grade is shown separately in the Schools card above.
Census & demographics
- Census place
- Mattoon, IL
- County
- Coles County · 41,301 people
- City population
- 20,350
- Metro
- Charleston-Mattoon, IL
- Population (ZIP)
- 20,350
- Household income
- $57,503
- Rent vs Own
- Severe rent burden
- 453.0
Population outlook (Coles County) Hauer SSP2
- Today (2025)
- 53,967 people
- By 2030
- 53,829 · -0.3%
- By 2040
- 52,332 · -3.0%
- By 2050
- 49,989 · -7.4%
- By 2075
- 42,226 · -21.8%
- By 2100
- 34,675 · -35.7%
Race, ethnicity, and origin ACS 2023
- Neighborhood character
- Predominantly White (91%)
- Race & ethnicity
- White 91% Two or more races 5% Hispanic / Latino 3% Black 2%
- Common ancestry
- Italian 2% Slovak 2% Serbian 1%
- Foreign-born
- 1%
- Languages at home
- 97% English-only · Spanish 1% German/W. Germanic 1%
Political lean MEDSL · Coles
- 2024 margin
- Strong R (+28.5) · D 34.9% · R 63.4% · Other 1.7%
- 2008→2024 swing
- -31.7pp toward R · 2008: 3.2pp · 2024: -28.5pp
- All cycles
- 2024: R+28.5 2020: R+26.4 2016: R+26.4 2012: R+11.1 2008: D+3.2
Not yet ingested
- Civics
- —
Market trends
- HPI YoY
- ▼ -103.29%
- Current HPI
- 133.8791
- Rent YoY
- —
- Metro
- Charleston-Mattoon, IL
- State GDP YoY
- ▲ 1.59%
- F500 in state
- 60
Industry mix (Fortune 500 HQ in IL)
| Industry | F500 HQs | Revenue |
|---|---|---|
| Insurance | 4 | $201B |
|
||
| Consumer Goods | 4 | $87B |
|
||
| Industrial Machinery | 3 | $64B |
|
||
| Healthcare | 2 | $55B |
|
||
| Retail / Pharmacy | 1 | $148B |
|
||
| Agriculture / Food | 1 | $86B |
|
||
Price history
-50.0% since first listed9 events — show timeline
- 2026-05-22 Relisted — CIBR
- 2026-05-22 Price Changed $33,500 CIBR
- 2026-04-22 Pending — CIBR
- 2026-04-09 Price Changed $39,900 CIBR
- 2026-03-20 Listed $49,900 CIBR
- 2025-12-12 Price Changed $52,000 CIBR
- 2025-11-24 Listed $67,000 CIBR
- 2020-10-01 Listing Removed — MRED as Distributed by MLS Grid
- 2005-03-26 Listing Removed — MRED as Distributed by MLS Grid
Property tax history
+2.0%/yrLatest (2024): $1,315 · +12.9% YoY. Source: county tax records.
Cash-flow waterfall
monthlySold comps — $/sqft
last 12 mo · ≤1 miLoading sold comps…