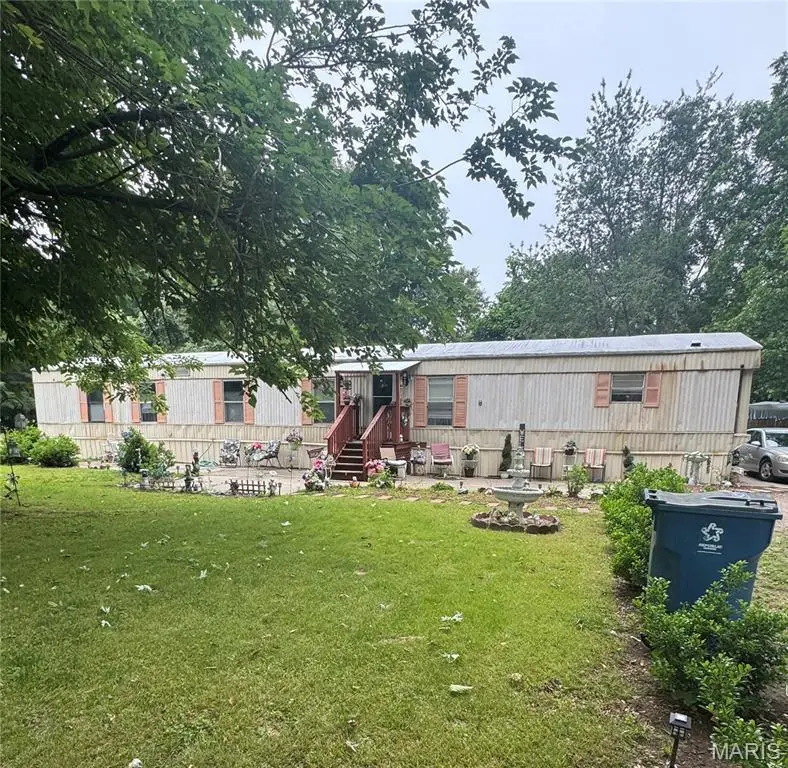
203 N Jobe Dr · Bertrand, MO
Flood risk 4/10 · Minor
- FEMA flood zone
- X (shaded)
- Chance of flooding over 30 yrs
- 0.2%
- Est. flood insurance / yr
- $507 – $1,088
Fire risk 1/10 · Minimal
- Est. fire insurance / yr
- $1,054 – $1,958
Heat risk 6/10 · Moderate
- Hot days now (above 109°F)
- 7 days/yr
- Hot days in 30 yrs
- 21 days/yr
Wind risk 3/10 · Minor
- Chance of severe wind over 30 yrs
- 6.0%
Air-quality risk 3/10 · Minor
- Unhealthy air days now
- 3 days/yr
- Unhealthy air days in 30 yrs
- 3 days/yr
Risk factors via First Street. Map © Google.
Why this score? — see what drove the B+ grade
The composite is a weighted blend of 9 inputs, each scored 0–100. Each bar is that input's sub-score; the figure is the points it added to the 100-point composite (weight × sub-score).
- Cash flow +30.0/30.0
- ARV discount +15.0/15.0
- 1% rule +10.0/10.0
- DSCR +10.0/10.0
- Appreciation +5.8/10.0
- Livability +2.8/5.0
- Rent growth +2.5/5.0
- Condition / age +2.2/5.0
- Schools +1.3/10.0
$59,900
🖨 Deal sheet 📄 Offer letter ✓ Due diligence
Listing remarks MLS
Nice mobile home in residential area. Home has been been well maintained. Three bedrooms and two baths. Double closets in master bedroom. Large lot with lots of shade trees. Back yard has privacy fence. Deck in back. Storage shed stays. Large kitchen with lots of cabinets. Snack bar. Stove and refrigerator stay.
Key facts
- Double closets
- Shade trees
- Large lot
Tags
Neighborhood map
What this means for you Summary
Snapshot
- This is a 3-bed/2.0-bath manufactured listed at $60k. Condition is rated fair.
Deal economics
- At list price, monthly cash flow is $420 ($5k/yr) — positive.
- The deal already cash-flows at list — no discount required.
- Meets the 1% rule at list price ($1k rent vs $60k).
- Recommended offer: $59k (1.5% below list) — sets the bar for market timing.
Location & tenants
- Location reads 55/100 on livability (#748 in MO) — a working-class tenant base; expect higher turnover. Strengths: cost of living A+, housing A+; Watch: employment D, schools F, crime F.
- Charleston R-I (town): math 11% / reading 23% proficiency, ranked #310 of 324 in MO (top 96%) — low school quality limits family demand, transient renter base, plan for 1-2y turnover; 78% free/reduced lunch — lower-income household profile, screen leases tightly.
- Market conditions: 11 active listings in the ZIP; 7 units permitted in Mississippi County in 2024 (0 in 5+ unit buildings).
Forward outlook
- In year one you build about $1k of equity ($414 loan paydown + $993 appreciation (1.7% local appreciation)).
- Mississippi County population projected to shrink 9% by 2050 — rents likely to lag national; underwrite the cash flow, not the appreciation.
- At projected returns (1.7% appreciation + 3.0% rent growth), your $17k cash investment doubles in ~3 years — after that, you're playing with house money.
Negotiation context
- It's been on market 22 days — a 2% lower offer ($59k) is reasonable based on typical stale-listing flexibility.
Risks & watch-outs
- Climate carrying-cost: extreme-heat days projected 7→21/yr by 2055 (HVAC capex compounding) — expect insurance premiums to compound above CPI over the hold.
Questions for the listing agent
- Have any recent inspections been done? Can we get a copy of the seller's disclosures and any deferred-maintenance estimates?
- Is there a deadline driving the sale (1031 exchange, divorce, estate, relocation)? That informs how much negotiation room exists.
- Schools are F-rated, which usually means shorter tenancies and higher turnover. Who's the typical renter profile here, and what's been the actual vacancy rate?
- Crime grade is F in this area — have there been break-ins, vandalism, or insurance claims at this property in the last 3 years? What carrier currently insures it and at what premium?
- What's the average days-on-market for RENTAL listings here right now (not sales)? A rising rental-DOM trend means longer vacancies and softer asking-rent achievability than the comps imply.
- What's the recent tenant-quality profile in this submarket — average credit score on applications, eviction rate, late-payment / NSF rate, and stable-employment percentage? A property-management company in the area should have these aggregated.
- How much new for-sale + rental construction is in the pipeline within 1–3 miles? Heavy new supply typically softens prices + rents 12–24 months out; constrained supply supports both.
Investment metrics
- 1% rule
- 1.76% ✓
- Cap rate
- 14.72%
- Cash-on-cash
- 30.08%
- DSCR
- 2.34
- GRM
- 4.7
CMA / ARV
- ARV (on-the-fly)
- $119,040
- Comps found
- 1
Show comp detail 1 sale within ~0.75 mi
| Address | Dist | Beds/Ba | Sqft | Sold | Price | $/sf | Match |
|---|---|---|---|---|---|---|---|
| 302 W Cedar St | 0.58mi | 3/2.0 | 1,188 (-7%) | 10mo | $110,000 | $93 | 53 |
Match score weights: distance 35% · size 25% · config 20% · recency 20%. Top-matched comps best support the ARV.
Projected returns pro-forma
1.66% appreciation · 3.0% rent growth · sell at horizon
- IRR
- 33.6%
- Equity multiple
- 2.78×
- Total profit
- $29,870
- Equity at exit
- $22,528
- IRR
- 35.2%
- Equity multiple
- 5.43×
- Total profit
- $74,280
- Equity at exit
- $31,617
Cash invested: $16,772 (down + closing). Projections, not guarantees.
Landlord ↔ Tenant lean methodology
- Overall (STATE)
- 81 Strongly Landlord-Friendly
- State Missouri
- 81 Strongly Landlord-Friendly · R+10
- County
- — inherits STATE
- City
- — inherits STATE
ZIP-level market 63823
- Home prices YoY
- 1.8%
- Active inventory
- 11
- Price-to-rent
- 4.7×
Monthly cashflow live
- Estimated rent
- $1,056 medium interval (Pro) →
- Mortgage (P&I)
- −$314
- Tax est. 1.5%
- −$75 /mo · $898/yr
- Insurance
- −$25
- HOA
- −$0
- Vacancy / Maint / Mgmt
- −$222
- Net cashflow
- $420
Break-even live
UW: 25.0% down · 7.5% · 30yr · 1.5% tax · 5.0% vac · 8.0% maint · 8.0% mgmt
Financing live
Cash to close
- Down payment
- $14,975
- Closing costs
- $1,797
- Reserves months
- —
- Total cash needed
- —
Loan-product check · same deal, 3 products live
Conventional
25% down · 7.5% · 30yr
- Down + closing
- —
- Monthly P&I
- —
- Monthly cashflow
- —
- DSCR
- —
- Eligible?
- —
Personal DTI + credit; lowest rate.
DSCR
20% down · 8.5% · 30yr
- Down + closing
- —
- Monthly P&I
- —
- Monthly cashflow
- —
- DSCR
- —
- Eligible?
- —
No personal income docs; deal must DSCR.
Hard money
10% down · 12.0% · 12mo
- Down + closing
- —
- Monthly P&I
- —
- Monthly cashflow
- —
- DSCR
- —
- Eligible?
- —
Short-term bridge; refi at stabilization.
Listing history 15 events
-
2026-06-18days on market $59,900 Active 22 DOM
-
2026-06-17days on market $59,900 Active 21 DOM
-
2026-06-16days on market $59,900 Active 20 DOM
-
2026-06-15days on market $59,900 Active 19 DOM
-
2026-06-13days on market $59,900 Active 17 DOM
-
2026-06-12days on market $59,900 Active 16 DOM
-
2026-06-09days on market $59,900 Active 13 DOM
-
2026-06-08days on market $59,900 Active 12 DOM
-
2026-06-07days on market $59,900 Active 11 DOM
-
2026-06-05days on market $59,900 Active 9 DOM
-
2026-06-04days on market $59,900 Active 7 DOM
-
2026-06-02days on market $59,900 Active 6 DOM
-
2026-06-01days on market $59,900 Active 5 DOM
-
2026-05-31days on market $59,900 Active 4 DOM
-
2026-05-27$59,900 Active 315-char remark
Show marketing remark (315 chars)
Nice mobile home in residential area. Home has been been well maintained. Three bedrooms and two baths. Double closets in master bedroom. Large lot with lots of shade trees. Back yard has privacy fence. Deck in back. Storage shed stays. Large kitchen with lots of cabinets. Snack bar. Stove and refrigerator stay.
ⓘ Source: listings_history table (triggers on properties + properties_extension) + one-shot
backfill from property_details.listing_events for pre-trigger history.
Climate risk First Street
- Flood 4/10 Moderate FEMA zone X (shaded) · 20% chance over 30 yrs
- Wildfire 1/10 Low
- Heat 6/10 Major 7 d/yr ≥109°F today · 21 d/yr by 30 yrs out
- Wind 3/10 Moderate 6% chance of damaging wind over 30 yrs
- Air quality 3/10 Moderate 3 unhealthy d/yr today · 3 by 30 yrs out
Nearby sold comps map
Loading sold comps map…
Walkable amenities ~0.75 mi
Loading nearby amenities…
Taxation est. · year 1
- Rental income
- $12,675
- − Mortgage interest
- −$3,355
- − Property taxes
- −$898
- − Insurance
- −$300
- − Repairs & maintenance
- −$1,014
- − Management
- −$1,014
- − Depreciation
- −$1,743
- Taxable income
- $4,351
- Est. tax owed @ 24.0%
- −$1,044
- After-tax cash flow
- $4,001/yr
For passive investors: Depreciation is non-cash, so a rental often shows a tax loss while cash-flowing — sheltering income. Rental losses are passive: they offset passive income freely, and up to $25,000/yr can offset ordinary (W-2) income if you actively participate and your MAGI is under $100k (phasing out to $0 by $150k); unused losses carry forward. On sale, claimed depreciation is recaptured at up to 25%, and gains may owe capital-gains tax (a 1031 exchange can defer both). Figures are a year-1 estimate at your 24.0% rate — not tax advice; consult a CPA.
Condition & rehab AI · 12 photos
This mobile home requires moderate repairs to the roof and siding, along with updates to the interior walls, flooring, and kitchen and bathroom fixtures to improve its resale and rental value.
Repairs flagged
- Moderate siding — visible rust
- Moderate roof — visible wear
Value-add opportunities
- Resale paint interior walls — fresh paint enhances curb appeal
- Resale update flooring — new flooring improves aesthetics
- Resale update kitchen cabinets — new cabinets modernize the space
- Resale update bathroom fixtures — new fixtures enhance functionality and aesthetics
Renovation cost estimate screening
| Repair item | Severity | Est. cost |
|---|---|---|
| siding · visible rust | Moderate | $3,000–15,000 |
| roof · visible wear | Moderate | $3,000–15,000 |
| Total estimated repair cost · 2 items | $6,000–30,000 |
Value-add ROI direction
- Resale paint interior walls — fresh paint enhances curb appeal ↑
- Resale update flooring — new flooring improves aesthetics ↑
- Resale update kitchen cabinets — new cabinets modernize the space ↑
- Resale update bathroom fixtures — new fixtures enhance functionality and aesthetics ↑
ⓘ Cost ranges are severity-bucket heuristics (US national rule-of-thumb). Get contractor quotes + a written scope before underwriting a rehab budget.
Schools (NCES district)
- District
- Charleston R-I
- NCES district ID
- 2908670
- Math proficiency
- 11% ▲ 2.00%
- Reading proficiency
- 23% ▼ -1.00%
- Median HH income
- $29,019
- Composite
- 13.37/100
- National rank
- #9531
- State rank
- #310 of 324 in MO
Livability — Bertrand
- Score
- 55/100
- State rank
- #748
- US rank
- #23403
Category grades
Schools grade is shown separately in the Schools card above.
Census & demographics
- Census place
- Bertrand, MO
- Population (ZIP)
- 1,431
Population outlook (Mississippi County) Hauer SSP2
- Today (2025)
- 13,403 people
- By 2030
- 13,101 · -2.3%
- By 2040
- 12,626 · -5.8%
- By 2050
- 12,233 · -8.7%
- By 2075
- 10,704 · -20.1%
- By 2100
- 8,345 · -37.7%
Race, ethnicity, and origin ACS 2023
- Neighborhood character
- Predominantly White (84%)
- Race & ethnicity
- White 84% Two or more races 10% Hispanic / Latino 5% Black 4%
- Common ancestry
- Iranian 2% Romanian 2% Serbian 1%
- Languages at home
- 99% English-only · French/Haitian/Cajun 1%
Political lean MEDSL · Mississippi
- 2024 margin
- Solid R (+53.7) · D 22.8% · R 76.5%
- 2008→2024 swing
- -39.0pp toward R · 2008: -14.7pp · 2024: -53.7pp
- All cycles
- 2024: R+53.7 2020: R+49.6 2016: R+41.5 2012: R+23.2 2008: R+14.7
Not yet ingested
- Civics
- —
Market trends
- HPI YoY
- ▲ 1.66%
- Current HPI
- 92.5943
- Rent YoY
- —
- Metro
- —
- State GDP YoY
- ▲ 1.84%
- F500 in state
- 20
Industry mix (Fortune 500 HQ in MO)
| Industry | F500 HQs | Revenue |
|---|---|---|
| Healthcare | 1 | $163B |
|
||
| Insurance | 1 | $21B |
|
||
| Industrial Technology | 1 | $17B |
|
||
| Retail | 1 | $16B |
|
||
| Industrial Distribution | 1 | $10B |
|
||
| Utilities | 1 | $9B |
|
||
Price history
1 event — show timeline
- 2026-05-27 Listed $59,900 MARIS as Distributed by MLS Grid
Cash-flow waterfall
monthlySold comps — $/sqft
last 12 mo · ≤1 miLoading sold comps…