 🏷️ Likely Rental
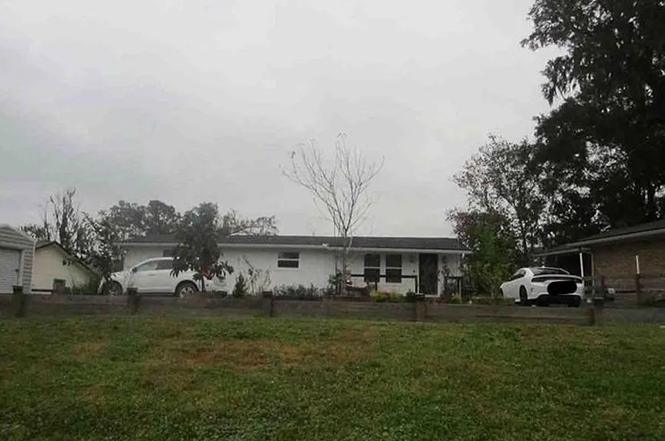
2011 Cornell Rd · Middleburg, FL
Flood risk 6/10 · Moderate
- FEMA flood zone
- AE
- Chance of flooding over 30 yrs
- 0.27%
- Est. flood insurance / yr
- $1,737 – $8,500
Fire risk 4/10 · Minor
- Est. fire insurance / yr
- $947 – $1,759
Heat risk 8/10 · Major
- Hot days now (above 108°F)
- 7 days/yr
- Hot days in 30 yrs
- 19 days/yr
Wind risk 9/10 · Severe
- Chance of severe wind over 30 yrs
- 99.0%
Air-quality risk 3/10 · Minor
- Unhealthy air days now
- 3 days/yr
- Unhealthy air days in 30 yrs
- 3 days/yr
Risk factors via First Street. Map © Google.
Why this score? — see what drove the D+ grade
The composite is a weighted blend of 9 inputs, each scored 0–100. Each bar is that input's sub-score; the figure is the points it added to the 100-point composite (weight × sub-score).
- Cash flow +15.0/30.0
- ARV discount +7.5/15.0
- Schools +5.1/10.0
- 1% rule +5.0/10.0
- DSCR +5.0/10.0
- Rent growth +3.3/5.0
- Livability +3.2/5.0
- Condition / age +2.5/5.0
- Appreciation +0.0/10.0
$5,000
🖨 Deal sheet 📄 Offer letter ✓ Due diligence
Listing remarks MLS
Don't miss this rare opportunity! It doesn't get any better than having your boat ready for its next voyage just steps away in the boathouse which features a power lift of up to 7500 lbs., fresh water & electricity. This deep waterfront home has been beautifully updated & is turn key ready! Prepare to be impressed upon entering the open concept floor plan with water views from nearly every room! The kitchen has a large island highlighted with modern cabinetry, SS appliances & gorgeous granite counters! Custom light fixtures can be found throughout! The primary suite incudes his & her infinity mirrored dual vanities & a custom tiled tub/shower combo. The lower level offers 2 bedrooms separated by a Jack & Jill bath. Additional flex space could easily convert to a 5th bedroom. There is ample space to entertain outside with a large deck & covered porch on the lower level. Imagine sitting on the upper deck relaxing with a cold beverage as you enjoy the view of Black Creek!
Key facts
- 9,583 sq ft lot
- Built 1977
- Listed 2 days
Property features AI
Finance
- Other: Zoning: AR-2; Lot frontage approximately 68 feet; Lot size approximately 0.22 acres
Exterior
- Parking: Driveway; On-street parking
- Utilities: Other water source; Other sewer
- Home design: Single-family residence; One level; Residential property
- Construction: Construction details: see remarks; Other roof
- Exterior features: Front porch
Interior
- Bedrooms: Total of 1 room
- Flooring: Other flooring
- Bathrooms: 3 full bathrooms
- Heating & cooling: No heating; No cooling
- Interior features: Other flooring
Neighborhood map
What this means for you Summary
Snapshot
- This is a 4-bed/3.0-bath single-family listed at $5k.
Deal economics
- At list price, monthly cash flow is $2k ($19k/yr) — positive.
- The deal already cash-flows at list — no discount required.
- Meets the 1% rule at list price ($3k rent vs $5k).
- Cap rate 481.2% vs local median 3.8% in Middleburg — top-decile yield for the area; either an underpriced asset or a hidden risk that comps aren't pricing in. Stress-test before assuming the spread holds.
Location & tenants
- Location reads 65/100 on livability (#657 in FL) — a middle-class / working-renter tenant base. Strengths: cost of living A+, housing A+; Watch: amenities F, commute F, health & safety F.
- Clay (suburban): math 58% / reading 59% proficiency, ranked #14 of 73 in FL (top 19%) — acceptable for families but not a draw, mixed tenant base, ~2y average lease.
- Market conditions: Rents rising (+3.4%/yr); 601 active listings in the ZIP; 2 comparable units currently listed for rent nearby; solid renter incomes; 1,876 units permitted in Clay County in 2024 (14 in 5+ unit buildings).
- This rent runs 36% of the median local income ($84k/yr) — at the standard rent-burdened threshold; future hikes will face affordability resistance.
Forward outlook
- Local home prices are declining (-3.0%/yr); year-one equity from $35 of loan paydown is wiped out by about $150 of value loss. Plan a longer hold.
- Clay County population projected at +19% by 2050 — long-run rental-demand tailwind backs the buy-and-hold thesis.
- At projected returns (-3.0% appreciation + 3.4% rent growth), your $1k cash investment doubles in ~1 year — after that, you're playing with house money.
Negotiation context
- Only 2 days on market — expect competitive offers; lowballing is unlikely to land.
- 8 sale attempts since 8y ago with the ask held roughly flat each time — persistent listings suggest the price (not the market) is what's stuck; bring a comps-based counter.
Risks & watch-outs
- Watch-outs: flood insurance adds $427/mo.
- Climate carrying-cost: in FEMA flood zone AE (mandatory federal flood insurance); severe wind risk, 99% chance of damaging wind over 30y; extreme-heat days projected 7→19/yr by 2055 (HVAC capex compounding) — expect insurance premiums to compound above CPI over the hold.
Questions for the listing agent
- Built in 1977 — when were the roof, HVAC, electrical panel, plumbing, and water heater last replaced?
- What's the actual annual flood-insurance premium (NFIP or private), and is the property in a SFHA with mandatory coverage?
- Is there a deadline driving the sale (1031 exchange, divorce, estate, relocation)? That informs how much negotiation room exists.
- Schools are B-rated — typically a magnet for longer-tenancy family renters. What's the average tenant stay here, and is there a school-zone premium baked into asking?
- The area grade is low — what's the realistic commute time and amenity access for the typical tenant pool here? Any planned neighborhood developments (good or bad) we should know about?
- What's the average days-on-market for RENTAL listings here right now (not sales)? A rising rental-DOM trend means longer vacancies and softer asking-rent achievability than the comps imply.
- What's the recent tenant-quality profile in this submarket — average credit score on applications, eviction rate, late-payment / NSF rate, and stable-employment percentage? A property-management company in the area should have these aggregated.
- How much new for-sale + rental construction is in the pipeline within 1–3 miles? Heavy new supply typically softens prices + rents 12–24 months out; constrained supply supports both.
Investment metrics
- 1% rule
- 50.97% ✓
- Cap rate
- 481.24%
- Cash-on-cash
- 1696.24%
- DSCR
- 76.47
- GRM
- 0.2
CMA / ARV
- ARV (on-the-fly)
- $521,472
- Comps found
- 12
Show comp detail 12 sales within ~0.75 mi
| Address | Dist | Beds/Ba | Sqft | Sold | Price | $/sf | Match |
|---|---|---|---|---|---|---|---|
| 2277 Brannings Sawmill Ct | 0.50mi | 4/3.0 | 2,754 (+2%) | 3mo | $529,990 | $192 | 70 |
| 2454 Jennings Farm Dr | 0.55mi | 4/3.0 | 2,754 (+2%) | 3mo | $550,990 | $200 | 68 |
| 2087 Harvard St | 0.36mi | 4/2.0 | 2,448 (-9%) | 2mo | $370,000 | $151 | 62 |
| 2436 Jennings Farm Dr | 0.57mi | 5/4.0 (+1) | 2,681 (-0%) | 5mo | $519,990 | $194 | 60 |
| 2412 Jennings Farm Dr | 0.61mi | 4/3.0 | 2,493 (-7%) | 2mo | $499,990 | $201 | 58 |
| 2260 Brannings Sawmill Ct | 0.48mi | 5/4.0 (+1) | 2,881 (+7%) | 1mo | $544,000 | $189 | 56 |
| 128 S Lee Dr S | 0.21mi | 3/2.5 (-1) | 2,285 (-15%) | 4mo | $765,000 | $335 | 55 |
| 3911 Gareys Ferry Way | 0.73mi | 4/3.0 | 2,493 (-7%) | 1mo | $624,471 | $250 | 53 |
| 3961 Gareys Ferry Way | 0.61mi | 5/2.5 (+1) | 2,446 (-9%) | 1mo | $475,000 | $194 | 49 |
| 3967 Gareys Ferry Way | 0.60mi | 5/3.5 (+1) | 2,937 (+9%) | 2mo | $459,900 | $157 | 48 |
| 2487 Jennings Farm Dr | 0.49mi | 5/3.0 (+1) | 2,289 (-15%) | 1mo | $415,000 | $181 | 47 |
| 3793 Forest Dr | 0.65mi | 3/2.5 (-1) | 2,284 (-15%) | 3mo | $679,800 | $298 | 35 |
Match score weights: distance 35% · size 25% · config 20% · recency 20%. Top-matched comps best support the ARV.
Projected returns pro-forma
-3.0% appreciation · 3.35% rent growth · sell at horizon
- IRR
- —
- Equity multiple
- 71.90×
- Total profit
- $99,264
- Equity at exit
- $746
- IRR
- —
- Equity multiple
- 157.21×
- Total profit
- $218,696
- Equity at exit
- $432
Cash invested: $1,400 (down + closing). Projections, not guarantees.
Landlord ↔ Tenant lean methodology
- Overall (STATE)
- 87 Strongly Landlord-Friendly
- State Florida
- 87 Strongly Landlord-Friendly · R+3
- County
- — inherits STATE
- City
- — inherits STATE
ZIP-level market 32068
- Home prices YoY
- -27.5%
- Rents YoY
- 3.4%
- Active inventory
- 601
- Price-to-rent
- 0.2×
Monthly cashflow live
- Estimated rent
- $2,549 medium interval (Pro) →
- Mortgage (P&I)
- −$26
- Tax est. 1.5%
- −$6 /mo · $75/yr
- Insurance
- −$2
- Flood insurance flood zone
- −$427 /mo · $5,118/yr
- HOA
- −$0
- Vacancy / Maint / Mgmt
- −$535
- Net cashflow
- $1,552
Break-even live
UW: 25.0% down · 7.5% · 30yr · 1.5% tax · 5.0% vac · 8.0% maint · 8.0% mgmt
Financing live
Cash to close
- Down payment
- $1,250
- Closing costs
- $150
- Reserves months
- —
- Total cash needed
- —
Loan-product check · same deal, 3 products live
Conventional
25% down · 7.5% · 30yr
- Down + closing
- —
- Monthly P&I
- —
- Monthly cashflow
- —
- DSCR
- —
- Eligible?
- —
Personal DTI + credit; lowest rate.
DSCR
20% down · 8.5% · 30yr
- Down + closing
- —
- Monthly P&I
- —
- Monthly cashflow
- —
- DSCR
- —
- Eligible?
- —
No personal income docs; deal must DSCR.
Hard money
10% down · 12.0% · 12mo
- Down + closing
- —
- Monthly P&I
- —
- Monthly cashflow
- —
- DSCR
- —
- Eligible?
- —
Short-term bridge; refi at stabilization.
Rent comps 2 comps
| Address | Beds | Baths | Sqft | Rent | $/sqft | DOM | Units | Dist |
|---|---|---|---|---|---|---|---|---|
| 2234 Windward Cay Ln Middleburg, FL | 3.0 | 2.5 | 1782 | $1,730 | $0.97 | 23d | 1 | 0.72mi |
| 2790 Ravines Rd Middleburg, FL | 3.0 | 2.5 | 2647 | $2,576 | $0.97 | 7d | 1 | 1.31mi |
Listing history 3 events
-
2026-06-18days on market $5,000 Active 2 DOM
-
2026-06-17remarks 298-char remark
-
2026-06-17$5,000 Active 1 DOM
ⓘ Source: listings_history table (triggers on properties + properties_extension) + one-shot
backfill from property_details.listing_events for pre-trigger history.
Climate risk First Street
- Flood 6/10 Major FEMA zone AE · 27% chance over 30 yrs
- Wildfire 4/10 Moderate
- Heat 8/10 Severe 7 d/yr ≥108°F today · 19 d/yr by 30 yrs out
- Wind 9/10 Extreme 99% chance of damaging wind over 30 yrs
- Air quality 3/10 Moderate 3 unhealthy d/yr today · 3 by 30 yrs out
Nearby sold comps map
Loading sold comps map…
Walkable amenities ~0.75 mi
Loading nearby amenities…
Taxation est. · year 1
- Rental income
- $30,585
- − Mortgage interest
- −$280
- − Property taxes
- −$75
- − Insurance
- −$5,144
- − Repairs & maintenance
- −$2,447
- − Management
- −$2,447
- − Depreciation
- −$145
- Taxable income
- $20,047
- Est. tax owed @ 24.0%
- −$4,811
- After-tax cash flow
- $13,817/yr
For passive investors: Depreciation is non-cash, so a rental often shows a tax loss while cash-flowing — sheltering income. Rental losses are passive: they offset passive income freely, and up to $25,000/yr can offset ordinary (W-2) income if you actively participate and your MAGI is under $100k (phasing out to $0 by $150k); unused losses carry forward. On sale, claimed depreciation is recaptured at up to 25%, and gains may owe capital-gains tax (a 1031 exchange can defer both). Figures are a year-1 estimate at your 24.0% rate — not tax advice; consult a CPA.
Schools (NCES district)
- District
- Clay
- NCES district ID
- 1200300
- Math proficiency
- 58% ▼ -8.00%
- Reading proficiency
- 59% ▼ -3.00%
- Median HH income
- $59,379
- Composite
- 50.73/100
- National rank
- #1815
- State rank
- #14 of 73 in FL
Livability — Middleburg
- Score
- 65/100
- State rank
- #657
- US rank
- #13174
Category grades
Schools grade is shown separately in the Schools card above.
Census & demographics
- Census place
- Middleburg, FL
- County
- Clay County · 208,450 people
- City population
- 58,983
- Metro
- Jacksonville, FL
- Population (ZIP)
- 58,983
- Household income
- $84,431
- Rent vs Own
- Severe rent burden
- 975.0
Population outlook (Clay County) Hauer SSP2
- Today (2025)
- 230,495 people
- By 2030
- 242,427 · +5.2%
- By 2040
- 262,244 · +13.8%
- By 2050
- 275,148 · +19.4%
- By 2075
- 295,397 · +28.2%
- By 2100
- 287,592 · +24.8%
Race, ethnicity, and origin ACS 2023
- Neighborhood character
- Predominantly White (74%)
- Race & ethnicity
- White 74% Hispanic / Latino 13% Two or more races 10% Black 7%
- Hispanic origin (detail)
- Mexican 2% Puerto Rican 5%
- Common ancestry
- Slovak 2% Romanian 2% Lithuanian 2%
- Foreign-born
- 7% · Canada, Jamaica
- Languages at home
- 87% English-only · Spanish 9% Arabic 1% German/W. Germanic 1%
Political lean MEDSL · Clay
- 2024 margin
- Solid R (+39.3) · D 29.9% · R 69.2%
- 2008→2024 swing
- +3.6pp toward D · 2008: -42.8pp · 2024: -39.3pp
- All cycles
- 2024: R+39.3 2020: R+37.1 2016: R+44.3 2012: R+45.8 2008: R+42.8
Not yet ingested
- Civics
- —
Market trends
- HPI YoY
- ▼ -115.99%
- Current HPI
- 305.2531
- Rent YoY
- ▲ 3.35%
- Metro
- Jacksonville, FL
- State GDP YoY
- ▲ 3.28%
- F500 in state
- 36
Industry mix (Fortune 500 HQ in FL)
| Industry | F500 HQs | Revenue |
|---|---|---|
| Industrial Technology | 2 | $29B |
|
||
| Insurance | 2 | $17B |
|
||
| Retail | 1 | $60B |
|
||
| Technology Distribution | 1 | $58B |
|
||
| Homebuilding | 1 | $35B |
|
||
| Technology Manufacturing | 1 | $35B |
|
||
Price history
-95.7% since first listed31 events — show timeline
- 2026-06-16 Listed $5,000 HAOR as distributed by MLS GRID
- 2025-09-04 Listing Removed — realMLS
- 2025-08-08 Price Changed $475,000 realMLS
- 2025-04-10 Price Changed $508,000 realMLS
- 2025-03-13 Price Changed $509,000 realMLS
- 2025-03-06 Price Changed $510,000 realMLS
- 2025-02-28 Price Changed $525,000 realMLS
- 2025-02-14 Price Changed $530,000 realMLS
- 2025-01-09 Listed $550,000 realMLS
- 2023-10-20 Sold (Public Records) $493,000 Public Records
- 2023-10-20 Sold (MLS) $493,000 realMLS
- 2023-09-30 Pending — realMLS
- 2023-09-21 Contingent — realMLS
- 2023-09-01 Price Changed $499,000 realMLS
- 2023-08-01 Relisted — realMLS
- 2023-07-29 Contingent — realMLS
- 2023-07-14 Price Changed $537,000 realMLS
- 2023-06-24 Price Changed $567,500 realMLS
- 2023-06-03 Listed $584,900 realMLS
- 2021-01-14 Listing Removed — realMLS
- 2020-10-24 Listed $290,000 realMLS
- 2020-01-01 Listing Removed — realMLS
- 2019-10-06 Price Changed $159,900 realMLS
- 2019-08-11 Price Changed $175,000 realMLS
- 2019-07-24 Listed $185,000 realMLS
- 2018-04-30 Sold (Public Records) $100,000 Public Records
- 2018-04-27 Sold (MLS) $100,000 realMLS
- 2018-03-23 Pending — realMLS
- 2018-03-15 Relisted — realMLS
- 2018-03-14 Pending — realMLS
- 2018-03-12 Listed $116,500 realMLS
Property tax history
+16.6%/yrLatest (2025): $7,283 · +12.3% YoY. Source: county tax records.
Cash-flow waterfall
monthlySold comps — $/sqft
last 12 mo · ≤1 miLoading sold comps…