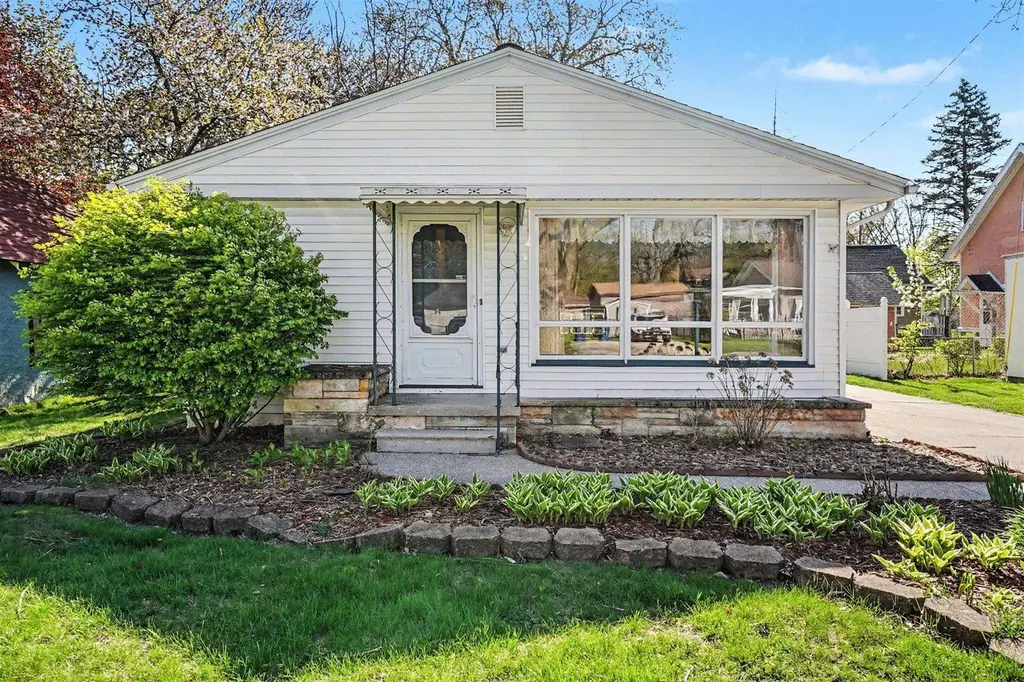
1302 Green Ave · Bay City, MI
Flood risk 1/10 · Minimal
- FEMA flood zone
- X (unshaded)
- Chance of flooding over 30 yrs
- 0.0%
- Est. flood insurance / yr
- $473 – $860
Fire risk 1/10 · Minimal
- Est. fire insurance / yr
- $784 – $1,456
Heat risk 3/10 · Minor
- Hot days now (above 97°F)
- 7 days/yr
- Hot days in 30 yrs
- 14 days/yr
Wind risk 1/10 · Minimal
- Chance of severe wind over 30 yrs
- —
Air-quality risk 2/10 · Minimal
- Unhealthy air days now
- 1 days/yr
- Unhealthy air days in 30 yrs
- 2 days/yr
Risk factors via First Street. Map © Google.
Why this score? — see what drove the D+ grade
The composite is a weighted blend of 9 inputs, each scored 0–100. Each bar is that input's sub-score; the figure is the points it added to the 100-point composite (weight × sub-score).
- Cash flow +15.3/30.0
- ARV discount +14.7/15.0
- DSCR +4.7/10.0
- 1% rule +4.1/10.0
- Livability +3.4/5.0
- Schools +2.8/10.0
- Rent growth +2.5/5.0
- Condition / age +2.5/5.0
- Appreciation +0.0/10.0
$119,500
🖨 Deal sheet 📄 Offer letter ✓ Due diligence
Listing remarks
Charming 2-bedroom ranch in Bay City. This well-built home features a nice-sized living room with a cozy fireplace. Enjoy the ease of main floor laundry and a spacious 2-car garage with plenty of room for storage or hobbies. Major updates provide peace of mind, including a newer furnace, central air, and hot water heater. The home also boasts a new sewer line with heat tape plumbing—an added bonus for reliability during colder months. A great opportunity for buyers looking for a move-in-ready home with key mechanical updates already completed!
Key facts
- 5,662 sq ft lot
- 2 garage spots
- Built 1960
Property features AI
Exterior
- Parking: Detached 2-car garage; Garage parking available
- Utilities: Public water; Public sanitary sewer; Natural gas; Electric service available
- Home design: Residential single-story; Built in 1960; Below-grade finished area: none
- Construction: Vinyl siding exterior; Crawl foundation; Built in 1960
- Exterior features: Vinyl siding; Road frontage
Interior
- Kitchen: Kitchen on first floor, approx. 12 x 10, linoleum flooring
- Bedrooms: Bedroom 1 (first floor): 12 x 12, carpet; Bedroom 2 (first floor): 11 x 12, carpet
- Flooring: Carpet in living areas and bedrooms; Linoleum in kitchen, bathroom, and laundry room
- Bathrooms: 1 full bathroom (first floor), linoleum flooring, approx. 7 x 7
- Heating & cooling: Forced air heating; Central A/C; Natural gas heating fuel; Gas water heater
- Interior features: Gas fireplace; 7 total rooms
- Laundry & utility: Laundry room on first floor, approx. 8 x 13, linoleum flooring; Basement: block foundation (crawl type)
Neighborhood map
What this means for you Summary
Snapshot
- This is a 2-bed/1.0-bath single-family listed at $120k.
Deal economics
- At list price, monthly cash flow is $43 ($521/yr) — positive.
- The deal already cash-flows at list — no discount required.
- To meet the 1% rule (rent ≥ 1% of price), the offer needs to be $108k (9.4% below list).
- Recommended offer: $108k (9.4% below list) — sets the bar for 1% rule.
- Cap rate 6.7% vs local median 5.5% in Bay City — meaningfully above typical; check what's discounted (condition, days-on-market, listing class) to confirm the premium yield is real.
Location & tenants
- Location reads 68/100 on livability (#360 in MI) — a middle-class / working-renter tenant base. Strengths: cost of living A+, housing A+, health & safety A+; Watch: schools D+, amenities D, crime F.
- Bay City School District (urban): math 27% / reading 40% proficiency, ranked #317 of 540 in MI (top 59%) — families likely to look elsewhere, expect single-tenant / working-renter base with shorter leases.
- Market conditions: 148 active listings in the ZIP; 2 comparable units currently listed for rent nearby; 39 units permitted in Bay County in 2024 (0 in 5+ unit buildings).
Forward outlook
- Local home prices are declining (-3.0%/yr); year-one equity from $826 of loan paydown is wiped out by about $4k of value loss. Plan a longer hold.
- Bay County population projected at -21% by 2050 — secular population decline; favor cash flow + early exit over multi-decade hold.
Negotiation context
- Only 5 days on market — expect competitive offers; lowballing is unlikely to land.
- 2 sale attempts since 22y ago with the ask held roughly flat each time — persistent listings suggest the price (not the market) is what's stuck; bring a comps-based counter.
Questions for the listing agent
- Built in 1960 — when were the roof, HVAC, electrical panel, plumbing, and water heater last replaced?
- Is there a deadline driving the sale (1031 exchange, divorce, estate, relocation)? That informs how much negotiation room exists.
- Schools are D-rated, which usually means shorter tenancies and higher turnover. Who's the typical renter profile here, and what's been the actual vacancy rate?
- Crime grade is F in this area — have there been break-ins, vandalism, or insurance claims at this property in the last 3 years? What carrier currently insures it and at what premium?
- The area grade is low — what's the realistic commute time and amenity access for the typical tenant pool here? Any planned neighborhood developments (good or bad) we should know about?
- What's the average days-on-market for RENTAL listings here right now (not sales)? A rising rental-DOM trend means longer vacancies and softer asking-rent achievability than the comps imply.
- What's the recent tenant-quality profile in this submarket — average credit score on applications, eviction rate, late-payment / NSF rate, and stable-employment percentage? A property-management company in the area should have these aggregated.
- How much new for-sale + rental construction is in the pipeline within 1–3 miles? Heavy new supply typically softens prices + rents 12–24 months out; constrained supply supports both.
Investment metrics
- 1% rule
- 0.91% ✗
- Cap rate
- 6.73%
- Cash-on-cash
- 1.56%
- DSCR
- 1.07
- GRM
- 9.2
CMA / ARV
- ARV (median comp)
- $142,077
- List price
- $119,500
- Delta
- -15.89%
- Verdict
- UNDERPRICED
- Comps
- 20 within 1.0 mi
Show comp detail 12 sales within ~0.75 mi
| Address | Dist | Beds/Ba | Sqft | Sold | Price | $/sf | Match |
|---|---|---|---|---|---|---|---|
| 1302 Green Ave | 0.00mi | 2/1.0 | 988 (0%) | 1mo | $145,000 | $147 | 99 |
| 300 Thompson St | 0.39mi | 2/2.0 | 1,016 (+3%) | 9mo | $112,000 | $110 | 66 |
| 2702 N VanBuren St | 0.42mi | 2/1.0 | 948 (-4%) | 10mo | $120,000 | $127 | 66 |
| 3204 N Water St | 0.52mi | 2/1.0 | 1,046 (+6%) | 3mo | $110,000 | $105 | 64 |
| 1110 Chase St | 0.55mi | 3/1.0 (+1) | 1,011 (+2%) | 8mo | $115,500 | $114 | 59 |
| 414 Cambridge St | 0.63mi | 3/1.0 (+1) | 1,074 (+9%) | 1mo | $165,500 | $154 | 50 |
| 209 Campbell St | 0.53mi | 2/1.0 | 880 (-11%) | 10mo | $92,500 | $105 | 49 |
| 301 Mcewan St | 0.46mi | 3/1.0 (+1) | 864 (-13%) | 4mo | $116,500 | $135 | 49 |
| 2110 4th St | 0.44mi | 3/1.0 (+1) | 1,104 (+12%) | 9mo | $78,000 | $71 | 48 |
| 1009 N Hampton St | 0.70mi | 3/1.5 (+1) | 1,081 (+9%) | 0mo | $140,000 | $130 | 44 |
| 513 W Ridge Rd | 0.74mi | 2/1.0 | 864 (-13%) | 1mo | $70,000 | $81 | 44 |
| 308 Borton Ave | 0.56mi | 3/1.0 (+1) | 1,100 (+11%) | 8mo | $144,900 | $132 | 44 |
Match score weights: distance 35% · size 25% · config 20% · recency 20%. Top-matched comps best support the ARV.
Projected returns pro-forma
-3.0% appreciation · 3.0% rent growth · sell at horizon
- IRR
- -13.8%
- Equity multiple
- 0.50×
- Total profit
- $-16,593
- Equity at exit
- $17,818
- IRR
- -5.0%
- Equity multiple
- 0.68×
- Total profit
- $-10,860
- Equity at exit
- $10,332
Cash invested: $33,460 (down + closing). Projections, not guarantees.
Landlord ↔ Tenant lean methodology
- Overall (STATE)
- 62 Landlord-Friendly
- State Michigan
- 62 Landlord-Friendly · EVEN
- County
- — inherits STATE
- City
- — inherits STATE
ZIP-level market 48708
- Home prices YoY
- -30.9%
- Active inventory
- 148
- Price-to-rent
- 9.2×
Monthly cashflow live
- Estimated rent
- $1,083 medium interval (Pro) →
- Mortgage (P&I)
- −$627
- Tax from tax record
- −$136 /mo · $1,627/yr
- Insurance
- −$50
- HOA
- −$0
- Vacancy / Maint / Mgmt
- −$227
- Net cashflow
- $43
Break-even live
UW: 25.0% down · 7.5% · 30yr · 1.5% tax · 5.0% vac · 8.0% maint · 8.0% mgmt
Financing live
Cash to close
- Down payment
- $29,875
- Closing costs
- $3,585
- Reserves months
- —
- Total cash needed
- —
Loan-product check · same deal, 3 products live
Conventional
25% down · 7.5% · 30yr
- Down + closing
- —
- Monthly P&I
- —
- Monthly cashflow
- —
- DSCR
- —
- Eligible?
- —
Personal DTI + credit; lowest rate.
DSCR
20% down · 8.5% · 30yr
- Down + closing
- —
- Monthly P&I
- —
- Monthly cashflow
- —
- DSCR
- —
- Eligible?
- —
No personal income docs; deal must DSCR.
Hard money
10% down · 12.0% · 12mo
- Down + closing
- —
- Monthly P&I
- —
- Monthly cashflow
- —
- DSCR
- —
- Eligible?
- —
Short-term bridge; refi at stabilization.
Rent comps 2 comps
| Address | Beds | Baths | Sqft | Rent | $/sqft | DOM | Units | Dist |
|---|---|---|---|---|---|---|---|---|
| 800 McKinley St Bay City, MI | 2.0 | 1.0 | 796 | $925 | $1.16 | 43d | 1 | 1.27mi |
| 1305 Washington Ave Bay City, MI | 2.0 | 1.0 | 635 | $1,675 | $2.64 | 43d | 1 | 1.44mi |
Listing history 4 events
-
2026-05-11status Pending 555-char remark
-
2026-05-06$119,500 Active 555-char remark
-
2004-06-08soldstatus $88,500
-
2004-05-26$89,900
ⓘ Source: listings_history table (triggers on properties + properties_extension) + one-shot
backfill from property_details.listing_events for pre-trigger history.
Tax reassessment forecast MI · Partial reset (capped growth)
- Current annual tax
- $1,627 · $136/mo
- Projected year-2 tax
- $1,734 · $144/mo
- Expected delta
- +$107/yr (+$9/mo · 6.6%)
ⓘ Screening estimate from a state-policy table — verify with the county assessor before closing.
Climate risk First Street
- Flood 1/10 Low FEMA zone X (unshaded) · 0% chance over 30 yrs
- Wildfire 1/10 Low
- Heat 3/10 Moderate 7 d/yr ≥97°F today · 14 d/yr by 30 yrs out
- Wind 1/10 Low
- Air quality 2/10 Low 1 unhealthy d/yr today · 2 by 30 yrs out
Nearby sold comps map
Loading sold comps map…
Walkable amenities ~0.75 mi
Loading nearby amenities…
Taxation est. · year 1
- Rental income
- $12,993
- − Mortgage interest
- −$6,694
- − Property taxes
- −$1,627
- − Insurance
- −$598
- − Repairs & maintenance
- −$1,039
- − Management
- −$1,039
- − Depreciation
- −$3,476
- Taxable loss
- −$1,480
- Est. tax savings @ 24.0%
- +$355
- After-tax cash flow
- $876/yr
For passive investors: Depreciation is non-cash, so a rental often shows a tax loss while cash-flowing — sheltering income. Rental losses are passive: they offset passive income freely, and up to $25,000/yr can offset ordinary (W-2) income if you actively participate and your MAGI is under $100k (phasing out to $0 by $150k); unused losses carry forward. On sale, claimed depreciation is recaptured at up to 25%, and gains may owe capital-gains tax (a 1031 exchange can defer both). Figures are a year-1 estimate at your 24.0% rate — not tax advice; consult a CPA.
Schools (NCES district)
- District
- Bay City School District
- NCES district ID
- 2604260
- Math proficiency
- 27% ▼ -8.00%
- Reading proficiency
- 40% ▼ -4.00%
- Median HH income
- $43,833
- Composite
- 28.47/100
- National rank
- #6743
- State rank
- #317 of 540 in MI
Livability — Bay City
- Score
- 68/100
- State rank
- #360
- US rank
- #8912
Category grades
Schools grade is shown separately in the Schools card above.
Census & demographics
- Census place
- Bay City, MI
- County
- Bay County · 36,975 people
- City population
- 25,635
- Metro
- Bay City, MI
- Population (ZIP)
- 25,635
- Household income
- $50,518
- Rent vs Own
- Severe rent burden
- 528.0
Population outlook (Bay County) Hauer SSP2
- Today (2025)
- 101,476 people
- By 2030
- 98,152 · -3.3%
- By 2040
- 89,711 · -11.6%
- By 2050
- 80,614 · -20.6%
- By 2075
- 60,544 · -40.3%
- By 2100
- 41,603 · -59.0%
Race, ethnicity, and origin ACS 2023
- Neighborhood character
- Predominantly White (81%)
- Race & ethnicity
- White 81% Hispanic / Latino 11% Two or more races 10% Black 3%
- Hispanic origin (detail)
- Mexican 9%
- Common ancestry
- Romanian 17% Lithuanian 7% Slovak 2%
- Foreign-born
- 2% · Canada, South Korea
- Languages at home
- 96% English-only · Spanish 2% German/W. Germanic 1%
Political lean MEDSL · Bay
- 2024 margin
- R (+14.7) · D 42.0% · R 56.7% · Other 1.3%
- 2008→2024 swing
- -30.0pp toward R · 2008: 15.3pp · 2024: -14.7pp
- All cycles
- 2024: R+14.7 2020: R+11.6 2016: R+12.6 2012: D+6.0 2008: D+15.3
Not yet ingested
- Civics
- —
Market trends
- HPI YoY
- ▼ -82.21%
- Current HPI
- 183.5774
- Rent YoY
- —
- Metro
- Bay City, MI
- State GDP YoY
- ▲ 1.37%
- F500 in state
- 28
Industry mix (Fortune 500 HQ in MI)
| Industry | F500 HQs | Revenue |
|---|---|---|
| Automotive Parts | 3 | $48B |
|
||
| Automotive | 2 | $372B |
|
||
| Chemicals | 1 | $45B |
|
||
| Automotive Retail | 1 | $29B |
|
||
| Healthcare / Medical Devices | 1 | $23B |
|
||
| Automotive Technology | 1 | $20B |
|
||
Price history
+61.3% since first listed5 events — show timeline
- 2026-05-26 Sold (MLS) $145,000 MiRealSource-MiMLS
- 2026-05-11 Pending — MiRealSource-MiMLS
- 2026-05-06 Listed $119,500 MiRealSource-MiMLS
- 2004-06-08 Sold (MLS) $88,500 MiRealSource-MiMLS
- 2004-05-26 Listed $89,900 MiRealSource-MiMLS
Property tax history
+1.8%/yrLatest (2025): $1,627 · +3.0% YoY. Source: county tax records.
Cash-flow waterfall
monthlySold comps — $/sqft
last 12 mo · ≤1 miLoading sold comps…