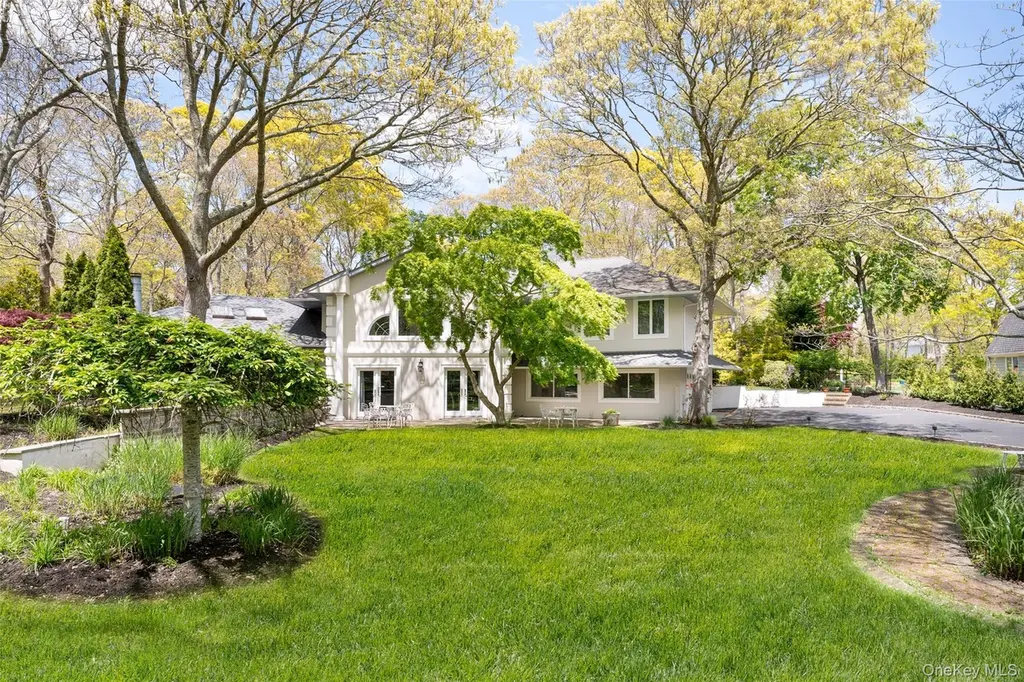
27 Bay Ave W · Hampton Bays, NY
Flood risk 8/10 · Major
- FEMA flood zone
- X (unshaded)
- Chance of flooding over 30 yrs
- 0.98%
- Est. flood insurance / yr
- $507 – $1,088
Fire risk 3/10 · Minor
- Est. fire insurance / yr
- $691 – $1,283
Heat risk 4/10 · Minor
- Hot days now (above 90°F)
- 7 days/yr
- Hot days in 30 yrs
- 20 days/yr
Wind risk 8/10 · Major
- Chance of severe wind over 30 yrs
- 80.0%
Air-quality risk 3/10 · Minor
- Unhealthy air days now
- 2 days/yr
- Unhealthy air days in 30 yrs
- 3 days/yr
Risk factors via First Street. Map © Google.
Why this score? — see what drove the D grade
The composite is a weighted blend of 9 inputs, each scored 0–100. Each bar is that input's sub-score; the figure is the points it added to the 100-point composite (weight × sub-score).
- Cash flow +13.0/30.0
- ARV discount +7.5/15.0
- Rent growth +5.0/5.0
- Schools +4.0/10.0
- DSCR +3.9/10.0
- Livability +3.4/5.0
- 1% rule +3.0/10.0
- Condition / age +2.5/5.0
- Appreciation +0.0/10.0
$1,195,000
🖨 Deal sheet (PDF) 📄 Offer letter ✓ Due diligence
Listing remarks
Set 150 feet off the road behind private gates, this beautifully renovated contemporary home sits on a secluded, tree-lined acre in the heart of Hampton Bays. The sun-filled first floor features an open layout anchored by a redesigned kitchen with new Whirlpool stainless steel appliances, including double ovens and an induction cooktop, resurfaced white cabinetry, granite countertops, and a large built-in pantry. The dining area, framed by French doors, opens to a spacious patio for seamless indoor-outdoor living. A private office with garden views and a fully renovated bath with walk-in shower complete the main level. The expansive Great Room offers vaulted ceilings and a wood-burning fire
Key facts
- Private office
- Fully renovated bath
- Expansive great room
Tags
Property features AI
Exterior
- Parking: Driveway; Oversized parking; Private parking; 1-car garage
- Utilities: Cesspool sewer; Cable connected; Natural gas available; Water connected
- Home design: Single-family residence
- Construction: Advanced framing technique construction
- Exterior features: Private pool; Not waterfront; Advanced framing construction
Interior
- Kitchen: Dishwasher; Range; Refrigerator; Microwave; Stainless steel appliances; Kitchen island; Granite counters; Pantry; Eat-in/chef's kitchen with breakfast bar and open layout
- Bedrooms: Total rooms: 9
- Flooring: Hardwood; Tile
- Bathrooms: 3 full bathrooms
- Heating & cooling: Oil heating; Central air; Ductless cooling
- Interior features: First-floor full bathroom; Beamed ceilings; Breakfast bar; Built-in features; Cathedral ceilings; Chef's kitchen; Eat-in kitchen; Granite counters; High ceilings; High-speed internet; Kitchen island; Open floor plan; Open kitchen; Pantry; Soaking tub; Storage; Walk-through kitchen
- Laundry & utility: Washer; Dryer
Neighborhood map
What this means for you Summary
Snapshot
- This is a 3-bed/3.0-bath single-family listed at $1.20M.
Deal economics
- At list price, monthly cash flow is $-124 ($-1k/yr) — negative.
- To cash-flow at today's rent, offer at most $1.17M (1.8% below list).
- To meet the 1% rule (rent ≥ 1% of price), the offer needs to be $954k (20.1% below list).
- Recommended offer: $954k (20.1% below list) — sets the bar for 1% rule.
Location & tenants
- Location reads 68/100 on livability (#551 in NY) — a middle-class / working-renter tenant base. Strengths: crime A+, employment A+, health & safety B+; Watch: amenities F, commute F, cost of living F.
- Hampton Bays Union Free School District (suburban): math 45% / reading 44% proficiency, ranked #434 of 590 in NY (top 74%) — families likely to look elsewhere, expect single-tenant / working-renter base with shorter leases.
- Zoned schools: Hampton Bays Elementary School (math 32% / reading 52%, grade F, #1,361 of 2,108 statewide, top 67%, 682 students, 55% FRL); Hampton Bays Middle School (math 25% / reading 38%, grade F, #522 of 729 statewide, top 73%, 597 students, 64% FRL); Hampton Bays High School (math 98% / reading 57%, grade A-, #580 of 1,100 statewide, top 53%, 769 students, 53% FRL) — zoned schools average 58% FRL vs 38% district-wide (20 pts higher); higher-poverty schools than district average — tighter screening recommended.
- Market conditions: Rents rising fast (+16.1%/yr); 173 active listings in the ZIP; 11 comparable units currently listed for rent nearby; rentals at typical pace (median 27d on market — plan ~3-4 weeks tenant-placement turnaround); high-income renter base; 1,366 units permitted in Suffolk County in 2024 (216 in 5+ unit buildings).
- At $9,543/mo this rent would consume 86% of the median local household income ($134k/yr) (locally 199% of renters already pay >50% of income on rent) — very limited rent-growth headroom before tenants either downsize or default.
Forward outlook
- Local home prices are declining (-3.0%/yr); year-one equity from $8k of loan paydown is wiped out by about $36k of value loss. Plan a longer hold.
- Suffolk County population projected to shrink 5% by 2050 — rents likely to lag national; underwrite the cash flow, not the appreciation.
Negotiation context
- Only 6 days on market — expect competitive offers; lowballing is unlikely to land.
- 4 sale attempts since 14y ago with the ask held roughly flat each time — persistent listings suggest the price (not the market) is what's stuck; bring a comps-based counter.
- Current owner paid $952k; 25% above their basis — modest negotiation headroom, anchor on the comps not their cost.
Risks & watch-outs
- Watch-outs: flood insurance adds $66/mo.
- Climate carrying-cost: severe flood risk; severe wind risk, 80% chance of damaging wind over 30y — expect insurance premiums to compound above CPI over the hold.
Questions for the listing agent
- What do current leases actually rent for vs. the listed asking? Can we see a recent rent roll and the last 12 months of T-12 income?
- What's the actual annual flood-insurance premium (NFIP or private), and is the property in a SFHA with mandatory coverage?
- Is there a deadline driving the sale (1031 exchange, divorce, estate, relocation)? That informs how much negotiation room exists.
- Schools are B-rated — typically a magnet for longer-tenancy family renters. What's the average tenant stay here, and is there a school-zone premium baked into asking?
- The area grade is low — what's the realistic commute time and amenity access for the typical tenant pool here? Any planned neighborhood developments (good or bad) we should know about?
- What's the average days-on-market for RENTAL listings here right now (not sales)? A rising rental-DOM trend means longer vacancies and softer asking-rent achievability than the comps imply.
- What's the recent tenant-quality profile in this submarket — average credit score on applications, eviction rate, late-payment / NSF rate, and stable-employment percentage? A property-management company in the area should have these aggregated.
- How much new for-sale + rental construction is in the pipeline within 1–3 miles? Heavy new supply typically softens prices + rents 12–24 months out; constrained supply supports both.
Investment metrics
- 1% rule
- 0.80% ✗
- Cap rate
- 6.24%
- Cash-on-cash
- -0.21%
- DSCR
- 0.99
- GRM
- 10.4
CMA / ARV
- ARV (on-the-fly)
- $2,507,050
- Comps found
- 2
Show comp detail 2 sales within ~0.75 mi
| Address | Dist | Beds/Ba | Sqft | Sold | Price | $/sf | Match |
|---|---|---|---|---|---|---|---|
| 106 E Tiana Rd | 0.35mi | 4/4.5 (+1) | 3,314 (-0%) | 3mo | $2,500,000 | $754 | 70 |
| 19 Grant Blvd | 0.51mi | 4/3.0 (+1) | 3,000 (-10%) | 23mo | $1,821,000 | $607 | 36 |
Match score weights: distance 35% · size 25% · config 20% · recency 20%. Top-matched comps best support the ARV.
Projected returns pro-forma
-3.0% appreciation · 8.0% rent growth · sell at horizon
- IRR
- -12.0%
- Equity multiple
- 0.55×
- Total profit
- $-151,337
- Equity at exit
- $178,178
- IRR
- 3.0%
- Equity multiple
- 1.26×
- Total profit
- $86,679
- Equity at exit
- $103,322
Cash invested: $334,600 (down + closing). Projections, not guarantees.
Landlord ↔ Tenant lean methodology
- Overall (STATE)
- 15 Strongly Tenant-Friendly
- State New York
- 15 Strongly Tenant-Friendly · D+10
- County
- — inherits STATE
- City
- — inherits STATE
ZIP-level market 11946
- Home prices YoY
- -20.3%
- Rents YoY
- 16.1%
- Active inventory
- 173
- Price-to-rent
- 10.4×
Monthly cashflow live
- Estimated rent
- $9,543 medium interval (Pro) →
- Mortgage (P&I)
- −$6,267
- Tax from tax record
- −$832 /mo · $9,986/yr
- Insurance
- −$498
- Flood insurance flood zone
- −$66 /mo · $798/yr
- HOA
- −$0
- Vacancy / Maint / Mgmt
- −$2,004
- Net cashflow
- $-124
Break-even live
Sensitivity live
| Price | -10% $552 | -5% $214 | +0% $-124 | +5% $-462 | +10% $-801 |
|---|---|---|---|---|---|
| Rent | -10% $-878 | -5% $-501 | +0% $-124 | +5% $253 | +10% $630 |
| Rate | -1.0pp $478 | -0.5pp $180 | base $-124 | +0.5pp $-434 | +1.0pp $-749 |
UW: 25.0% down · 7.5% · 30yr · 1.5% tax · 5.0% vac · 8.0% maint · 8.0% mgmt
Financing live
Cash to close
- Down payment
- $298,750
- Closing costs
- $35,850
- Reserves months
- —
- Total cash needed
- —
Loan-product check · same deal, 3 products live
Conventional
25% down · 7.5% · 30yr
- Down + closing
- —
- Monthly P&I
- —
- Monthly cashflow
- —
- DSCR
- —
- Eligible?
- —
Personal DTI + credit; lowest rate.
DSCR
20% down · 8.5% · 30yr
- Down + closing
- —
- Monthly P&I
- —
- Monthly cashflow
- —
- DSCR
- —
- Eligible?
- —
No personal income docs; deal must DSCR.
Hard money
10% down · 12.0% · 12mo
- Down + closing
- —
- Monthly P&I
- —
- Monthly cashflow
- —
- DSCR
- —
- Eligible?
- —
Short-term bridge; refi at stabilization.
Rent comps 11 comps
| Address | Beds | Baths | Sqft | Rent | $/sqft | DOM | Units | Dist |
|---|---|---|---|---|---|---|---|---|
| 16 Grant Blvd Hampton Bays, NY | 4.0 | 2.5 | 2300 | $8,000 | $3.48 | 16d | 1 | 0.41mi |
| 5 Mill Race Hampton Bays, NY | 4.0 | 2.5 | 3000 | $15,000 | $5.00 | 45d | 1 | 0.49mi |
| 23 E Point Ln Hampton Bays, NY | 3.0 | 3.5 | 2614 | $69,000 | $26.40 | 26d | 1 | 0.99mi |
| 8 Westerly Ct Hampton Bays, NY | 4.0 | 2.0 | 2300 | $25,000 | $10.87 | 26d | 1 | 1.02mi |
| 48 Fanning Ave Hampton Bays, NY | 4.0 | 2.5 | 2400 | $12,500 | $5.21 | 20d | 1 | 1.03mi |
| 8 Hyler Dr Hampton Bays, NY | 4.0 | 3.5 | 2808 | $18,000 | $6.41 | 45d | 1 | 1.06mi |
| 55A Shinnecock Rd Hampton Bays, NY | 4.0 | 2.0 | 2300 | $57,500 | $25.00 | 26d | 1 | 1.08mi |
| 6 White Ln Hampton Bays, NY | 4.0 | 4.5 | 2458 | $20,000 | $8.14 | 26d | 1 | 1.19mi |
| 10 Ginny Ln Hampton Bays, NY | 4.0 | 3.5 | 2596 | $30,000 | $11.56 | 26d | 1 | 1.20mi |
| 6 Bay Dr Hampton Bays, NY | 4.0 | 3.0 | 3032 | $18,000 | $5.94 | 12d | 1 | 1.35mi |
| 9 Carter Rd Hampton Bays, NY | 3.0 | 3.0 | 2820 | $90,000 | $31.91 | 26d | 1 | 1.36mi |
Listing history 16 events
-
2026-06-03status $1,195,000 Pending 6 DOM
-
2026-05-18$1,195,000 Active
-
2025-10-17historical
-
2025-09-13price $1,425,000
-
2025-09-02historical $30,000
-
2025-08-02price $1,549,000
-
2025-07-11price $30,000
-
2025-07-05price $1,595,000
-
2025-06-14$80,000
-
2025-04-04price $1,649,000
-
2024-12-31$1,695,000 Active
-
2023-03-29soldstatus $952,500
-
2014-01-21soldstatus $500,000
-
2013-04-21historical
-
2012-10-06$574,999
-
1990-10-01soldstatus $201,500
ⓘ Source: listings_history table (triggers on properties + properties_extension) + one-shot
backfill from property_details.listing_events for pre-trigger history.
Tax reassessment forecast NY · Partial reset (capped growth)
- Current annual tax
- $9,986 · $832/mo
- Projected year-2 tax
- $15,091 · $1,258/mo
- Expected delta
- +$5,105/yr (+$425/mo · 51.1%)
ⓘ Screening estimate from a state-policy table — verify with the county assessor before closing.
Climate risk First Street
- Flood 8/10 Severe FEMA zone X (unshaded) · 98% chance over 30 yrs
- Wildfire 3/10 Moderate
- Heat 4/10 Moderate 7 d/yr ≥90°F today · 20 d/yr by 30 yrs out
- Wind 8/10 Severe 80% chance of damaging wind over 30 yrs
- Air quality 3/10 Moderate 2 unhealthy d/yr today · 3 by 30 yrs out
Nearby sold comps map
Loading sold comps map…
Walkable amenities ~0.75 mi
Loading nearby amenities…
Taxation est. · year 1
- Rental income
- $114,518
- − Mortgage interest
- −$66,939
- − Property taxes
- −$9,986
- − Insurance
- −$6,772
- − Repairs & maintenance
- −$9,161
- − Management
- −$9,161
- − Depreciation
- −$34,764
- Taxable loss
- −$22,266
- Est. tax savings @ 24.0%
- +$5,344
- After-tax cash flow
- $3,854/yr
For passive investors: Depreciation is non-cash, so a rental often shows a tax loss while cash-flowing — sheltering income. Rental losses are passive: they offset passive income freely, and up to $25,000/yr can offset ordinary (W-2) income if you actively participate and your MAGI is under $100k (phasing out to $0 by $150k); unused losses carry forward. On sale, claimed depreciation is recaptured at up to 25%, and gains may owe capital-gains tax (a 1031 exchange can defer both). Figures are a year-1 estimate at your 24.0% rate — not tax advice; consult a CPA.
Schools (NCES district)
- District
- Hampton Bays Union Free School District
- NCES district ID
- 3613530
- Math proficiency
- 45% ▼ -8.00%
- Reading proficiency
- 44% ▼ -1.00%
- Median HH income
- $70,274
- Composite
- 40.18/100
- National rank
- #3788
- State rank
- #434 of 590 in NY
Livability — Hampton Bays
- Score
- 68/100
- State rank
- #551
- US rank
- #9894
Category grades
Schools grade is shown separately in the Schools card above.
Census & demographics
- Census place
- Hampton Bays, NY
- County
- Suffolk County · 679,920 people
- City population
- 15,819
- Metro
- New York-Newark-Jersey City, NY-NJ-PA
- Population (ZIP)
- 15,819
- Household income
- $133,918
- Rent vs Own
- Severe rent burden
- 199.0
Population outlook (Suffolk County) Hauer SSP2
- Today (2025)
- 1,505,262 people
- By 2030
- 1,498,318 · -0.5%
- By 2040
- 1,471,101 · -2.3%
- By 2050
- 1,424,848 · -5.3%
- By 2075
- 1,337,157 · -11.2%
- By 2100
- 1,217,720 · -19.1%
Race, ethnicity, and origin ACS 2023
- Neighborhood character
- Majority White (62%)
- Race & ethnicity
- White 62% Hispanic / Latino 32% Two or more races 13% Asian 3% Black 2%
- Hispanic origin (detail)
- Mexican 6%
- Common ancestry
- Romanian 4% Slovak 2% Portuguese 2%
- Foreign-born
- 26% · Canada, Jamaica, Guatemala
- Languages at home
- 64% English-only · Spanish 29% Other Indo-European 2% French/Haitian/Cajun 2%
Political lean MEDSL · Suffolk
- 2024 margin
- Lean R (+10.0) · D 45.0% · R 55.0%
- 2008→2024 swing
- -16.0pp toward R · 2008: 6.0pp · 2024: -10.0pp
- All cycles
- 2024: R+10.0 2020: R+0.0 2016: R+8.2 2012: D+2.9 2008: D+6.0
Not yet ingested
- Civics
- —
Market trends
- HPI YoY
- ▼ -118.82%
- Current HPI
- 467.2466
- Rent YoY
- ▲ 16.07%
- Metro
- New York-Newark-Jersey City, NY-NJ-PA
- State GDP YoY
- ▲ 2.60%
- F500 in state
- 92
Industry mix (Fortune 500 HQ in NY)
| Industry | F500 HQs | Revenue |
|---|---|---|
| Financial Services | 10 | $950B |
|
||
| Consumer Goods | 9 | $162B |
|
||
| Insurance | 4 | $225B |
|
||
| Telecommunications | 2 | $144B |
|
||
| Pharmaceuticals | 2 | $112B |
|
||
| Media / Entertainment | 2 | $69B |
|
||
Price history
+493.1% since first listed15 events — show timeline
- 2026-05-18 Listed $1,195,000 OneKey® MLS as Distributed by MLS Grid
- 2025-10-17 Listing Removed — OneKey® MLS as Distributed by MLS Grid
- 2025-09-13 Price Changed $1,425,000 OneKey® MLS as Distributed by MLS Grid
- 2025-09-02 Rental Removed $30,000 ONEKEY
- 2025-08-02 Price Changed $1,549,000 OneKey® MLS as Distributed by MLS Grid
- 2025-07-11 Price Changed $30,000 ONEKEY
- 2025-07-05 Price Changed $1,595,000 OneKey® MLS as Distributed by MLS Grid
- 2025-06-14 Listed for Rent $80,000 ONEKEY
- 2025-04-04 Price Changed $1,649,000 OneKey® MLS as Distributed by MLS Grid
- 2024-12-31 Listed $1,695,000 OneKey® MLS as Distributed by MLS Grid
- 2023-03-29 Sold (Public Records) $952,500 Public Records
- 2014-01-21 Sold (Public Records) $500,000 Public Records
- 2013-04-21 Listing Removed — OneKey® MLS as Distributed by MLS Grid
- 2012-10-06 Listed $574,999 OneKey® MLS as Distributed by MLS Grid
- 1990-10-01 Sold (Public Records) $201,500 Public Records
Property tax history
+7.7%/yrLatest (2022): $9,986 · +0.0% YoY. Source: county tax records.
Cash-flow waterfall
monthlySold comps — $/sqft
last 12 mo · ≤1 miLoading sold comps…