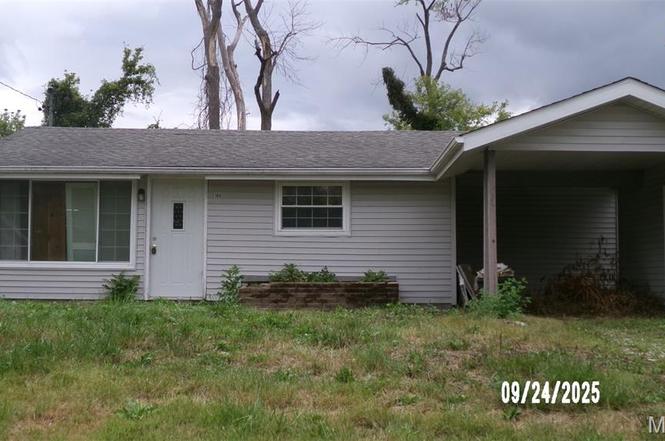
100 Cascade Dr · Belleville, IL
Flood risk 1/10 · Minimal
- FEMA flood zone
- X
- Chance of flooding over 30 yrs
- 0.0%
- Est. flood insurance / yr
- $507 – $1,088
Fire risk 1/10 · Minimal
- Est. fire insurance / yr
- $804 – $1,492
Heat risk 5/10 · Moderate
- Hot days now (above 107°F)
- 7 days/yr
- Hot days in 30 yrs
- 21 days/yr
Wind risk 2/10 · Minimal
- Chance of severe wind over 30 yrs
- 1.0%
Air-quality risk 3/10 · Minor
- Unhealthy air days now
- 2 days/yr
- Unhealthy air days in 30 yrs
- 3 days/yr
Risk factors via First Street. Map © Google.
Why this score? — see what drove the B+ grade
The composite is a weighted blend of 9 inputs, each scored 0–100. Each bar is that input's sub-score; the figure is the points it added to the 100-point composite (weight × sub-score).
- Cash flow +30.0/30.0
- 1% rule +10.0/10.0
- DSCR +10.0/10.0
- Appreciation +9.8/10.0
- ARV discount +7.5/15.0
- Livability +3.9/5.0
- Rent growth +2.5/5.0
- Condition / age +2.5/5.0
- Schools +2.2/10.0
$59,900
🖨 Deal sheet 📄 Offer letter ✓ Due diligence
Listing remarks MLS
Cute as can be 3 Bedroom, 1 Bath Totally Remodeled Home! Just a few of the UPDATES seller has completed: Roof 2014, Laminate Flooring 2015, 200 Amp Electrical Service, Remodel of Bathroom, Water Heater approx. 2 years old, 3rd Bedroom Carpet replaced 2015, Newer Windows, All Built In Appliances stay including Washer and Dryer, Kitchen remodeled 1-2 Years ago. Neutral Paint Colors. Call Your Favorite Realtor Today for your Tour!
Key facts
- Newer kitchen
- Laundry room
- Family room
Tags
Property features AI
Finance
- Other: Ownership by contract
- Financial info: Seller may consider concessions; Lease not considered
Exterior
- Parking: Carport (1 space)
- Utilities: Public water; Public sewer; Electric service by Ameren; Natural gas available; Electricity available
- Home design: Single-family residence; One story; Sold as fixer
- Construction: Vinyl siding; Asphalt roof; Slab foundation; Built year not provided
- Exterior features: Lot of approximately 0.18 acres
Interior
- Kitchen: Kitchen on the main level
- Bedrooms: 3 bedrooms, all on the main level
- Flooring: No flooring details provided
- Bathrooms: 1 full bathroom on the main level
- Heating & cooling: No central cooling
- Interior features: 7 total rooms; Family room on main level
- Laundry & utility: Laundry room on the main level
Neighborhood map
What this means for you Summary
Snapshot
- This is a 3-bed/2.0-bath single-family listed at $60k.
Deal economics
- At list price, monthly cash flow is $538 ($6k/yr) — positive.
- The deal already cash-flows at list — no discount required.
- Meets the 1% rule at list price ($1k rent vs $60k).
- Recommended offer: $53k (12.0% below list) — sets the bar for market timing.
- Cap rate 17.1% vs local median 5.6% in Belleville — top-decile yield for the area; either an underpriced asset or a hidden risk that comps aren't pricing in. Stress-test before assuming the spread holds.
Location & tenants
- Location reads 78/100 on livability (#142 in IL, #2,604 nationally) — a middle-class / working-renter tenant base. Strengths: commute A+, cost of living A+, housing A+; Watch: crime F, amenities D-.
- Belleville Twp Hsd 201 (suburban): math 21% / reading 28% proficiency, ranked #308 of 620 in IL (top 50%) — low school quality limits family demand, transient renter base, plan for 1-2y turnover.
- Zoned schools: Belleville High School-West (math 19% / reading 26%, grade F, #317 of 693 statewide, top 46%, 2,234 students, 0% FRL).
- Market conditions: 103 active listings in the ZIP; 2 comparable units currently listed for rent nearby; 783 units permitted in St. Clair County in 2024 (378 in 5+ unit buildings).
Forward outlook
- In year one you build about $6k of equity ($414 loan paydown + $6k appreciation (9.5% local appreciation)).
- St. Clair County population projected at -23% by 2050 — secular population decline; favor cash flow + early exit over multi-decade hold.
- At projected returns (9.5% appreciation + 3.0% rent growth), your $17k cash investment doubles in ~2 years — after that, you're playing with house money.
- By year 6, paydown + projected appreciation supports a ~$36k cash-out refi (75% LTV) — recoverable capital for the next deal without selling this one.
Negotiation context
- It's been on market 195 days — a 12% lower offer ($53k) is reasonable based on typical stale-listing flexibility.
- 3 sale attempts since 10y ago; this cycle's ask has dropped $15k (20%) from the opening price — seller is motivated, your offer sets the floor, not the list.
Risks & watch-outs
- Watch-outs: property tax is 3.8% of price; built in 1955 — expect roof / HVAC / electrical / plumbing capex.
- Climate carrying-cost: extreme-heat days projected 7→21/yr by 2055 (HVAC capex compounding) — expect insurance premiums to compound above CPI over the hold.
Questions for the listing agent
- It's been on market 195 days. Have you received any prior offers? Is the seller open to a 12% concession, seller financing, or rate buy-down credit?
- Built in 1955 — when were the roof, HVAC, electrical panel, plumbing, and water heater last replaced?
- Property tax is high relative to price — has the assessment been appealed recently, and will the sale trigger a re-assessment?
- Why hasn't it sold? Are there any deal-killer items the seller is aware of (foundation, flood, title, zoning, code violations)?
- Is there a deadline driving the sale (1031 exchange, divorce, estate, relocation)? That informs how much negotiation room exists.
- Crime grade is F in this area — have there been break-ins, vandalism, or insurance claims at this property in the last 3 years? What carrier currently insures it and at what premium?
- What's the average days-on-market for RENTAL listings here right now (not sales)? A rising rental-DOM trend means longer vacancies and softer asking-rent achievability than the comps imply.
- What's the recent tenant-quality profile in this submarket — average credit score on applications, eviction rate, late-payment / NSF rate, and stable-employment percentage? A property-management company in the area should have these aggregated.
- How much new for-sale + rental construction is in the pipeline within 1–3 miles? Heavy new supply typically softens prices + rents 12–24 months out; constrained supply supports both.
Investment metrics
- 1% rule
- 2.25% ✓
- Cap rate
- 17.06%
- Cash-on-cash
- 38.46%
- DSCR
- 2.71
- GRM
- 3.7
CMA / ARV
- ARV (on-the-fly)
- $158,304
- Comps found
- 12
Show comp detail 12 sales within ~0.75 mi
| Address | Dist | Beds/Ba | Sqft | Sold | Price | $/sf | Match |
|---|---|---|---|---|---|---|---|
| 100 Cascade Dr | 0.00mi | 3/1.0 | 1,164 (0%) | 1mo | $59,900 | $51 | 96 |
| 217 Cascade Dr | 0.16mi | 2/1.0 (-1) | 1,164 (0%) | 11mo | $125,000 | $107 | 74 |
| 19 Cascade Dr | 0.04mi | 3/2.0 | 1,236 (+6%) | 18mo | $184,900 | $150 | 73 |
| 21 Richard Pl | 0.38mi | 3/1.0 | 1,104 (-5%) | 4mo | $150,000 | $136 | 66 |
| 524 Pembroke Dr | 0.31mi | 3/1.0 | 1,161 (-0%) | 18mo | $100,000 | $86 | 66 |
| 512 Pembroke Dr | 0.26mi | 3/2.0 | 1,069 (-8%) | 10mo | $160,000 | $150 | 65 |
| 520 Pembroke Dr | 0.29mi | 3/1.0 | 1,248 (+7%) | 21mo | $149,900 | $120 | 53 |
| 29 Villa Dr | 0.56mi | 3/2.0 | 1,120 (-4%) | 18mo | $149,000 | $133 | 52 |
| 621 Eiler Rd | 0.50mi | 3/1.0 | 1,272 (+9%) | 7mo | $176,900 | $139 | 52 |
| 540 Valencia Dr | 0.50mi | 4/2.0 (+1) | 1,050 (-10%) | 13mo | $82,500 | $79 | 44 |
| 631 Monica | 0.66mi | 3/1.0 | 1,057 (-9%) | 7mo | $145,999 | $138 | 44 |
| 8317 Old Saint Louis Rd | 0.50mi | 2/1.0 (-1) | 1,060 (-9%) | 12mo | $180,000 | $170 | 43 |
Match score weights: distance 35% · size 25% · config 20% · recency 20%. Top-matched comps best support the ARV.
Projected returns pro-forma
9.5% appreciation · 3.0% rent growth · sell at horizon
- IRR
- 53.3%
- Equity multiple
- 4.87×
- Total profit
- $64,911
- Equity at exit
- $51,790
- IRR
- 47.3%
- Equity multiple
- 10.77×
- Total profit
- $163,915
- Equity at exit
- $109,453
Cash invested: $16,772 (down + closing). Projections, not guarantees.
Landlord ↔ Tenant lean methodology
- Overall (STATE)
- 43 Moderately Tenant-Leaning
- State Illinois
- 43 Moderately Tenant-Leaning · D+7
- County
- — inherits STATE
- City
- — inherits STATE
ZIP-level market 62223
- Home prices YoY
- 3.8%
- Active inventory
- 103
- Price-to-rent
- 3.7×
Monthly cashflow live
- Estimated rent
- $1,348 medium interval (Pro) →
- Mortgage (P&I)
- −$314
- Tax from tax record
- −$188 /mo · $2,254/yr
- Insurance
- −$25
- HOA
- −$0
- Vacancy / Maint / Mgmt
- −$283
- Net cashflow
- $538
Break-even live
UW: 25.0% down · 7.5% · 30yr · 1.5% tax · 5.0% vac · 8.0% maint · 8.0% mgmt
Financing live
Cash to close
- Down payment
- $14,975
- Closing costs
- $1,797
- Reserves months
- —
- Total cash needed
- —
Loan-product check · same deal, 3 products live
Conventional
25% down · 7.5% · 30yr
- Down + closing
- —
- Monthly P&I
- —
- Monthly cashflow
- —
- DSCR
- —
- Eligible?
- —
Personal DTI + credit; lowest rate.
DSCR
20% down · 8.5% · 30yr
- Down + closing
- —
- Monthly P&I
- —
- Monthly cashflow
- —
- DSCR
- —
- Eligible?
- —
No personal income docs; deal must DSCR.
Hard money
10% down · 12.0% · 12mo
- Down + closing
- —
- Monthly P&I
- —
- Monthly cashflow
- —
- DSCR
- —
- Eligible?
- —
Short-term bridge; refi at stabilization.
Rent comps 2 comps
| Address | Beds | Baths | Sqft | Rent | $/sqft | DOM | Units | Dist |
|---|---|---|---|---|---|---|---|---|
| 7235 Westfield Plaza Dr Belleville, IL | 1.0–2.0 | 1.0 | 795 | $975 | $1.23 | 2d | 1 | 1.04mi |
| 920 S 74th St Belleville, IL | 2.0 | 1.0 | 1300 | $1,400 | $1.08 | 12d | 1 | 1.15mi |
Listing history 13 events
-
2026-05-13status Pending
-
2026-04-07price $59,900
-
2026-03-05status Active
-
2026-03-05price $66,000
-
2026-02-14price $70,000
-
2025-10-24$75,000 Active
-
2016-10-05soldstatus $60,000
-
2016-09-30soldstatus Closed 431-char remark
Show marketing remark (431 chars)
Cute as can be 3 Bedroom, 1 Bath Totally Remodeled Home! Just a few of the UPDATES seller has completed: Roof 2014, Laminate Flooring 2015, 200 Amp Electrical Service, Remodel of Bathroom, Water Heater approx. 2 years old, 3rd Bedroom Carpet replaced 2015, Newer Windows, All Built In Appliances stay including Washer and Dryer, Kitchen remodeled 1-2 Years ago. Neutral Paint Colors. Call Your Favorite Realtor Today for your Tour!
-
2016-09-23historical Active Under Contract 431-char remark
Show marketing remark (431 chars)
Cute as can be 3 Bedroom, 1 Bath Totally Remodeled Home! Just a few of the UPDATES seller has completed: Roof 2014, Laminate Flooring 2015, 200 Amp Electrical Service, Remodel of Bathroom, Water Heater approx. 2 years old, 3rd Bedroom Carpet replaced 2015, Newer Windows, All Built In Appliances stay including Washer and Dryer, Kitchen remodeled 1-2 Years ago. Neutral Paint Colors. Call Your Favorite Realtor Today for your Tour!
-
2016-06-22status Pending 431-char remark
Show marketing remark (431 chars)
Cute as can be 3 Bedroom, 1 Bath Totally Remodeled Home! Just a few of the UPDATES seller has completed: Roof 2014, Laminate Flooring 2015, 200 Amp Electrical Service, Remodel of Bathroom, Water Heater approx. 2 years old, 3rd Bedroom Carpet replaced 2015, Newer Windows, All Built In Appliances stay including Washer and Dryer, Kitchen remodeled 1-2 Years ago. Neutral Paint Colors. Call Your Favorite Realtor Today for your Tour!
-
2016-05-22$59,900 Active 431-char remark
Show marketing remark (431 chars)
Cute as can be 3 Bedroom, 1 Bath Totally Remodeled Home! Just a few of the UPDATES seller has completed: Roof 2014, Laminate Flooring 2015, 200 Amp Electrical Service, Remodel of Bathroom, Water Heater approx. 2 years old, 3rd Bedroom Carpet replaced 2015, Newer Windows, All Built In Appliances stay including Washer and Dryer, Kitchen remodeled 1-2 Years ago. Neutral Paint Colors. Call Your Favorite Realtor Today for your Tour!
-
2005-06-28soldstatus $68,500
-
1998-04-20soldstatus $38,500
ⓘ Source: listings_history table (triggers on properties + properties_extension) + one-shot
backfill from property_details.listing_events for pre-trigger history.
Tax reassessment forecast IL · Partial reset (capped growth)
- Current annual tax
- $2,254 · $188/mo
- Projected year-2 tax
- $2,254 · $188/mo
- Expected delta
- $0/yr ($0/mo · 0.0%)
ⓘ Screening estimate from a state-policy table — verify with the county assessor before closing.
Climate risk First Street
- Flood 1/10 Low FEMA zone X · 0% chance over 30 yrs
- Wildfire 1/10 Low
- Heat 5/10 Major 7 d/yr ≥107°F today · 21 d/yr by 30 yrs out
- Wind 2/10 Low 100% chance of damaging wind over 30 yrs
- Air quality 3/10 Moderate 2 unhealthy d/yr today · 3 by 30 yrs out
Nearby sold comps map
Loading sold comps map…
Walkable amenities ~0.75 mi
Loading nearby amenities…
Taxation est. · year 1
- Rental income
- $16,170
- − Mortgage interest
- −$3,355
- − Property taxes
- −$2,254
- − Insurance
- −$300
- − Repairs & maintenance
- −$1,294
- − Management
- −$1,294
- − Depreciation
- −$1,743
- Taxable income
- $5,931
- Est. tax owed @ 24.0%
- −$1,424
- After-tax cash flow
- $5,028/yr
For passive investors: Depreciation is non-cash, so a rental often shows a tax loss while cash-flowing — sheltering income. Rental losses are passive: they offset passive income freely, and up to $25,000/yr can offset ordinary (W-2) income if you actively participate and your MAGI is under $100k (phasing out to $0 by $150k); unused losses carry forward. On sale, claimed depreciation is recaptured at up to 25%, and gains may owe capital-gains tax (a 1031 exchange can defer both). Figures are a year-1 estimate at your 24.0% rate — not tax advice; consult a CPA.
Schools (NCES district)
- District
- Belleville Twp Hsd 201
- NCES district ID
- 1705640
- Math proficiency
- 21% ▼ -8.00%
- Reading proficiency
- 28% ▼ -3.00%
- Median HH income
- $58,064
- Composite
- 22.39/100
- National rank
- #8115
- State rank
- #308 of 620 in IL
Livability — Belleville
- Score
- 78/100
- State rank
- #142
- US rank
- #2604
Category grades
Schools grade is shown separately in the Schools card above.
Census & demographics
- County
- Saint Clair County · 169,691 people
- City population
- 47,407
- Metro
- St. Louis, MO-IL
- Population (ZIP)
- 16,269
- Household income
- $73,700
- Rent vs Own
- Severe rent burden
- 656.0
Population outlook (St. Clair County) Hauer SSP2
- Today (2025)
- 250,366 people
- By 2030
- 240,511 · -3.9%
- By 2040
- 217,391 · -13.2%
- By 2050
- 192,699 · -23.0%
- By 2075
- 140,637 · -43.8%
- By 2100
- 100,499 · -59.9%
Race, ethnicity, and origin ACS 2023
- Neighborhood character
- Majority White (62%)
- Race & ethnicity
- White 62% Black 27% Two or more races 9% Hispanic / Latino 4%
- Common ancestry
- Romanian 3% Lithuanian 3% Slovak 2%
- Foreign-born
- 2% · Canada, Guatemala
- Languages at home
- 96% English-only · Spanish 2%
Political lean MEDSL · St. Clair
- 2024 margin
- Lean D (+7.9) · D 53.0% · R 45.1% · Other 1.8%
- 2008→2024 swing
- -14.6pp toward R · 2008: 22.4pp · 2024: 7.9pp
- All cycles
- 2024: D+7.9 2020: D+8.7 2016: D+5.6 2012: D+14.5 2008: D+22.4
Not yet ingested
- Civics
- —
Market trends
- HPI YoY
- ▲ 9.50%
- Current HPI
- 259.15
- Rent YoY
- —
- Metro
- St. Louis, MO-IL
- State GDP YoY
- ▲ 1.59%
- F500 in state
- 60
Industry mix (Fortune 500 HQ in IL)
| Industry | F500 HQs | Revenue |
|---|---|---|
| Insurance | 4 | $201B |
|
||
| Consumer Goods | 4 | $87B |
|
||
| Industrial Machinery | 3 | $64B |
|
||
| Healthcare | 2 | $55B |
|
||
| Retail / Pharmacy | 1 | $148B |
|
||
| Agriculture / Food | 1 | $86B |
|
||
Price history
+55.6% since first listed13 events — show timeline
- 2026-05-13 Pending — MARIS as Distributed by MLS Grid
- 2026-04-07 Price Changed $59,900 MARIS as Distributed by MLS Grid
- 2026-03-05 Relisted — MARIS as Distributed by MLS Grid
- 2026-03-05 Price Changed $66,000 MARIS as Distributed by MLS Grid
- 2026-02-14 Price Changed $70,000 MARIS as Distributed by MLS Grid
- 2025-10-24 Listed $75,000 MARIS as Distributed by MLS Grid
- 2016-10-05 Sold (Public Records) $60,000 Public Records
- 2016-09-30 Sold (MLS) — MARIS as Distributed by MLS Grid
- 2016-09-23 Contingent — MARIS as Distributed by MLS Grid
- 2016-06-22 Pending — MARIS as Distributed by MLS Grid
- 2016-05-22 Listed $59,900 MARIS as Distributed by MLS Grid
- 2005-06-28 Sold (Public Records) $68,500 Public Records
- 1998-04-20 Sold (Public Records) $38,500 Public Records
Property tax history
+8.6%/yrLatest (2024): $2,254 · +6.9% YoY. Source: county tax records.
Cash-flow waterfall
monthlySold comps — $/sqft
last 12 mo · ≤1 miLoading sold comps…