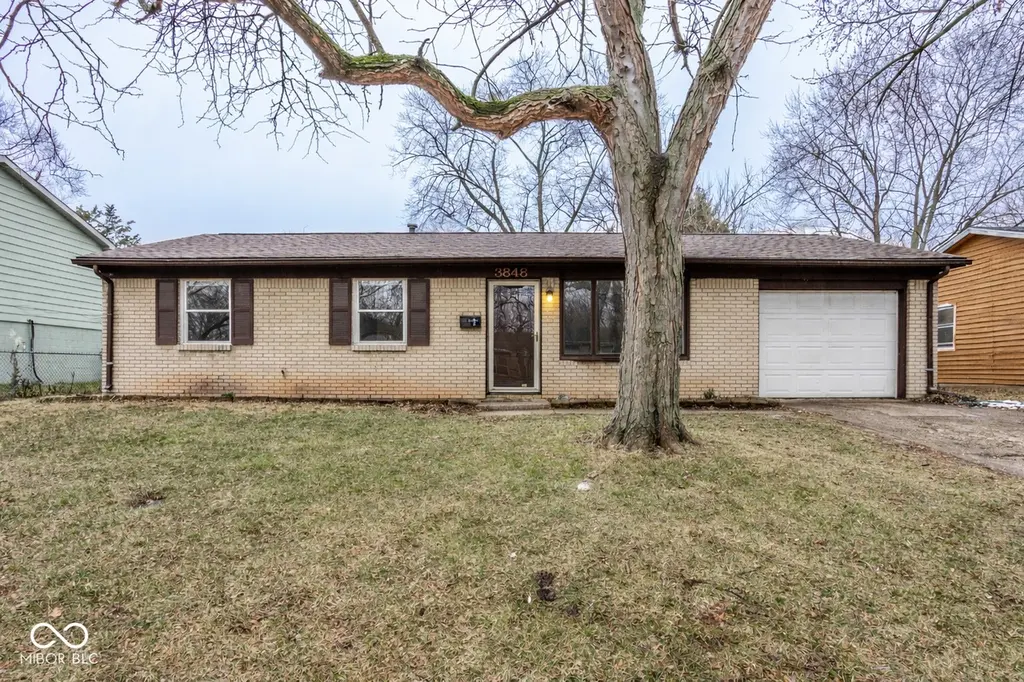
3848 Richelieu Rd · Indianapolis city (balance), IN
Flood risk 1/10 · Minimal
- FEMA flood zone
- X (unshaded)
- Chance of flooding over 30 yrs
- 0.0%
- Est. flood insurance / yr
- $507 – $1,088
Fire risk 1/10 · Minimal
- Est. fire insurance / yr
- $717 – $1,331
Heat risk 3/10 · Minor
- Hot days now (above 101°F)
- 7 days/yr
- Hot days in 30 yrs
- 18 days/yr
Wind risk 2/10 · Minimal
- Chance of severe wind over 30 yrs
- 0.0%
Air-quality risk 3/10 · Minor
- Unhealthy air days now
- 3 days/yr
- Unhealthy air days in 30 yrs
- 4 days/yr
Risk factors via First Street. Map © Google.
Why this score? — see what drove the D grade
The composite is a weighted blend of 9 inputs, each scored 0–100. Each bar is that input's sub-score; the figure is the points it added to the 100-point composite (weight × sub-score).
- ARV discount +14.5/15.0
- Cash flow +10.6/30.0
- Rent growth +4.2/5.0
- 1% rule +3.9/10.0
- DSCR +3.1/10.0
- Livability +2.5/5.0
- Condition / age +2.5/5.0
- Schools +1.4/10.0
- Appreciation +0.0/10.0
$162,500
🖨 Deal sheet (PDF) 📄 Offer letter ✓ Due diligence
Listing remarks MLS
This move-in-ready 3-bedroom, 1-bath ranch offers a smart layout with two separate living spaces, giving you flexibility for everyday living, entertaining, or even a home office setup. Recent updates include fresh interior paint, new LVP flooring, and an updated bathroom, so you can settle in with confidence. The home also features a 1-car garage, a back porch for relaxing or grilling, and a fully fenced backyard-ideal for pets, play, or outdoor gatherings. A solid, well-maintained option with updates already done, this house is ready for you to make it home.
Key facts
- Back porch
- New lvp flooring
- Fresh interior paint
Tags
Neighborhood map
What this means for you Summary
Snapshot
- This is a 3-bed/1.0-bath single-family listed at $162k.
Deal economics
- At list price, monthly cash flow is $-80 ($-962/yr) — negative.
- To cash-flow at today's rent, offer at most $148k (8.7% below list).
- To meet the 1% rule (rent ≥ 1% of price), the offer needs to be $145k (10.8% below list).
- Recommended offer: $145k (10.8% below list) — sets the bar for 1% rule.
- Cap rate 5.7% vs local median 4.4% in Indianapolis city (balance) — top-decile yield for the area; either an underpriced asset or a hidden risk that comps aren't pricing in. Stress-test before assuming the spread holds.
Location & tenants
- Location reads: area grade D — affects rentability + tenant quality, not the cash-flow math above.
- Indianapolis Public Schools (urban): math 14% / reading 20% proficiency, ranked #286 of 301 in IN (top 95%) — low school quality limits family demand, transient renter base, plan for 1-2y turnover; 77% free/reduced lunch — lower-income household profile, screen leases tightly.
- Zoned schools: Center For Inquiry School 84 (math 64% / reading 69%, grade B+, #65 of 994 statewide, top 7%, 469 students, 8% FRL); H L Harshman Middle School (math 3% / reading 16%, grade F, #316 of 330 statewide, top 96%, 549 students, 84% FRL) — zoned schools average 46% FRL vs 77% district-wide (31 pts lower); this property's tenant base skews higher-income than the district average.
- Zoned-school proficiency averages 38% at this address vs 17% district-wide (+21 pts) — the actual schools serving this property are materially stronger than the Indianapolis Public Schools average implies; a family-tenant draw the district grade alone would hide.
- Market conditions: Rents rising fast (+6.8%/yr); 153 active listings in the ZIP; 33 comparable units currently listed for rent nearby; rentals at typical pace (median 17d on market — plan ~3-4 weeks tenant-placement turnaround); 1,906 units permitted in Marion County in 2024 (621 in 5+ unit buildings).
- This rent runs 35% of the median local income ($50k/yr) — at the standard rent-burdened threshold; future hikes will face affordability resistance.
Forward outlook
- Local home prices are declining (-3.0%/yr); year-one equity from $1k of loan paydown is wiped out by about $5k of value loss. Plan a longer hold.
- Marion County population projected at +18% by 2050 — long-run rental-demand tailwind backs the buy-and-hold thesis.
Negotiation context
- It's been on market 108 days — a 9% lower offer ($148k) is reasonable based on typical stale-listing flexibility.
- 9 sale attempts since 26y ago; this cycle's ask has dropped $22k (12%) from the opening price — seller is motivated, your offer sets the floor, not the list.
Questions for the listing agent
- What do current leases actually rent for vs. the listed asking? Can we see a recent rent roll and the last 12 months of T-12 income?
- It's been on market 108 days. Have you received any prior offers? Is the seller open to a 11% concession, seller financing, or rate buy-down credit?
- Built in 1963 — when were the roof, HVAC, electrical panel, plumbing, and water heater last replaced?
- Why hasn't it sold? Are there any deal-killer items the seller is aware of (foundation, flood, title, zoning, code violations)?
- Is there a deadline driving the sale (1031 exchange, divorce, estate, relocation)? That informs how much negotiation room exists.
- The area grade is low — what's the realistic commute time and amenity access for the typical tenant pool here? Any planned neighborhood developments (good or bad) we should know about?
- What's the average days-on-market for RENTAL listings here right now (not sales)? A rising rental-DOM trend means longer vacancies and softer asking-rent achievability than the comps imply.
- What's the recent tenant-quality profile in this submarket — average credit score on applications, eviction rate, late-payment / NSF rate, and stable-employment percentage? A property-management company in the area should have these aggregated.
- How much new for-sale + rental construction is in the pipeline within 1–3 miles? Heavy new supply typically softens prices + rents 12–24 months out; constrained supply supports both.
Investment metrics
- 1% rule
- 0.89% ✗
- Cap rate
- 5.70%
- Cash-on-cash
- -2.12%
- DSCR
- 0.91
- GRM
- 9.3
CMA / ARV
- ARV (median comp)
- $192,593
- List price
- $162,500
- Delta
- -15.63%
- Verdict
- UNDERPRICED
- Comps
- 20 within 1.0 mi
Show comp detail 12 sales within ~0.75 mi
| Address | Dist | Beds/Ba | Sqft | Sold | Price | $/sf | Match |
|---|---|---|---|---|---|---|---|
| 3640 Marseille Rd | 0.28mi | 3/1.5 | 1,537 (+1%) | 3mo | $182,000 | $118 | 82 |
| 8445 Montery Rd | 0.22mi | 4/1.5 (+1) | 1,473 (-4%) | 2mo | $198,000 | $134 | 76 |
| 3710 Chateau Ct | 0.20mi | 3/1.5 | 1,421 (-7%) | 6mo | $110,000 | $77 | 72 |
| 3531 Lombardy Pl | 0.42mi | 3/2.0 | 1,526 (-0%) | 7mo | $180,000 | $118 | 71 |
| 3856 Catalina Ct | 0.19mi | 3/1.0 | 1,344 (-12%) | 3mo | $135,000 | $100 | 69 |
| 3748 Decamp Dr | 0.24mi | 4/2.0 (+1) | 1,605 (+5%) | 4mo | $237,500 | $148 | 68 |
| 4040 Aspen Way | 0.26mi | 3/1.0 | 1,344 (-12%) | 1mo | $147,000 | $109 | 67 |
| 3647 Richelieu Rd | 0.25mi | 4/1.5 (+1) | 1,421 (-7%) | 7mo | $155,000 | $109 | 64 |
| 3630 Alsace Dr | 0.29mi | 3/1.0 | 1,722 (+13%) | 5mo | $185,000 | $107 | 62 |
| 3771 Decamp Dr | 0.21mi | 4/2.5 (+1) | 1,692 (+11%) | 5mo | $211,000 | $125 | 56 |
| 8423 Athens Ct | 0.52mi | 3/2.0 | 1,653 (+8%) | 2mo | $202,000 | $122 | 56 |
| 9036 E 36th St | 0.66mi | 4/2.0 (+1) | 1,458 (-4%) | 6mo | $210,000 | $144 | 48 |
Match score weights: distance 35% · size 25% · config 20% · recency 20%. Top-matched comps best support the ARV.
Projected returns pro-forma
-3.0% appreciation · 6.76% rent growth · sell at horizon
- IRR
- -15.2%
- Equity multiple
- 0.44×
- Total profit
- $-25,662
- Equity at exit
- $24,229
- IRR
- -0.9%
- Equity multiple
- 0.93×
- Total profit
- $-3,337
- Equity at exit
- $14,050
Cash invested: $45,500 (down + closing). Projections, not guarantees.
Landlord ↔ Tenant lean methodology
- Overall (STATE)
- 90 Strongly Landlord-Friendly
- State Indiana
- 90 Strongly Landlord-Friendly · R+11
- County
- — inherits STATE
- City
- — inherits STATE
ZIP-level market 46226
- Rents YoY
- 6.8%
- Active inventory
- 153
- Price-to-rent
- 9.3×
Monthly cashflow live
- Estimated rent
- $1,450 high interval (Pro) →
- Mortgage (P&I)
- −$852
- Tax from tax record
- −$306 /mo · $3,669/yr
- Insurance
- −$68
- HOA
- −$0
- Vacancy / Maint / Mgmt
- −$304
- Net cashflow
- $-80
Break-even live
Sensitivity live
| Price | -10% $12 | -5% $-34 | +0% $-80 | +5% $-126 | +10% $-172 |
|---|---|---|---|---|---|
| Rent | -10% $-195 | -5% $-137 | +0% $-80 | +5% $-23 | +10% $34 |
| Rate | -1.0pp $2 | -0.5pp $-39 | base $-80 | +0.5pp $-122 | +1.0pp $-165 |
UW: 25.0% down · 7.5% · 30yr · 1.5% tax · 5.0% vac · 8.0% maint · 8.0% mgmt
Financing live
Cash to close
- Down payment
- $40,625
- Closing costs
- $4,875
- Reserves months
- —
- Total cash needed
- —
Loan-product check · same deal, 3 products live
Conventional
25% down · 7.5% · 30yr
- Down + closing
- —
- Monthly P&I
- —
- Monthly cashflow
- —
- DSCR
- —
- Eligible?
- —
Personal DTI + credit; lowest rate.
DSCR
20% down · 8.5% · 30yr
- Down + closing
- —
- Monthly P&I
- —
- Monthly cashflow
- —
- DSCR
- —
- Eligible?
- —
No personal income docs; deal must DSCR.
Hard money
10% down · 12.0% · 12mo
- Down + closing
- —
- Monthly P&I
- —
- Monthly cashflow
- —
- DSCR
- —
- Eligible?
- —
Short-term bridge; refi at stabilization.
Rent comps 33 comps
| Address | Beds | Baths | Sqft | Rent | $/sqft | DOM | Units | Dist |
|---|---|---|---|---|---|---|---|---|
| 8513 E 37th Pl Indianapolis, IN | 4.0 | 1.5 | 1645 | $1,525 | $0.93 | 0d | 1 | 0.14mi |
| 3821 Biscayne Rd Indianapolis, IN | 4.0 | 1.5 | 1188 | $1,325 | $1.12 | 16d | 1 | 0.29mi |
| 3823 Biscayne Rd Indianapolis, IN | 4.0 | 1.5 | 1188 | $1,320 | $1.11 | 16d | 1 | 0.29mi |
| 3815 Biscayne Rd Indianapolis, IN | 3.0 | 1.5 | 1188 | $1,220 | $1.03 | 16d | 1 | 0.29mi |
| 3829 Biscayne Rd Indianapolis, IN | 4.0 | 1.5 | 1188 | $1,320 | $1.11 | 16d | 1 | 0.30mi |
| 8203 Penway St Indianapolis, IN | 3.0 | 1.5 | 1360 | $1,500 | $1.10 | 25d | 1 | 0.34mi |
| 8738 Montery Rd Indianapolis, IN | 3.0 | 1.0 | 1421 | $1,331 | $0.94 | 0d | 1 | 0.37mi |
| 8862 Bel Air Ct Indianapolis, IN | 3.0 | 1.0 | 1073 | $1,264 | $1.18 | 19d | 1 | 0.40mi |
| 7925 Crossbridge Dr Indianapolis, IN | 2.0 | 2.0 | 1072 | $1,200 | $1.12 | 45d | 1 | 0.49mi |
| 3540 Dubarry Ct Indianapolis, IN | 3.0 | 2.0 | 1297 | $1,400 | $1.08 | 25d | 1 | 0.49mi |
| 8914 Elmonte Dr Indianapolis, IN | 3.0 | 1.5 | 1500 | $1,600 | $1.07 | 25d | 1 | 0.49mi |
| 8501 Athens Ct Indianapolis, IN | 4.0 | 1.0 | 1225 | $1,475 | $1.20 | 16d | 1 | 0.53mi |
| 8501 Athens Ct Indianapolis, IN | 4.0 | 1.0 | 1225 | $1,400 | $1.14 | 0d | 1 | 0.53mi |
| 4315 Aspen Way Indianapolis, IN | 3.0 | 1.0 | 1080 | $1,380 | $1.28 | 45d | 1 | 0.60mi |
| 3513 Roseway Dr Indianapolis, IN | 3.0 | 2.0 | 1216 | $1,600 | $1.32 | 19d | 1 | 0.60mi |
| 8254 Meadowlark Dr Indianapolis, IN | 3.0 | 1.5 | 1320 | $1,150 | $0.87 | 23d | 1 | 0.64mi |
| 8254 Meadowlark Dr Unit 1 Indianapolis, IN | 3.0 | 1.5 | 1320 | $1,150 | $0.87 | 45d | 1 | 0.64mi |
| 7937 E 34th St Indianapolis, IN | 4.0 | 1.0 | 1450 | $2,000 | $1.38 | 25d | 1 | 0.73mi |
| 3644 Celtic Dr Indianapolis, IN | 4.0 | 1.5 | 1637 | $1,500 | $0.92 | 16d | 1 | 0.81mi |
| 9226 E 36th Pl Indianapolis, IN | 3.0 | 1.0 | 1073 | $1,250 | $1.16 | 9d | 1 | 0.83mi |
| 7531 Penway St Indianapolis, IN | 3.0 | 1.5 | 1237 | $1,551 | $1.25 | 9d | 1 | 0.86mi |
| 3722 Ireland Dr Indianapolis, IN | 3.0 | 2.0 | 1682 | $1,700 | $1.01 | 45d | 1 | 0.86mi |
| 3747 Ireland Dr Indianapolis, IN | 4.0 | 1.5 | 1400 | $1,700 | $1.21 | 25d | 1 | 0.88mi |
| 9438 Conried Dr Indianapolis, IN | 3.0 | 1.0 | 1094 | $1,445 | $1.32 | 6d | 1 | 0.98mi |
| 3525 Luewan Ct Indianapolis, IN | 4.0 | 1.0 | 1107 | $1,750 | $1.58 | 25d | 1 | 1.01mi |
| 9513 Baker Ct Indianapolis, IN | 4.0 | 2.0 | 1702 | $1,825 | $1.07 | 9d | 1 | 1.03mi |
| 3519 Jerome Ct Indianapolis, IN | 4.0 | 1.0 | 1107 | $1,995 | $1.80 | 25d | 1 | 1.06mi |
| 3416 N Hartman Dr Indianapolis, IN | 3.0 | 1.0 | 1421 | $1,300 | $0.91 | 0d | 1 | 1.24mi |
| 3775 Allerton Pl Indianapolis, IN | 1.0–4.0 | 2.0 | 1068 | $1,617 | $1.51 | 15d | 1 | 1.26mi |
| 9634 Meadowlark Dr Indianapolis, IN | 3.0 | 1.5 | 1546 | $1,550 | $1.00 | 18d | 1 | 1.33mi |
| 9962 Catalina Dr Indianapolis, IN | 3.0 | 1.0 | 1236 | $1,600 | $1.29 | 5d | 1 | 1.41mi |
| 9949 Ellis Dr Indianapolis, IN | 4.0 | 2.0 | 1421 | $1,580 | $1.11 | 4d | 1 | 1.46mi |
| 3900 N Shadeland Ave Indianapolis, IN | 1.0–2.0 | 1.0 | 1070 | $1,075 | $1.00 | 4d | 6 | 1.50mi |
Listing history 36 events
-
2026-06-21days on market $162,500 Active 108 DOM
-
2026-06-18days on market $162,500 Active 105 DOM
-
2026-06-17days on market $162,500 Active 104 DOM
-
2026-06-16days on market $162,500 Active 103 DOM
-
2026-06-15days on market $162,500 Active 102 DOM
-
2026-06-13days on market $162,500 Active 100 DOM
-
2026-06-13pricedays on market $162,500 Active 99 DOM
-
2026-06-09days on market $169,900 Active 96 DOM
-
2026-06-08days on market $169,900 Active 95 DOM
-
2026-06-07days on market $169,900 Active 94 DOM
-
2026-06-03days on market $169,900 Active 90 DOM
-
2026-06-02days on market $169,900 Active 89 DOM
-
2026-06-01days on market $169,900 Active 88 DOM
-
2026-05-31days on market $169,900 Active 87 DOM
-
2026-04-20price $177,000 568-char remark
Show marketing remark (568 chars)
This move-in-ready 3-bedroom, 1-bath ranch offers a smart layout with two separate living spaces, giving you flexibility for everyday living, entertaining, or even a home office setup. Recent updates include fresh interior paint, new LVP flooring, and an updated bathroom, so you can settle in with confidence. The home also features a 1-car garage, a back porch for relaxing or grilling, and a fully fenced backyard-ideal for pets, play, or outdoor gatherings. A solid, well-maintained option with updates already done, this house is ready for you to make it home.
-
2026-03-11price $179,900 568-char remark
Show marketing remark (568 chars)
This move-in-ready 3-bedroom, 1-bath ranch offers a smart layout with two separate living spaces, giving you flexibility for everyday living, entertaining, or even a home office setup. Recent updates include fresh interior paint, new LVP flooring, and an updated bathroom, so you can settle in with confidence. The home also features a 1-car garage, a back porch for relaxing or grilling, and a fully fenced backyard-ideal for pets, play, or outdoor gatherings. A solid, well-maintained option with updates already done, this house is ready for you to make it home.
-
2026-03-05$185,000 Active 568-char remark
Show marketing remark (568 chars)
This move-in-ready 3-bedroom, 1-bath ranch offers a smart layout with two separate living spaces, giving you flexibility for everyday living, entertaining, or even a home office setup. Recent updates include fresh interior paint, new LVP flooring, and an updated bathroom, so you can settle in with confidence. The home also features a 1-car garage, a back porch for relaxing or grilling, and a fully fenced backyard-ideal for pets, play, or outdoor gatherings. A solid, well-maintained option with updates already done, this house is ready for you to make it home.
-
2022-05-20soldstatus $148,900 Closed 616-char remark
Show marketing remark (616 chars)
Welcome to this well maintained, move-in ready, adorable home! Pretty brick exterior with tidy garden beds. Front entry opens to light filled living room with laminate floors. Kitchen with attached and spacious eating area that can fit a large dining table. Separate large family room with wood burning fireplace offers a peaceful spot to relax at the end of the day. Sliding doors off the kitchen lead to large covered patio overlooking the private and fenced backyard. Home offers 3 good sized bedrooms as well. Laundry hookups in kitchen. Oversized attached one car garage with shelves and good space for storage.
-
2022-05-09status Pending 616-char remark
Show marketing remark (616 chars)
Welcome to this well maintained, move-in ready, adorable home! Pretty brick exterior with tidy garden beds. Front entry opens to light filled living room with laminate floors. Kitchen with attached and spacious eating area that can fit a large dining table. Separate large family room with wood burning fireplace offers a peaceful spot to relax at the end of the day. Sliding doors off the kitchen lead to large covered patio overlooking the private and fenced backyard. Home offers 3 good sized bedrooms as well. Laundry hookups in kitchen. Oversized attached one car garage with shelves and good space for storage.
-
2022-05-05$154,900 Active 616-char remark
Show marketing remark (616 chars)
Welcome to this well maintained, move-in ready, adorable home! Pretty brick exterior with tidy garden beds. Front entry opens to light filled living room with laminate floors. Kitchen with attached and spacious eating area that can fit a large dining table. Separate large family room with wood burning fireplace offers a peaceful spot to relax at the end of the day. Sliding doors off the kitchen lead to large covered patio overlooking the private and fenced backyard. Home offers 3 good sized bedrooms as well. Laundry hookups in kitchen. Oversized attached one car garage with shelves and good space for storage.
-
2009-01-03historical
-
2008-12-17soldstatus $21,000
-
2008-04-21$23,900
-
2008-03-02historical
-
2007-08-15$42,900
-
2007-03-16historical
-
2006-12-13$75,000
-
2006-02-28soldstatus $47,600
-
2005-08-31$59,900
-
2003-09-10soldstatus $39,900
-
2003-07-23$39,900
-
2001-07-31soldstatus $78,882
-
2001-07-23soldstatus $65,900
-
2001-06-14$66,900
-
2001-01-25historical
-
2000-07-26$66,000
ⓘ Source: listings_history table (triggers on properties + properties_extension) + one-shot
backfill from property_details.listing_events for pre-trigger history.
Tax reassessment forecast IN · Partial reset (capped growth)
- Current annual tax
- $3,669 · $306/mo
- Projected year-2 tax
- $3,669 · $306/mo
- Expected delta
- $0/yr ($0/mo · 0.0%)
ⓘ Screening estimate from a state-policy table — verify with the county assessor before closing.
Climate risk First Street
- Flood 1/10 Low FEMA zone X (unshaded) · 0% chance over 30 yrs
- Wildfire 1/10 Low
- Heat 3/10 Moderate 7 d/yr ≥101°F today · 18 d/yr by 30 yrs out
- Wind 2/10 Low 0% chance of damaging wind over 30 yrs
- Air quality 3/10 Moderate 3 unhealthy d/yr today · 4 by 30 yrs out
Nearby sold comps map
Loading sold comps map…
Walkable amenities ~0.75 mi
Loading nearby amenities…
Taxation est. · year 1
- Rental income
- $17,399
- − Mortgage interest
- −$9,103
- − Property taxes
- −$3,669
- − Insurance
- −$812
- − Repairs & maintenance
- −$1,392
- − Management
- −$1,392
- − Depreciation
- −$4,727
- Taxable loss
- −$3,696
- Est. tax savings @ 24.0%
- +$887
- After-tax cash flow
- $-75/yr
For passive investors: Depreciation is non-cash, so a rental often shows a tax loss while cash-flowing — sheltering income. Rental losses are passive: they offset passive income freely, and up to $25,000/yr can offset ordinary (W-2) income if you actively participate and your MAGI is under $100k (phasing out to $0 by $150k); unused losses carry forward. On sale, claimed depreciation is recaptured at up to 25%, and gains may owe capital-gains tax (a 1031 exchange can defer both). Figures are a year-1 estimate at your 24.0% rate — not tax advice; consult a CPA.
Schools (NCES district)
- District
- Indianapolis Public Schools
- NCES district ID
- 1804770
- Math proficiency
- 14% ▼ -7.00%
- Reading proficiency
- 20% ▼ -3.00%
- Median HH income
- $32,034
- Composite
- 13.69/100
- National rank
- #9499
- State rank
- #286 of 301 in IN
Livability — Indianapolis city (balance)
No livability data for this city. (Only ~50 U.S. cities are tracked.)
Census & demographics
- Census place
- Indianapolis city (balance), IN
- County
- Marion County · 998,460 people
- City population
- 881,119
- Metro
- Indianapolis-Carmel-Anderson, IN
- Population (ZIP)
- 47,099
- Household income
- $50,325
- Rent vs Own
- Severe rent burden
- 2742.0
Population outlook (Marion County) Hauer SSP2
- Today (2025)
- 1,025,572 people
- By 2030
- 1,065,727 · +3.9%
- By 2040
- 1,141,577 · +11.3%
- By 2050
- 1,208,920 · +17.9%
- By 2075
- 1,367,288 · +33.3%
- By 2100
- 1,438,201 · +40.2%
Race, ethnicity, and origin ACS 2023
- Neighborhood character
- Diverse neighborhood (Simpson 0.62)
- Race & ethnicity
- Black 53% White 25% Hispanic / Latino 17% Two or more races 9% Asian 2%
- Hispanic origin (detail)
- Mexican 11%
- Common ancestry
- Lithuanian 1% Italian 1% Romanian 1%
- Foreign-born
- 11% · Canada
- Languages at home
- 86% English-only · Spanish 10% French/Haitian/Cajun 1% Other Asian/Pacific 1%
Political lean MEDSL · Marion
- 2024 margin
- Strong D (+27.7) · D 63.0% · R 35.3% · Other 1.7%
- 2008→2024 swing
- -0.7pp no change · 2008: 28.4pp · 2024: 27.7pp
- All cycles
- 2024: D+27.7 2020: D+29.1 2016: D+22.8 2012: D+22.2 2008: D+28.4
Not yet ingested
- Civics
- —
Market trends
- HPI YoY
- ▼ -218.85%
- Current HPI
- 239.43
- Rent YoY
- ▲ 6.76%
- Metro
- Indianapolis-Carmel-Anderson, IN
- State GDP YoY
- ▲ 2.90%
- F500 in state
- 18
Industry mix (Fortune 500 HQ in IN)
| Industry | F500 HQs | Revenue |
|---|---|---|
| Industrial Machinery | 2 | $37B |
|
||
| Healthcare | 1 | $177B |
|
||
| Pharmaceuticals | 1 | $45B |
|
||
| Metals / Steel | 1 | $18B |
|
||
| Agriculture | 1 | $17B |
|
||
| Packaging | 1 | $12B |
|
||
Price history
+168.2% since first listed22 events — show timeline
- 2026-04-20 Price Changed $177,000 MIBOR as Distributed by MLS Grid
- 2026-03-11 Price Changed $179,900 MIBOR as Distributed by MLS Grid
- 2026-03-05 Listed $185,000 MIBOR as Distributed by MLS Grid
- 2022-05-20 Sold (MLS) $148,900 MIBOR as Distributed by MLS Grid
- 2022-05-09 Pending — MIBOR as Distributed by MLS Grid
- 2022-05-05 Listed $154,900 MIBOR as Distributed by MLS Grid
- 2009-01-03 Listing Removed — MIBOR as Distributed by MLS Grid
- 2008-12-17 Sold (MLS) $21,000 MIBOR as Distributed by MLS Grid
- 2008-04-21 Listed $23,900 MIBOR as Distributed by MLS Grid
- 2008-03-02 Listing Removed — MIBOR as Distributed by MLS Grid
- 2007-08-15 Listed $42,900 MIBOR as Distributed by MLS Grid
- 2007-03-16 Listing Removed — MIBOR as Distributed by MLS Grid
- 2006-12-13 Listed $75,000 MIBOR as Distributed by MLS Grid
- 2006-02-28 Sold (MLS) $47,600 MIBOR as Distributed by MLS Grid
- 2005-08-31 Listed $59,900 MIBOR as Distributed by MLS Grid
- 2003-09-10 Sold (MLS) $39,900 MIBOR as Distributed by MLS Grid
- 2003-07-23 Listed $39,900 MIBOR as Distributed by MLS Grid
- 2001-07-31 Sold (Public Records) $78,882 Public Records
- 2001-07-23 Sold (MLS) $65,900 MIBOR as Distributed by MLS Grid
- 2001-06-14 Listed $66,900 MIBOR as Distributed by MLS Grid
- 2001-01-25 Listing Removed — MIBOR as Distributed by MLS Grid
- 2000-07-26 Listed $66,000 MIBOR as Distributed by MLS Grid
Property tax history
+9.6%/yrLatest (2025): $3,669 · +24.9% YoY. Source: county tax records.
Cash-flow waterfall
monthlySold comps — $/sqft
last 12 mo · ≤1 miLoading sold comps…