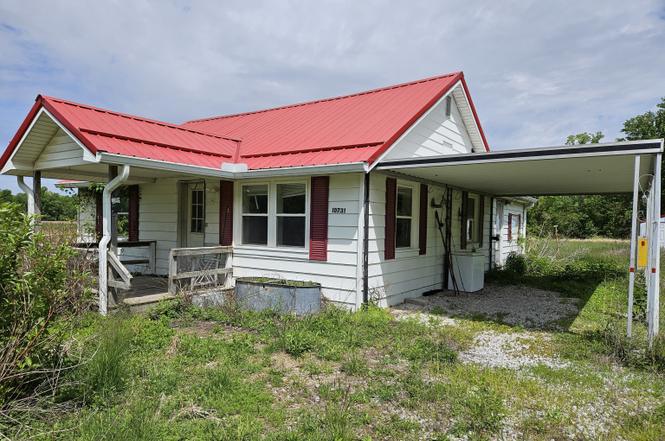
10731 Newport Rd · Patricksburg, IN
Flood risk 1/10 · Minimal
- FEMA flood zone
- X (unshaded)
- Chance of flooding over 30 yrs
- 0.0%
- Est. flood insurance / yr
- $507 – $1,088
Fire risk 1/10 · Minimal
- Est. fire insurance / yr
- $717 – $1,331
Heat risk 3/10 · Minor
- Hot days now (above 103°F)
- 7 days/yr
- Hot days in 30 yrs
- 18 days/yr
Wind risk 2/10 · Minimal
- Chance of severe wind over 30 yrs
- 1.0%
Air-quality risk 2/10 · Minimal
- Unhealthy air days now
- 1 days/yr
- Unhealthy air days in 30 yrs
- 1 days/yr
Risk factors via First Street. Map © Google.
Why this score? — see what drove the D+ grade
The composite is a weighted blend of 9 inputs, each scored 0–100. Each bar is that input's sub-score; the figure is the points it added to the 100-point composite (weight × sub-score).
- Cash flow +14.3/30.0
- Appreciation +9.5/10.0
- ARV discount +7.5/15.0
- DSCR +4.3/10.0
- Schools +3.3/10.0
- 1% rule +2.8/10.0
- Rent growth +2.5/5.0
- Livability +2.5/5.0
- Condition / age +2.5/5.0
$128,000
🖨 Deal sheet (PDF) 📄 Offer letter ✓ Due diligence
Listing remarks
Your opportunity to own a piece of the Owen County mystique with this 2BR/1BA Bungalow sitting on nearly 5 acres! There is a lot to love here - the quiet nights observing the Milky Way without the haze of city lights, breath deeply as you look over the beautiful topography, or you can just have the satisfaction that you and your neighbors aren't looking in each others windows from your dining room table. Whatever, your motivation for getting away from the hustle and bustle, you need to take a look at this property. Then again, Owen County is full of outdoor adventures with camping, lakes, fishing, hunting. Do not miss out. Take a moment and listen to the sound of the wind calling.
Key facts
- Hunting
- Beautiful topography
- Outdoor adventures
Tags
Property features AI
Finance
- Other: Lot approximately 4.1 acres (3–5 acres range)
Exterior
- Parking: No designated parking
- Utilities: Private water source; Septic sewage system; No scheduled solid waste service information
- Home design: Single-family residence; One level; Property listed as fixer condition
- Construction: Vinyl siding; Block foundation
- Exterior features: Covered patio/porch; Corner lot; Rural location (not in a subdivision); Property has a view
Interior
- Kitchen: No appliances included
- Bedrooms: 2 bedrooms on the main level
- Flooring: Hardwood floors
- Bathrooms: 1 full bathroom (main level)
- Heating & cooling: Forced air heating (natural gas); Central air conditioning
- Interior features: Hardwood floors; Living room (17 x 10, main level); Kitchen (17 x 10, main level); Additional main-level room (13 x 11); Bedroom 2 (11 x 9, main level); Laundry room (14 x 6, main level)
- Laundry & utility: Main-level laundry room
Neighborhood map
What this means for you Summary
Snapshot
- This is a 2-bed/1.0-bath single-family listed at $128k.
Deal economics
- At list price, monthly cash flow is $23 ($273/yr) — positive.
- The deal already cash-flows at list — no discount required.
- To meet the 1% rule (rent ≥ 1% of price), the offer needs to be $100k (21.8% below list).
- Recommended offer: $100k (21.8% below list) — sets the bar for 1% rule.
Location & tenants
- Location reads: area grade D — affects rentability + tenant quality, not the cash-flow math above.
- Spencer-Owen Community Schools (rural): math 38% / reading 40% proficiency, ranked #155 of 301 in IN (top 52%) — families likely to look elsewhere, expect single-tenant / working-renter base with shorter leases.
- Zoned schools: Patricksburg Elementary School (math 42% / reading 37%, grade F, #500 of 994 statewide, top 53%, 129 students, 77% FRL); Owen Valley Middle School (math 22% / reading 36%, grade F, #222 of 330 statewide, top 67%, 344 students, 55% FRL); Owen Valley Community High School (math 42% / reading 62%, grade D+, #106 of 369 statewide, top 31%, 671 students, 51% FRL) — zoned schools average 61% FRL vs 44% district-wide (17 pts higher); higher-poverty schools than district average — tighter screening recommended.
- Market conditions: 7 active listings in the ZIP; 120 units permitted in Owen County in 2024 (0 in 5+ unit buildings).
Forward outlook
- In year one you build about $12k of equity ($885 loan paydown + $12k appreciation (9.0% local appreciation)).
- Owen County population projected at -30% by 2050 — secular population decline; favor cash flow + early exit over multi-decade hold.
- At projected returns (9.0% appreciation + 3.0% rent growth), your $36k cash investment doubles in ~3 years — after that, you're playing with house money.
- By year 3, paydown + projected appreciation supports a ~$31k cash-out refi (75% LTV) — recoverable capital for the next deal without selling this one.
Negotiation context
- Only 4 days on market — expect competitive offers; lowballing is unlikely to land.
- 3 sale attempts since 7y ago with the ask held roughly flat each time — persistent listings suggest the price (not the market) is what's stuck; bring a comps-based counter.
- Current owner paid $91k; 41% above their basis — modest negotiation headroom, anchor on the comps not their cost.
Risks & watch-outs
- Watch-outs: built in 1953 — expect roof / HVAC / electrical / plumbing capex.
Questions for the listing agent
- Built in 1953 — when were the roof, HVAC, electrical panel, plumbing, and water heater last replaced?
- Is there a deadline driving the sale (1031 exchange, divorce, estate, relocation)? That informs how much negotiation room exists.
- The area grade is low — what's the realistic commute time and amenity access for the typical tenant pool here? Any planned neighborhood developments (good or bad) we should know about?
- What's the average days-on-market for RENTAL listings here right now (not sales)? A rising rental-DOM trend means longer vacancies and softer asking-rent achievability than the comps imply.
- What's the recent tenant-quality profile in this submarket — average credit score on applications, eviction rate, late-payment / NSF rate, and stable-employment percentage? A property-management company in the area should have these aggregated.
- How much new for-sale + rental construction is in the pipeline within 1–3 miles? Heavy new supply typically softens prices + rents 12–24 months out; constrained supply supports both.
Investment metrics
- 1% rule
- 0.78% ✗
- Cap rate
- 6.51%
- Cash-on-cash
- 0.76%
- DSCR
- 1.03
- GRM
- 10.7
CMA / ARV
- ARV (on-the-fly)
- $265,785
- Comps found
- 1
Show comp detail 1 sale within ~0.75 mi
| Address | Dist | Beds/Ba | Sqft | Sold | Price | $/sf | Match |
|---|---|---|---|---|---|---|---|
| 3251 Mount Zion Rd | 0.36mi | 2/1.0 | 1,232 (+9%) | 14mo | $289,900 | $235 | 57 |
Match score weights: distance 35% · size 25% · config 20% · recency 20%. Top-matched comps best support the ARV.
Projected returns pro-forma
9.01% appreciation · 3.0% rent growth · sell at horizon
- IRR
- 22.7%
- Equity multiple
- 2.75×
- Total profit
- $62,572
- Equity at exit
- $106,237
- IRR
- 20.5%
- Equity multiple
- 6.06×
- Total profit
- $181,262
- Equity at exit
- $220,086
Cash invested: $35,840 (down + closing). Projections, not guarantees.
Landlord ↔ Tenant lean methodology
- Overall (STATE)
- 90 Strongly Landlord-Friendly
- State Indiana
- 90 Strongly Landlord-Friendly · R+11
- County
- — inherits STATE
- City
- — inherits STATE
ZIP-level market 47833
- Home prices YoY
- 3.9%
- Active inventory
- 7
- Price-to-rent
- 10.7×
Monthly cashflow live
- Estimated rent
- $1,001 medium interval (Pro) →
- Mortgage (P&I)
- −$671
- Tax from tax record
- −$44 /mo · $526/yr
- Insurance
- −$53
- HOA
- −$0
- Vacancy / Maint / Mgmt
- −$210
- Net cashflow
- $23
Break-even live
Sensitivity live
| Price | -10% $95 | -5% $59 | +0% $23 | +5% $-14 | +10% $-50 |
|---|---|---|---|---|---|
| Rent | -10% $-56 | -5% $-17 | +0% $23 | +5% $62 | +10% $102 |
| Rate | -1.0pp $87 | -0.5pp $55 | base $23 | +0.5pp $-10 | +1.0pp $-44 |
UW: 25.0% down · 7.5% · 30yr · 1.5% tax · 5.0% vac · 8.0% maint · 8.0% mgmt
Financing live
Cash to close
- Down payment
- $32,000
- Closing costs
- $3,840
- Reserves months
- —
- Total cash needed
- —
Loan-product check · same deal, 3 products live
Conventional
25% down · 7.5% · 30yr
- Down + closing
- —
- Monthly P&I
- —
- Monthly cashflow
- —
- DSCR
- —
- Eligible?
- —
Personal DTI + credit; lowest rate.
DSCR
20% down · 8.5% · 30yr
- Down + closing
- —
- Monthly P&I
- —
- Monthly cashflow
- —
- DSCR
- —
- Eligible?
- —
No personal income docs; deal must DSCR.
Hard money
10% down · 12.0% · 12mo
- Down + closing
- —
- Monthly P&I
- —
- Monthly cashflow
- —
- DSCR
- —
- Eligible?
- —
Short-term bridge; refi at stabilization.
Listing history 4 events
-
2026-06-21days on market $128,000 Active 4 DOM
-
2026-06-19days on market $128,000 Active 2 DOM
-
2026-06-18remarks 689-char remark
-
2026-06-18$128,000 Active 1 DOM
ⓘ Source: listings_history table (triggers on properties + properties_extension) + one-shot
backfill from property_details.listing_events for pre-trigger history.
Tax reassessment forecast IN · Partial reset (capped growth)
- Current annual tax
- $526 · $44/mo
- Projected year-2 tax
- $807 · $67/mo
- Expected delta
- +$281/yr (+$23/mo · 53.3%)
ⓘ Screening estimate from a state-policy table — verify with the county assessor before closing.
Climate risk First Street
- Flood 1/10 Low FEMA zone X (unshaded) · 0% chance over 30 yrs
- Wildfire 1/10 Low
- Heat 3/10 Moderate 7 d/yr ≥103°F today · 18 d/yr by 30 yrs out
- Wind 2/10 Low 100% chance of damaging wind over 30 yrs
- Air quality 2/10 Low 1 unhealthy d/yr today · 1 by 30 yrs out
Nearby sold comps map
Loading sold comps map…
Walkable amenities ~0.75 mi
Loading nearby amenities…
Taxation est. · year 1
- Rental income
- $12,018
- − Mortgage interest
- −$7,170
- − Property taxes
- −$526
- − Insurance
- −$640
- − Repairs & maintenance
- −$961
- − Management
- −$961
- − Depreciation
- −$3,724
- Taxable loss
- −$1,965
- Est. tax savings @ 24.0%
- +$472
- After-tax cash flow
- $744/yr
For passive investors: Depreciation is non-cash, so a rental often shows a tax loss while cash-flowing — sheltering income. Rental losses are passive: they offset passive income freely, and up to $25,000/yr can offset ordinary (W-2) income if you actively participate and your MAGI is under $100k (phasing out to $0 by $150k); unused losses carry forward. On sale, claimed depreciation is recaptured at up to 25%, and gains may owe capital-gains tax (a 1031 exchange can defer both). Figures are a year-1 estimate at your 24.0% rate — not tax advice; consult a CPA.
Schools (NCES district)
- District
- Spencer-Owen Community Schools
- NCES district ID
- 1810950
- Math proficiency
- 38% ▼ -6.00%
- Reading proficiency
- 40% ▼ -6.00%
- Median HH income
- $45,258
- Composite
- 33.21/100
- National rank
- #5529
- State rank
- #155 of 301 in IN
Livability — Patricksburg
No livability data for this city. (Only ~50 U.S. cities are tracked.)
Census & demographics
- City population
- 34
- Population (ZIP)
- 917
Population outlook (Owen County) Hauer SSP2
- Today (2025)
- 19,045 people
- By 2030
- 17,930 · -5.9%
- By 2040
- 15,507 · -18.6%
- By 2050
- 13,253 · -30.4%
- By 2075
- 9,364 · -50.8%
- By 2100
- 6,686 · -64.9%
Race, ethnicity, and origin ACS 2023
- Neighborhood character
- Predominantly White (96%)
- Race & ethnicity
- White 96% Two or more races 4%
- Common ancestry
- English 1% Lithuanian 1%
- Foreign-born
- 2%
- Languages at home
- 98% English-only · Other Indo-European 2%
Political lean MEDSL · Owen
- 2024 margin
- Solid R (+50.7) · D 23.8% · R 74.5% · Other 1.6%
- 2008→2024 swing
- -40.3pp toward R · 2008: -10.3pp · 2024: -50.7pp
- All cycles
- 2024: R+50.7 2020: R+49.1 2016: R+49.4 2012: R+27.6 2008: R+10.3
Not yet ingested
- Civics
- —
Market trends
- HPI YoY
- ▲ 9.01%
- Current HPI
- 243.1198
- Rent YoY
- —
- Metro
- —
- State GDP YoY
- ▲ 2.90%
- F500 in state
- 18
Industry mix (Fortune 500 HQ in IN)
| Industry | F500 HQs | Revenue |
|---|---|---|
| Industrial Machinery | 2 | $37B |
|
||
| Healthcare | 1 | $177B |
|
||
| Pharmaceuticals | 1 | $45B |
|
||
| Metals / Steel | 1 | $18B |
|
||
| Agriculture | 1 | $17B |
|
||
| Packaging | 1 | $12B |
|
||
Price history
+97.5% since first listed6 events — show timeline
- 2026-06-17 Listed $128,000 MIBOR as Distributed by MLS Grid
- 2019-05-10 Sold (MLS) $91,000 MIBOR as Distributed by MLS Grid
- 2019-05-10 Sold (MLS) $91,000 IRMLS
- 2019-02-07 Listed $94,900 MIBOR as Distributed by MLS Grid
- 2019-02-07 Listed $94,900 IRMLS
- 2012-04-05 Sold (Public Records) $64,800 Public Records
Property tax history
+8.9%/yrLatest (2024): $526 · +0.8% YoY. Source: county tax records.
Cash-flow waterfall
monthlySold comps — $/sqft
last 12 mo · ≤1 miLoading sold comps…