21785 A St · Rehoboth Beach, DE
Flood risk 7/10 · Major
- FEMA flood zone
- AE
- Chance of flooding over 30 yrs
- 0.96%
- Est. flood insurance / yr
- $2,026 – $9,024
Fire risk 1/10 · Minimal
- Est. fire insurance / yr
- $476 – $884
Heat risk 8/10 · Major
- Hot days now (above 100°F)
- 7 days/yr
- Hot days in 30 yrs
- 18 days/yr
Wind risk 8/10 · Major
- Chance of severe wind over 30 yrs
- 80.0%
Air-quality risk 2/10 · Minimal
- Unhealthy air days now
- 1 days/yr
- Unhealthy air days in 30 yrs
- 1 days/yr
Risk factors via First Street. Map © Google.
Why this score? — see what drove the B grade
The composite is a weighted blend of 9 inputs, each scored 0–100. Each bar is that input's sub-score; the figure is the points it added to the 100-point composite (weight × sub-score).
- Cash flow +30.0/30.0
- 1% rule +10.0/10.0
- DSCR +10.0/10.0
- ARV discount +7.5/15.0
- Schools +4.2/10.0
- Livability +3.6/5.0
- Rent growth +2.5/5.0
- Condition / age +2.5/5.0
- Appreciation +0.0/10.0
$109,000
🖨 Deal sheet 📄 Offer letter ✓ Due diligence
Listing remarks
* * MOTIVATED SELLER — VACATION HOME ALERT! * * This beautifully updated beach cottage has been lovingly maintained and completely renovated in 2023, offering the perfect year-round retreat or summer getaway near Rehoboth Beach. Features include a sophisticated European-style kitchen with stainless appliances, luxury plank flooring, spacious primary suite closet, and high-end finishes throughout. Recent upgrades include a new roof with transferable warranty, Culligan water filtration system, updated plumbing and electric, plus newer windows and hot water heater for worry-free ownership. Enjoy outstanding community amenities including a private beach and marina, community pool, bask
Key facts
- 151.03 acre lot
- 2 parking spots
- Community pool
Property features AI
Finance
- Other: Property manager present; Located bayfront in a rented-lot community (Rehoboth Bay MHP); Directions provided to community
- Financial info: Land lease $705 monthly (approximately 5 years remaining); Lease not considered
- HOA & community: HOA fee $10 annually; Community pool (fenced, concrete, in-ground)
Exterior
- Parking: Gravel driveway; Driveway parking (2 spaces); On-street parking; Total of 2 garage/parking spaces
- Utilities: Private/community water; Public sewer; No municipal trash service
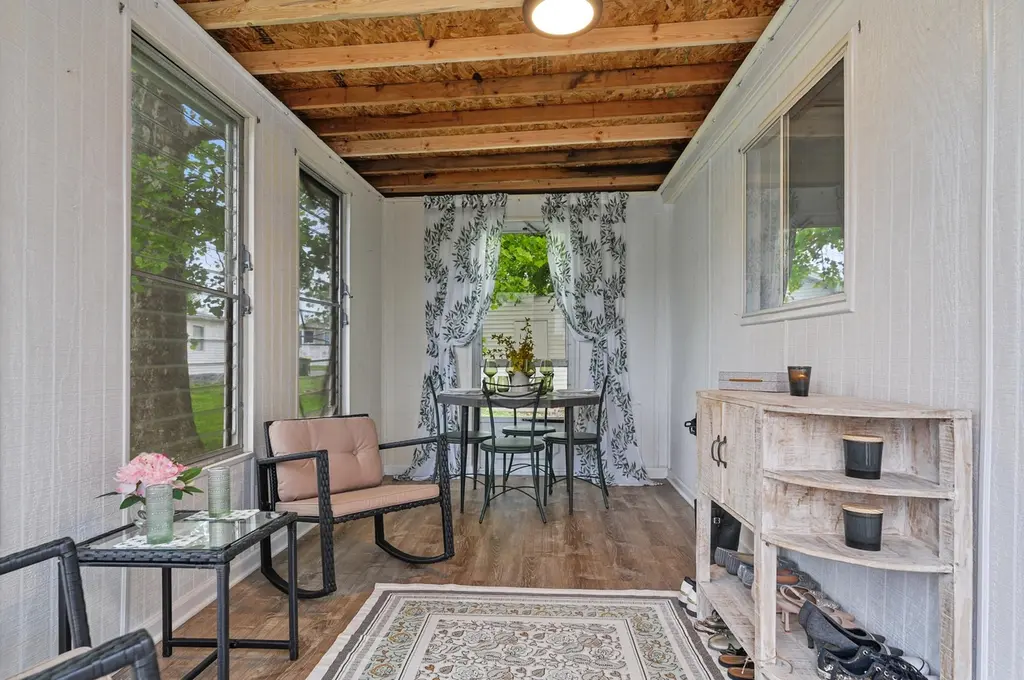
- Home design: Mobile home (single wide, approx. 12' x 60'); Mobile pre-1976; Land lease ownership interest; Excellent condition; Effective year built / major remodel: 2023; Entry level features include screened porch
- Construction: Modular/manufactured construction; Pillar/post/pier foundation; Building not winterized
- Exterior features: Private beach; Porch(es); Shed; Water view (Rehoboth Bay); Water access; Navigable water; Lot noted as level and premium; Flood plain
Interior
- Kitchen: Built-in microwave; Cooktop; Dishwasher; Single oven; Refrigerator; Stainless steel appliances; Disposal; Upgraded countertops
- Bedrooms: 2 bedrooms on the main level
- Flooring: Luxury vinyl plank
- Bathrooms: 1 full bathroom on the main level; 1 half bathroom on the main level
- Heating & cooling: 90% forced air heating; Propane (leased) heating fuel; Central air conditioning; Electric cooling; Electric hot water
- Interior features: Tub/shower; Ceiling fans; Combination kitchen and living area; Efficiency layout; Upgraded countertops; Water treatment system; Window treatments; Other
- Laundry & utility: Washer in unit; Main-floor laundry; Water heater
Neighborhood map
What this means for you Summary
Snapshot
- This is a 2-bed/1.5-bath manufactured listed at $109k.
Deal economics
- At list price, monthly cash flow is $370 ($4k/yr) — positive.
- The deal already cash-flows at list — no discount required.
- Meets the 1% rule at list price ($2k rent vs $109k).
- Recommended offer: $106k (3.0% below list) — sets the bar for market timing.
- Cap rate 15.4% vs local median 1.1% in Rehoboth Beach — top-decile yield for the area; either an underpriced asset or a hidden risk that comps aren't pricing in. Stress-test before assuming the spread holds.
Location & tenants
- Location reads 71/100 on livability (#20 in DE) — a middle-class / working-renter tenant base. Strengths: schools A+, amenities A+, employment A+; Watch: crime F, commute F, cost of living F.
- Cape Henlopen School District (town): math 42% / reading 55% proficiency, ranked #5 of 26 in DE (top 19%) — families likely to look elsewhere, expect single-tenant / working-renter base with shorter leases.
- Market conditions: 331 active listings in the ZIP; solid renter incomes; 4,354 units permitted in Sussex County in 2024 (344 in 5+ unit buildings).
Forward outlook
- Local home prices are declining (-3.0%/yr); year-one equity from $754 of loan paydown is wiped out by about $3k of value loss. Plan a longer hold.
- Sussex County population projected at +25% by 2050 — long-run rental-demand tailwind backs the buy-and-hold thesis.
- At projected returns (-3.0% appreciation + 3.0% rent growth), your $31k cash investment doubles in ~8 years — after that, you're playing with house money.
Negotiation context
- It's been on market 34 days — a 3% lower offer ($106k) is reasonable based on typical stale-listing flexibility.
Risks & watch-outs
- Watch-outs: flood insurance adds $460/mo.
- Climate carrying-cost: in FEMA flood zone AE (mandatory federal flood insurance); severe wind risk, 80% chance of damaging wind over 30y; extreme-heat days projected 7→18/yr by 2055 (HVAC capex compounding) — expect insurance premiums to compound above CPI over the hold.
Questions for the listing agent
- It's been on market 34 days. Have you received any prior offers? Is the seller open to a 3% concession, seller financing, or rate buy-down credit?
- Built in 1969 — when were the roof, HVAC, electrical panel, plumbing, and water heater last replaced?
- What's the actual annual flood-insurance premium (NFIP or private), and is the property in a SFHA with mandatory coverage?
- What does the HOA fee cover, when was the last increase, and are there any pending special assessments or reserve-fund shortfalls?
- Is there a deadline driving the sale (1031 exchange, divorce, estate, relocation)? That informs how much negotiation room exists.
- Schools are A-rated — typically a magnet for longer-tenancy family renters. What's the average tenant stay here, and is there a school-zone premium baked into asking?
- Crime grade is F in this area — have there been break-ins, vandalism, or insurance claims at this property in the last 3 years? What carrier currently insures it and at what premium?
- What's the average days-on-market for RENTAL listings here right now (not sales)? A rising rental-DOM trend means longer vacancies and softer asking-rent achievability than the comps imply.
- What's the recent tenant-quality profile in this submarket — average credit score on applications, eviction rate, late-payment / NSF rate, and stable-employment percentage? A property-management company in the area should have these aggregated.
- How much new for-sale + rental construction is in the pipeline within 1–3 miles? Heavy new supply typically softens prices + rents 12–24 months out; constrained supply supports both.
Investment metrics
- 1% rule
- 1.84% ✓
- Cap rate
- 15.43%
- Cash-on-cash
- 32.65%
- DSCR
- 2.45
- GRM
- 4.5
CMA / ARV
No comps found within radius.
Projected returns pro-forma
-3.0% appreciation · 3.0% rent growth · sell at horizon
- IRR
- 5.2%
- Equity multiple
- 1.20×
- Total profit
- $6,210
- Equity at exit
- $16,252
- IRR
- 14.9%
- Equity multiple
- 2.21×
- Total profit
- $37,018
- Equity at exit
- $9,424
Cash invested: $30,520 (down + closing). Projections, not guarantees.
Landlord ↔ Tenant lean methodology
- Overall (STATE)
- 70 Landlord-Friendly
- State Delaware
- 70 Landlord-Friendly · D+7
- County
- — inherits STATE
- City
- — inherits STATE
ZIP-level market 19971
- Active inventory
- 331
- Price-to-rent
- 4.5×
Monthly cashflow live
- Estimated rent
- $2,006 medium interval (Pro) →
- Mortgage (P&I)
- −$572
- Tax est. 1.5%
- −$136 /mo · $1,635/yr
- Insurance
- −$45
- Flood insurance flood zone
- −$460 /mo · $5,525/yr
- HOA
- −$1
- Vacancy / Maint / Mgmt
- −$421
- Net cashflow
- $370
Break-even live
UW: 25.0% down · 7.5% · 30yr · 1.5% tax · 5.0% vac · 8.0% maint · 8.0% mgmt
Financing live
Cash to close
- Down payment
- $27,250
- Closing costs
- $3,270
- Reserves months
- —
- Total cash needed
- —
Loan-product check · same deal, 3 products live
Conventional
25% down · 7.5% · 30yr
- Down + closing
- —
- Monthly P&I
- —
- Monthly cashflow
- —
- DSCR
- —
- Eligible?
- —
Personal DTI + credit; lowest rate.
DSCR
20% down · 8.5% · 30yr
- Down + closing
- —
- Monthly P&I
- —
- Monthly cashflow
- —
- DSCR
- —
- Eligible?
- —
No personal income docs; deal must DSCR.
Hard money
10% down · 12.0% · 12mo
- Down + closing
- —
- Monthly P&I
- —
- Monthly cashflow
- —
- DSCR
- —
- Eligible?
- —
Short-term bridge; refi at stabilization.
HOA detail
- Monthly dues
- $1 · $12/yr
- Likely covers
- waterelectricpool
Listing history 19 events
-
2026-06-18days on market $109,000 Active 34 DOM
-
2026-06-17price $109,000 Active 33 DOM
-
2026-06-17days on market $129,000 Active 33 DOM
-
2026-06-16days on market $129,000 Active 32 DOM
-
2026-06-15days on market $129,000 Active 31 DOM
-
2026-06-14days on market $129,000 Active 29 DOM
-
2026-06-13days on market $129,000 Active 28 DOM
-
2026-06-10days on market $129,000 Active 26 DOM
-
2026-06-09days on market $129,000 Active 25 DOM
-
2026-06-08days on market $129,000 Active 24 DOM
-
2026-06-07days on market $129,000 Active 23 DOM
-
2026-06-05days on market $129,000 Active 20 DOM
-
2026-06-03days on market $129,000 Active 19 DOM
-
2026-06-02days on market $129,000 Active 18 DOM
-
2026-06-01days on market $129,000 Active 17 DOM
-
2026-05-31days on market $129,000 Active 16 DOM
-
2026-05-30days on market $129,000 Active 15 DOM
-
2026-05-16$129,000 Active 920-char remark
-
2026-05-05historical $129,000 920-char remark
ⓘ Source: listings_history table (triggers on properties + properties_extension) + one-shot
backfill from property_details.listing_events for pre-trigger history.
Climate risk First Street
- Flood 7/10 Severe FEMA zone AE · 96% chance over 30 yrs
- Wildfire 1/10 Low
- Heat 8/10 Severe 7 d/yr ≥100°F today · 18 d/yr by 30 yrs out
- Wind 8/10 Severe 80% chance of damaging wind over 30 yrs
- Air quality 2/10 Low 1 unhealthy d/yr today · 1 by 30 yrs out
Nearby sold comps map
Loading sold comps map…
Walkable amenities ~0.75 mi
Loading nearby amenities…
Taxation est. · year 1
- Rental income
- $24,070
- − Mortgage interest
- −$6,106
- − Property taxes
- −$1,635
- − Insurance
- −$6,070
- − Repairs & maintenance
- −$1,926
- − Management
- −$1,926
- − HOA
- −$12
- − Depreciation
- −$3,171
- Taxable income
- $3,225
- Est. tax owed @ 24.0%
- −$774
- After-tax cash flow
- $3,665/yr
For passive investors: Depreciation is non-cash, so a rental often shows a tax loss while cash-flowing — sheltering income. Rental losses are passive: they offset passive income freely, and up to $25,000/yr can offset ordinary (W-2) income if you actively participate and your MAGI is under $100k (phasing out to $0 by $150k); unused losses carry forward. On sale, claimed depreciation is recaptured at up to 25%, and gains may owe capital-gains tax (a 1031 exchange can defer both). Figures are a year-1 estimate at your 24.0% rate — not tax advice; consult a CPA.
Schools (NCES district)
- District
- Cape Henlopen School District
- NCES district ID
- 1000170
- Math proficiency
- 42% ▼ -14.00%
- Reading proficiency
- 55% ▼ -10.00%
- Median HH income
- $60,196
- Composite
- 42.47/100
- National rank
- #3214
- State rank
- #5 of 26 in DE
Livability — Rehoboth Beach
- Score
- 71/100
- State rank
- #20
- US rank
- #6520
Category grades
Schools grade is shown separately in the Schools card above.
Census & demographics
- County
- Sussex County · 82,708 people
- City population
- 14,886
- Metro
- Salisbury, MD-DE
- Population (ZIP)
- 14,886
- Household income
- $102,146
- Rent vs Own
- Severe rent burden
- 317.0
Population outlook (Sussex County) Hauer SSP2
- Today (2025)
- 248,853 people
- By 2030
- 264,464 · +6.3%
- By 2040
- 290,980 · +16.9%
- By 2050
- 311,259 · +25.1%
- By 2075
- 352,488 · +41.6%
- By 2100
- 367,406 · +47.6%
Race, ethnicity, and origin ACS 2023
- Neighborhood character
- Predominantly White (88%)
- Race & ethnicity
- White 88% Black 4% Two or more races 4% Hispanic / Latino 3% Asian 2%
- Common ancestry
- Romanian 5% Slovak 3% Italian 3%
- Foreign-born
- 6% · Canada, China
- Languages at home
- 95% English-only · Spanish 2% Russian/Polish/Slavic 1% French/Haitian/Cajun 1%
Political lean MEDSL · Sussex
- 2024 margin
- R (+11.0) · D 43.9% · R 54.9% · Other 1.2%
- 2008→2024 swing
- -2.4pp toward R · 2008: -8.6pp · 2024: -11.0pp
- All cycles
- 2024: R+11.0 2020: R+11.2 2016: R+22.0 2012: R+13.0 2008: R+8.6
Not yet ingested
- Civics
- —
Market trends
- HPI YoY
- ▼ -220.39%
- Current HPI
- 353.3977
- Rent YoY
- —
- Metro
- Salisbury, MD-DE
- State GDP YoY
- —
- F500 in state
- 0
Price history
-15.5% since first listed3 events — show timeline
- 2026-06-18 Price Changed $109,000 BRIGHT MLS
- 2026-05-16 Listed $129,000 BRIGHT MLS
- 2026-05-05 Coming Soon $129,000 BRIGHT MLS
Property tax history
-3.3%/yrLatest (2025): $98 · -35.0% YoY. Source: county tax records.
Cash-flow waterfall
monthlySold comps — $/sqft
last 12 mo · ≤1 miLoading sold comps…