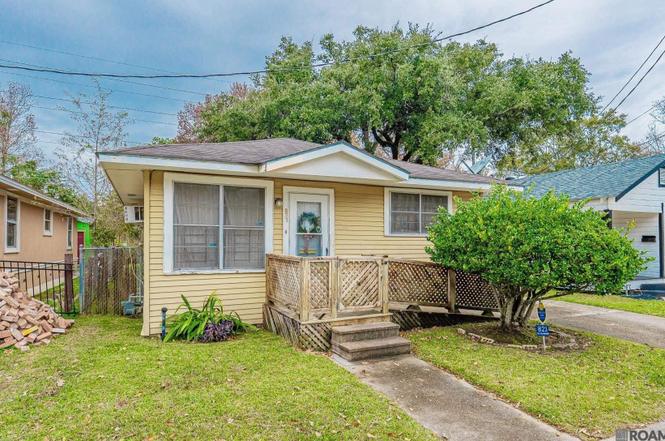
823 N 46th St · Baton Rouge, LA
Flood risk 4/10 · Minor
- FEMA flood zone
- X (unshaded)
- Chance of flooding over 30 yrs
- 0.22%
- Est. flood insurance / yr
- $507 – $1,088
Fire risk 1/10 · Minimal
- Est. fire insurance / yr
- $1,269 – $2,357
Heat risk 8/10 · Major
- Hot days now (above 108°F)
- 7 days/yr
- Hot days in 30 yrs
- 20 days/yr
Wind risk 9/10 · Severe
- Chance of severe wind over 30 yrs
- 99.0%
Air-quality risk 3/10 · Minor
- Unhealthy air days now
- 3 days/yr
- Unhealthy air days in 30 yrs
- 4 days/yr
Risk factors via First Street. Map © Google.
Why this score? — see what drove the B grade
The composite is a weighted blend of 9 inputs, each scored 0–100. Each bar is that input's sub-score; the figure is the points it added to the 100-point composite (weight × sub-score).
- Cash flow +30.0/30.0
- 1% rule +10.0/10.0
- DSCR +10.0/10.0
- ARV discount +7.5/15.0
- Rent growth +4.1/5.0
- Livability +3.7/5.0
- Condition / age +2.5/5.0
- Schools +2.4/10.0
- Appreciation +0.0/10.0
$80,000
🖨 Deal sheet 📄 Offer letter ✓ Due diligence
Listing remarks MLS
Turn this property into your next investment opportunity. This home is large enough for 2 families. The home has 2 kitchens and plenty of space
Key facts
- 2 kitchens
- 3,920 sq ft lot
- 3 parking spots
Tags
Property features AI
Finance
- Other: Located in the Greenville Extension subdivision; Directions: From the S Acadian Thruway, turn right on North Street, then left on N 46th Street, house on the left
Exterior
- Parking: 3 parking spaces
- Utilities: Public water; Public sewer
- Home design: Detached single-family residence; Residential property
- Construction: Frame construction; Asbestos siding or material present; Pillar/post/pier foundation; Built area approximately 1,734
- Exterior features: Chain link fencing; Lot dimensions approximately 40 x 98; Lot area about 0.09 acres
Interior
- Flooring: Laminate
- Bathrooms: 3 full bathrooms
- Heating & cooling: Has cooling; No heating
- Interior features: Laminate flooring
Neighborhood map
What this means for you Summary
Snapshot
- This is a 4-bed/3.0-bath single-family listed at $80k.
Deal economics
- At list price, monthly cash flow is $795 ($10k/yr) — positive.
- The deal already cash-flows at list — no discount required.
- Meets the 1% rule at list price ($2k rent vs $80k).
- Cap rate 18.2% vs local median 4.3% in Baton Rouge — top-decile yield for the area; either an underpriced asset or a hidden risk that comps aren't pricing in. Stress-test before assuming the spread holds.
Location & tenants
- Location reads 74/100 on livability (#24 in LA, #4,535 nationally) — a middle-class / working-renter tenant base. Strengths: commute A+, cost of living A+, health & safety A+; Watch: amenities D, crime F, employment D-.
- East Baton Rouge Parish (urban): math 22% / reading 34% proficiency, ranked #47 of 98 in LA (top 48%) — low school quality limits family demand, transient renter base, plan for 1-2y turnover; 77% free/reduced lunch — lower-income household profile, screen leases tightly.
- Market conditions: Rents rising fast (+6.6%/yr); 188 active listings in the ZIP; 26 comparable units currently listed for rent nearby; rentals at typical pace (median 24d on market — plan ~3-4 weeks tenant-placement turnaround); lower-income renter base — watch delinquency; 2,252 units permitted in East Baton Rouge Parish in 2024 (440 in 5+ unit buildings).
- At $1,609/mo this rent would consume 56% of the median local household income ($34k/yr) (locally 1831% of renters already pay >50% of income on rent) — very limited rent-growth headroom before tenants either downsize or default.
Forward outlook
- Local home prices are declining (-3.0%/yr); year-one equity from $553 of loan paydown is wiped out by about $2k of value loss. Plan a longer hold.
- East Baton Rouge County population projected at +4% by 2050 — modest demand growth; plan on rents tracking national, not racing it.
- At projected returns (-3.0% appreciation + 6.6% rent growth), your $22k cash investment doubles in ~3 years — after that, you're playing with house money.
Negotiation context
- Only 7 days on market — expect competitive offers; lowballing is unlikely to land.
- 5 sale attempts since 2y ago; this cycle's ask has dropped $20k (20%) from the opening price — seller is motivated, your offer sets the floor, not the list.
Risks & watch-outs
- Climate carrying-cost: severe wind risk, 99% chance of damaging wind over 30y; extreme-heat days projected 7→20/yr by 2055 (HVAC capex compounding) — expect insurance premiums to compound above CPI over the hold.
Questions for the listing agent
- Built in 1961 — when were the roof, HVAC, electrical panel, plumbing, and water heater last replaced?
- Is there a deadline driving the sale (1031 exchange, divorce, estate, relocation)? That informs how much negotiation room exists.
- Crime grade is F in this area — have there been break-ins, vandalism, or insurance claims at this property in the last 3 years? What carrier currently insures it and at what premium?
- What's the average days-on-market for RENTAL listings here right now (not sales)? A rising rental-DOM trend means longer vacancies and softer asking-rent achievability than the comps imply.
- What's the recent tenant-quality profile in this submarket — average credit score on applications, eviction rate, late-payment / NSF rate, and stable-employment percentage? A property-management company in the area should have these aggregated.
- How much new for-sale + rental construction is in the pipeline within 1–3 miles? Heavy new supply typically softens prices + rents 12–24 months out; constrained supply supports both.
Investment metrics
- 1% rule
- 2.01% ✓
- Cap rate
- 18.22%
- Cash-on-cash
- 42.59%
- DSCR
- 2.89
- GRM
- 4.1
CMA / ARV
- ARV (on-the-fly)
- $234,090
- Comps found
- 12
Show comp detail 12 sales within ~0.75 mi
| Address | Dist | Beds/Ba | Sqft | Sold | Price | $/sf | Match |
|---|---|---|---|---|---|---|---|
| 823 46th St | 0.00mi | 4/3.0 | 1,734 (0%) | 15mo | $100,000 | $58 | 87 |
| 672 N 46th St | 0.09mi | 4/2.0 | 1,755 (+1%) | 21mo | $80,000 | $46 | 72 |
| 5256 N Afton Pkwy | 0.45mi | 3/2.0 (-1) | 1,816 (+5%) | 11mo | $199,900 | $110 | 53 |
| 5527 N Afton Pkwy | 0.64mi | 3/2.0 (-1) | 1,797 (+4%) | 7mo | $245,000 | $136 | 49 |
| 1095 Waverly Dr | 0.57mi | 3/2.0 (-1) | 1,596 (-8%) | 3mo | $125,000 | $78 | 49 |
| 4366 Washington Ave | 0.66mi | 3/2.0 (-1) | 1,604 (-8%) | 8mo | $155,000 | $97 | 42 |
| 119 West Dr | 0.74mi | 3/2.0 (-1) | 1,630 (-6%) | 7mo | $347,500 | $213 | 41 |
| 5469 Hermitage Dr | 0.70mi | 3/2.0 (-1) | 1,736 (+0%) | 21mo | $235,000 | $135 | 40 |
| 346 Richland Dr | 0.75mi | 4/2.0 | 1,638 (-6%) | 17mo | $259,000 | $158 | 38 |
| 725 Parlange Dr | 0.33mi | 3/2.0 (-1) | 1,969 (+14%) | 22mo | $199,000 | $101 | 34 |
| 170 Edison St | 0.62mi | 3/2.0 (-1) | 1,552 (-10%) | 15mo | $269,000 | $173 | 32 |
| 361 Glenmore Ave | 0.70mi | 3/2.0 (-1) | 1,519 (-12%) | 12mo | $299,900 | $197 | 27 |
Match score weights: distance 35% · size 25% · config 20% · recency 20%. Top-matched comps best support the ARV.
Projected returns pro-forma
-3.0% appreciation · 6.59% rent growth · sell at horizon
- IRR
- 43.1%
- Equity multiple
- 2.95×
- Total profit
- $43,668
- Equity at exit
- $11,928
- IRR
- 50.7%
- Equity multiple
- 6.79×
- Total profit
- $129,738
- Equity at exit
- $6,917
Cash invested: $22,400 (down + closing). Projections, not guarantees.
Landlord ↔ Tenant lean methodology
- Overall (STATE)
- 90 Strongly Landlord-Friendly
- State Louisiana
- 90 Strongly Landlord-Friendly · R+12
- County
- — inherits STATE
- City
- — inherits STATE
ZIP-level market 70802
- Rents YoY
- 6.6%
- Active inventory
- 188
- Price-to-rent
- 4.1×
Monthly cashflow live
- Estimated rent
- $1,609 high interval (Pro) →
- Mortgage (P&I)
- −$420
- Tax from tax record
- −$24 /mo · $282/yr
- Insurance
- −$33
- HOA
- −$0
- Vacancy / Maint / Mgmt
- −$338
- Net cashflow
- $795
Break-even live
UW: 25.0% down · 7.5% · 30yr · 1.5% tax · 5.0% vac · 8.0% maint · 8.0% mgmt
Financing live
Cash to close
- Down payment
- $20,000
- Closing costs
- $2,400
- Reserves months
- —
- Total cash needed
- —
Loan-product check · same deal, 3 products live
Conventional
25% down · 7.5% · 30yr
- Down + closing
- —
- Monthly P&I
- —
- Monthly cashflow
- —
- DSCR
- —
- Eligible?
- —
Personal DTI + credit; lowest rate.
DSCR
20% down · 8.5% · 30yr
- Down + closing
- —
- Monthly P&I
- —
- Monthly cashflow
- —
- DSCR
- —
- Eligible?
- —
No personal income docs; deal must DSCR.
Hard money
10% down · 12.0% · 12mo
- Down + closing
- —
- Monthly P&I
- —
- Monthly cashflow
- —
- DSCR
- —
- Eligible?
- —
Short-term bridge; refi at stabilization.
Rent comps 26 comps
| Address | Beds | Baths | Sqft | Rent | $/sqft | DOM | Units | Dist |
|---|---|---|---|---|---|---|---|---|
| 1201 N Foster Dr Baton Rouge, LA | 1.0–3.0 | 1.0–3.0 | 1300 | $1,688 | $1.30 | 14d | 31 | 0.32mi |
| 3566 North St Baton Rouge, LA | 4.0 | 2.0 | 1117 | $1,050 | $0.94 | 21d | 1 | 0.60mi |
| 1348 N 37th St Baton Rouge, LA | 3.0 | 1.0 | 1100 | $1,200 | $1.09 | 43d | 1 | 0.62mi |
| 422 Glenmore Ave Baton Rouge, LA | 3.0 | 2.0 | 1307 | $1,700 | $1.30 | 23d | 1 | 0.75mi |
| 3906 S Barrow Dr Baton Rouge, LA | 3.0 | 2.0 | 1523 | $1,295 | $0.85 | 23d | 1 | 0.79mi |
| 373 Community College Dr Unit 302 Baton Rouge, LA | 4.0 | 2.0 | 1300 | $1,100 | $0.85 | 43d | 1 | 0.83mi |
| 373 Community College Dr Unit 206 Baton Rouge, LA | 4.0 | 2.0 | 1300 | $1,200 | $0.92 | 43d | 1 | 0.83mi |
| 1251 N Ardenwood Dr Baton Rouge, LA | 1.0–3.0 | 1.0–2.0 | 923 | $999 | $1.08 | 43d | 1 | 0.85mi |
| 5212 Jackson Ave Baton Rouge, LA | 4.0 | 2.0 | 1500 | $1,650 | $1.10 | 23d | 1 | 0.86mi |
| 343 S Fairfax Dr Baton Rouge, LA | 4.0 | 2.0 | 1421 | $1,700 | $1.20 | 19d | 1 | 0.90mi |
| 1336 N 29th St Baton Rouge, LA | 3.0 | 2.0 | 1400 | $1,450 | $1.04 | 14d | 1 | 0.99mi |
| 1404 N 29th St Baton Rouge, LA | 3.0 | 2.0 | 1120 | $1,100 | $0.98 | 43d | 1 | 0.99mi |
| 3044 Wilshire Dr Baton Rouge, LA | 3.0 | 2.0 | 1734 | $2,350 | $1.36 | 14d | 1 | 1.04mi |
| 650 N Ardenwood Dr Baton Rouge, LA | 1.0–4.0 | 1.0–2.0 | 951 | $1,432 | $1.51 | 43d | 1 | 1.08mi |
| 5704 Goodwood Crossing Ln Baton Rouge, LA | 3.0 | 2.5 | 1571 | $1,900 | $1.21 | 43d | 1 | 1.09mi |
| 5704 Goodwood Crossing Ln Baton Rouge, LA | 3.0 | 2.5 | 1571 | $1,900 | $1.21 | 14d | 1 | 1.09mi |
| 5000 Claycut Rd Baton Rouge, LA | 1.0–4.0 | 1.0–2.5 | 1600 | $2,301 | $1.44 | 14d | 1 | 1.10mi |
| 6645 Harry Dr Baton Rouge, LA | 2.0–4.0 | 1.0–2.0 | 1013 | $1,450 | $1.43 | 14d | 14 | 1.29mi |
| 755 Arlington Ave Baton Rouge, LA | 4.0 | 2.5 | 1760 | $2,250 | $1.28 | 19d | 1 | 1.32mi |
| 6867 Titian Ave Baton Rouge, LA | 1.0–3.0 | 1.0–2.0 | 886 | $900 | $1.02 | 14d | 3 | 1.39mi |
| 2120 Convention St Baton Rouge, LA | 3.0 | 2.0 | 2200 | $1,675 | $0.76 | 14d | 1 | 1.42mi |
| 6908 Goya Ave Unit B Baton Rouge, LA | 3.0 | 2.0 | 1398 | $1,750 | $1.25 | 43d | 1 | 1.45mi |
| 6908 Goya Ave Unit A Baton Rouge, LA | 3.0 | 2.0 | 1302 | $1,650 | $1.27 | 21d | 1 | 1.45mi |
| 6918 Goya Ave Unit A Baton Rouge, LA | 3.0 | 2.0 | 1398 | $1,785 | $1.28 | 14d | 1 | 1.46mi |
| 925 Rittiner Dr Unit 927 Baton Rouge, LA | 3.0 | 1.0 | 1147 | $1,250 | $1.09 | 43d | 1 | 1.50mi |
| 2645 Seneca St Baton Rouge, LA | 3.0 | 2.0 | 1650 | $1,550 | $0.94 | 23d | 1 | 1.50mi |
Listing history 6 events
-
2026-06-18days on market $80,000 Coming Soon 7 DOM
-
2026-06-17days on market $80,000 Coming Soon 6 DOM
-
2026-06-16days on market $80,000 Coming Soon 5 DOM
-
2026-06-15days on market $80,000 Coming Soon 4 DOM
-
2026-06-14remarks 143-char remark
-
2026-06-14$80,000 Coming Soon 2 DOM
ⓘ Source: listings_history table (triggers on properties + properties_extension) + one-shot
backfill from property_details.listing_events for pre-trigger history.
Tax reassessment forecast LA · Resets to sale price
- Current annual tax
- $282 · $24/mo
- Projected year-2 tax
- $440 · $37/mo
- Expected delta
- +$158/yr (+$13/mo · 56.0%)
ⓘ Screening estimate from a state-policy table — verify with the county assessor before closing.
Climate risk First Street
- Flood 4/10 Moderate FEMA zone X (unshaded) · 22% chance over 30 yrs
- Wildfire 1/10 Low
- Heat 8/10 Severe 7 d/yr ≥108°F today · 20 d/yr by 30 yrs out
- Wind 9/10 Extreme 99% chance of damaging wind over 30 yrs
- Air quality 3/10 Moderate 3 unhealthy d/yr today · 4 by 30 yrs out
Nearby sold comps map
Loading sold comps map…
Walkable amenities ~0.75 mi
Loading nearby amenities…
Taxation est. · year 1
- Rental income
- $19,311
- − Mortgage interest
- −$4,481
- − Property taxes
- −$282
- − Insurance
- −$400
- − Repairs & maintenance
- −$1,545
- − Management
- −$1,545
- − Depreciation
- −$2,327
- Taxable income
- $8,731
- Est. tax owed @ 24.0%
- −$2,095
- After-tax cash flow
- $7,444/yr
For passive investors: Depreciation is non-cash, so a rental often shows a tax loss while cash-flowing — sheltering income. Rental losses are passive: they offset passive income freely, and up to $25,000/yr can offset ordinary (W-2) income if you actively participate and your MAGI is under $100k (phasing out to $0 by $150k); unused losses carry forward. On sale, claimed depreciation is recaptured at up to 25%, and gains may owe capital-gains tax (a 1031 exchange can defer both). Figures are a year-1 estimate at your 24.0% rate — not tax advice; consult a CPA.
Schools (NCES district)
- District
- East Baton Rouge Parish
- NCES district ID
- 2200540
- Math proficiency
- 22% ▼ -36.00%
- Reading proficiency
- 34% ▼ -31.00%
- Median HH income
- $46,263
- Composite
- 24.14/100
- National rank
- #7745
- State rank
- #47 of 98 in LA
Livability — Baton Rouge
- Score
- 74/100
- State rank
- #24
- US rank
- #4535
Category grades
Schools grade is shown separately in the Schools card above.
Census & demographics
- Census place
- Baton Rouge, LA
- County
- East Baton Rouge Parish · 399,686 people
- City population
- 351,868
- Metro
- Baton Rouge, LA
- Population (ZIP)
- 25,118
- Household income
- $34,458
- Rent vs Own
- Severe rent burden
- 1831.0
Population outlook (East Baton Rouge County) Hauer SSP2
- Today (2025)
- 464,810 people
- By 2030
- 472,137 · +1.6%
- By 2040
- 480,243 · +3.3%
- By 2050
- 484,422 · +4.2%
- By 2075
- 492,069 · +5.9%
- By 2100
- 476,347 · +2.5%
Race, ethnicity, and origin ACS 2023
- Neighborhood character
- Predominantly Black (69%)
- Race & ethnicity
- Black 69% White 20% Two or more races 5% Hispanic / Latino 5% Asian 3%
- Common ancestry
- Lithuanian 2% Italian 1% Iranian 0%
- Foreign-born
- 6% · Canada, Vietnam
- Languages at home
- 91% English-only · Spanish 3% Tagalog/Filipino 1% Other Indo-European 1%
Political lean MEDSL · East Baton Rouge
- 2024 margin
- D (+11.1) · D 54.5% · R 43.4% · Other 2.1%
- 2008→2024 swing
- +8.9pp toward D · 2008: 2.2pp · 2024: 11.1pp
- All cycles
- 2024: D+11.1 2020: D+13.1 2016: D+9.2 2012: D+5.2 2008: D+2.2
Not yet ingested
- Civics
- —
Market trends
- HPI YoY
- ▼ -137.02%
- Current HPI
- 47.7285
- Rent YoY
- ▲ 6.59%
- Metro
- Baton Rouge, LA
- State GDP YoY
- ▲ 3.29%
- F500 in state
- 10
Industry mix (Fortune 500 HQ in LA)
| Industry | F500 HQs | Revenue |
|---|---|---|
| Telecommunications | 2 | $23B |
|
||
| Utilities | 1 | $12B |
|
||
| Wholesale / Distribution | 1 | $5B |
|
||
| Advertising | 1 | $2B |
|
||
Price history
-42.9% since first listed15 events — show timeline
- 2026-06-11 Coming Soon $80,000 AcadianaMLS
- 2026-06-11 Coming Soon $80,000 GBRMLS
- 2025-05-14 Rental Removed $1,200 GBRMLS
- 2025-04-23 Price Changed $1,200 GBRMLS
- 2025-04-08 Price Changed $2,023 GBRMLS
- 2025-04-07 Listed for Rent — GBRMLS
- 2025-03-12 Sold (Public Records) $99,000 Public Records
- 2025-03-11 Sold (MLS) — GBRMLS
- 2025-01-23 Pending — GBRMLS
- 2025-01-15 Listed $100,000 GBRMLS
- 2025-01-14 Listed $100,000 AcadianaMLS
- 2024-11-30 Delisted — GBRMLS
- 2024-09-25 Price Changed $130,000 GBRMLS
- 2024-05-31 Listed $130,000 AcadianaMLS
- 2024-05-31 Listed $140,000 GBRMLS
Property tax history
+20.5%/yrLatest (2025): $282 · +4.7% YoY. Source: county tax records.
Cash-flow waterfall
monthlySold comps — $/sqft
last 12 mo · ≤1 miLoading sold comps…