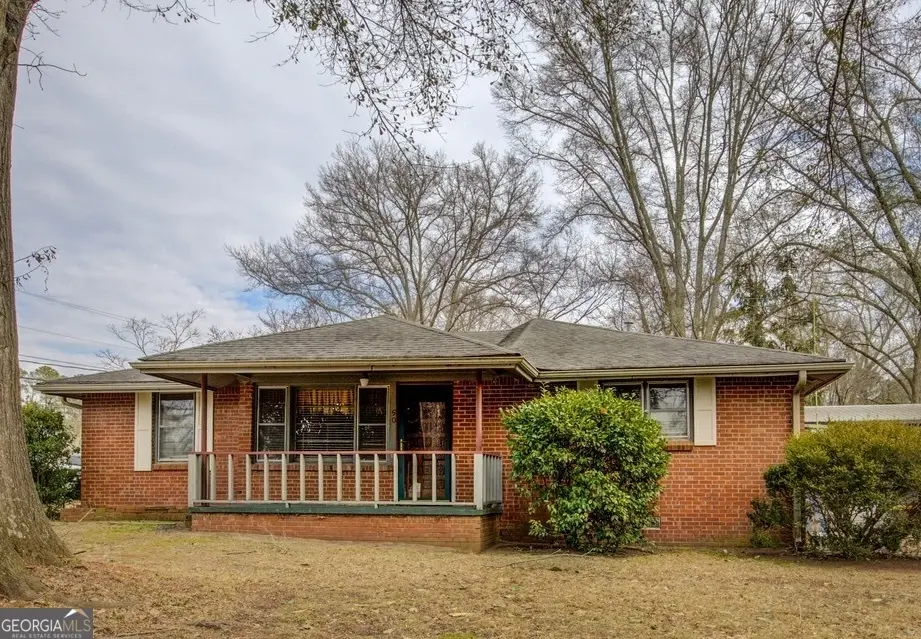
50 Stacia Dr · Porterdale, GA
Flood risk 1/10 · Minimal
- FEMA flood zone
- X (unshaded)
- Chance of flooding over 30 yrs
- 0.0%
- Est. flood insurance / yr
- $507 – $1,088
Fire risk 3/10 · Minor
- Est. fire insurance / yr
- $963 – $1,789
Heat risk 6/10 · Moderate
- Hot days now (above 106°F)
- 7 days/yr
- Hot days in 30 yrs
- 18 days/yr
Wind risk 6/10 · Moderate
- Chance of severe wind over 30 yrs
- 27.0%
Air-quality risk 4/10 · Minor
- Unhealthy air days now
- 5 days/yr
- Unhealthy air days in 30 yrs
- 6 days/yr
Risk factors via First Street. Map © Google.
Why this score? — see what drove the D+ grade
The composite is a weighted blend of 9 inputs, each scored 0–100. Each bar is that input's sub-score; the figure is the points it added to the 100-point composite (weight × sub-score).
- Cash flow +16.3/30.0
- ARV discount +15.0/15.0
- DSCR +5.0/10.0
- 1% rule +3.3/10.0
- Rent growth +3.0/5.0
- Livability +2.9/5.0
- Condition / age +2.5/5.0
- Schools +1.9/10.0
- Appreciation +0.0/10.0
$245,000
🖨 Deal sheet 📄 Offer letter ✓ Due diligence
Listing remarks MLS
Brick rancher with lots of character and a wonderful setting on .92 acres! 3 bedrooms, 2 baths (1448 sq. ft), plus a 1 bedroom, 1 bath guesthouse (743 sq. ft)! Hardwoods throughout main home, lots of outdoor living space, small shop and a "she shed." Guest house presents potential income or in-law suite. Some TLC needed, estate owned.
Key facts
- Brick rancher
- Small shop
- Guest house
Tags
Neighborhood map
What this means for you Summary
Snapshot
- This is a 4-bed/1.0-bath single-family listed at $245k.
Deal economics
- At list price, monthly cash flow is $133 ($2k/yr) — positive.
- The deal already cash-flows at list — no discount required.
- To meet the 1% rule (rent ≥ 1% of price), the offer needs to be $203k (17.3% below list).
- Recommended offer: $203k (17.3% below list) — sets the bar for 1% rule.
- Cap rate 6.9% vs local median 5.1% in Porterdale — top-decile yield for the area; either an underpriced asset or a hidden risk that comps aren't pricing in. Stress-test before assuming the spread holds.
Location & tenants
- Location reads 58/100 on livability (#447 in GA) — a working-class tenant base; expect higher turnover. Strengths: cost of living A+, crime B+, housing B; Watch: schools F, amenities F, commute F.
- Newton County (suburban): math 17% / reading 26% proficiency, ranked #137 of 174 in GA (top 79%) — low school quality limits family demand, transient renter base, plan for 1-2y turnover.
- Market conditions: Rents rising (+1.8%/yr); 419 active listings in the ZIP; 9 comparable units currently listed for rent nearby; rentals leasing fast (median 5d on market — plan ~1-2 weeks tenant-placement turnaround); solid renter incomes; 1,480 units permitted in Newton County in 2024 (702 in 5+ unit buildings).
- This rent runs 31% of the median local income ($80k/yr) — at the standard rent-burdened threshold; future hikes will face affordability resistance.
Forward outlook
- Local home prices are declining (-3.0%/yr); year-one equity from $2k of loan paydown is wiped out by about $7k of value loss. Plan a longer hold.
- Newton County population projected at +23% by 2050 — long-run rental-demand tailwind backs the buy-and-hold thesis.
Negotiation context
- It's been on market 90 days — a 6% lower offer ($230k) is reasonable based on typical stale-listing flexibility.
Risks & watch-outs
- Climate carrying-cost: major wind risk, 27% chance of damaging wind over 30y; extreme-heat days projected 7→18/yr by 2055 (HVAC capex compounding) — expect insurance premiums to compound above CPI over the hold.
Questions for the listing agent
- It's been on market 90 days. Have you received any prior offers? Is the seller open to a 17% concession, seller financing, or rate buy-down credit?
- Built in 1960 — when were the roof, HVAC, electrical panel, plumbing, and water heater last replaced?
- Why hasn't it sold? Are there any deal-killer items the seller is aware of (foundation, flood, title, zoning, code violations)?
- Is there a deadline driving the sale (1031 exchange, divorce, estate, relocation)? That informs how much negotiation room exists.
- Schools are F-rated, which usually means shorter tenancies and higher turnover. Who's the typical renter profile here, and what's been the actual vacancy rate?
- The area grade is low — what's the realistic commute time and amenity access for the typical tenant pool here? Any planned neighborhood developments (good or bad) we should know about?
- What's the average days-on-market for RENTAL listings here right now (not sales)? A rising rental-DOM trend means longer vacancies and softer asking-rent achievability than the comps imply.
- What's the recent tenant-quality profile in this submarket — average credit score on applications, eviction rate, late-payment / NSF rate, and stable-employment percentage? A property-management company in the area should have these aggregated.
- How much new for-sale + rental construction is in the pipeline within 1–3 miles? Heavy new supply typically softens prices + rents 12–24 months out; constrained supply supports both.
Investment metrics
- 1% rule
- 0.83% ✗
- Cap rate
- 6.95%
- Cash-on-cash
- 2.33%
- DSCR
- 1.10
- GRM
- 10.1
CMA / ARV
- ARV (median comp)
- $294,055
- List price
- $245,000
- Delta
- -16.68%
- Verdict
- UNDERPRICED
- Comps
- 20 within 1.0 mi
Show comp detail 12 sales within ~0.75 mi
| Address | Dist | Beds/Ba | Sqft | Sold | Price | $/sf | Match |
|---|---|---|---|---|---|---|---|
| 235 Mountain View Cir | 0.39mi | 3/2.0 (-1) | 1,412 (-1%) | 4mo | $190,400 | $135 | 67 |
| 140 Ridge Pointe Dr | 0.21mi | 3/2.0 (-1) | 1,530 (+7%) | 7mo | $260,000 | $170 | 64 |
| 95 Stone Commons Way | 0.14mi | 3/2.0 (-1) | 1,530 (+7%) | 15mo | $247,550 | $162 | 60 |
| 35 Taunton Rd | 0.46mi | 3/1.5 (-1) | 1,465 (+2%) | 16mo | $220,000 | $150 | 55 |
| 170 Hidden Pines Dr | 0.49mi | 4/2.0 | 1,272 (-11%) | 1mo | $237,000 | $186 | 54 |
| 60 Mountain View Cir | 0.22mi | 3/2.0 (-1) | 1,285 (-10%) | 14mo | $170,000 | $132 | 52 |
| 200 Hidden Pines Dr | 0.53mi | 3/2.0 (-1) | 1,325 (-8%) | 3mo | $239,000 | $180 | 51 |
| 2000 Stacia Dr | 0.50mi | 3/2.0 (-1) | 1,500 (+5%) | 11mo | $250,000 | $167 | 51 |
| 220 Mountain View Cir | 0.39mi | 3/2.0 (-1) | 1,280 (-11%) | 10mo | $230,000 | $180 | 47 |
| 915 Navajo Trl | 0.42mi | 3/2.0 (-1) | 1,233 (-14%) | 4mo | $235,000 | $191 | 45 |
| 890 Navajo Trl | 0.40mi | 3/2.0 (-1) | 1,302 (-9%) | 15mo | $228,000 | $175 | 45 |
| 945 Navajo Trl | 0.49mi | 3/2.0 (-1) | 1,305 (-9%) | 13mo | $225,000 | $172 | 42 |
Match score weights: distance 35% · size 25% · config 20% · recency 20%. Top-matched comps best support the ARV.
Projected returns pro-forma
-3.0% appreciation · 1.84% rent growth · sell at horizon
- IRR
- -13.8%
- Equity multiple
- 0.51×
- Total profit
- $-33,664
- Equity at exit
- $36,530
- IRR
- -6.8%
- Equity multiple
- 0.59×
- Total profit
- $-28,202
- Equity at exit
- $21,183
Cash invested: $68,600 (down + closing). Projections, not guarantees.
Landlord ↔ Tenant lean methodology
- Overall (STATE)
- 90 Strongly Landlord-Friendly
- State Georgia
- 90 Strongly Landlord-Friendly · R+3
- County
- — inherits STATE
- City
- — inherits STATE
ZIP-level market 30016
- Home prices YoY
- -8.6%
- Rents YoY
- 1.8%
- Active inventory
- 419
- Price-to-rent
- 10.1×
Monthly cashflow live
- Estimated rent
- $2,026 high interval (Pro) →
- Mortgage (P&I)
- −$1,285
- Tax from tax record
- −$80 /mo · $963/yr
- Insurance
- −$102
- HOA
- −$0
- Vacancy / Maint / Mgmt
- −$425
- Net cashflow
- $133
Break-even live
UW: 25.0% down · 7.5% · 30yr · 1.5% tax · 5.0% vac · 8.0% maint · 8.0% mgmt
Financing live
Cash to close
- Down payment
- $61,250
- Closing costs
- $7,350
- Reserves months
- —
- Total cash needed
- —
Loan-product check · same deal, 3 products live
Conventional
25% down · 7.5% · 30yr
- Down + closing
- —
- Monthly P&I
- —
- Monthly cashflow
- —
- DSCR
- —
- Eligible?
- —
Personal DTI + credit; lowest rate.
DSCR
20% down · 8.5% · 30yr
- Down + closing
- —
- Monthly P&I
- —
- Monthly cashflow
- —
- DSCR
- —
- Eligible?
- —
No personal income docs; deal must DSCR.
Hard money
10% down · 12.0% · 12mo
- Down + closing
- —
- Monthly P&I
- —
- Monthly cashflow
- —
- DSCR
- —
- Eligible?
- —
Short-term bridge; refi at stabilization.
Rent comps 9 comps
| Address | Beds | Baths | Sqft | Rent | $/sqft | DOM | Units | Dist |
|---|---|---|---|---|---|---|---|---|
| 100 Fleeta Dr Covington, GA | 3.0 | 2.0 | 1379 | $1,550 | $1.12 | 5d | 1 | 0.14mi |
| 375 Stone Ridge Way Covington, GA | 3.0 | 2.0 | 1478 | $1,870 | $1.27 | 5d | 1 | 0.18mi |
| 10154 Allen Dr SW Covington, GA | 3.0 | 2.0 | 1056 | $1,800 | $1.70 | 20d | 1 | 0.75mi |
| 10154 Allen Dr SW Covington, GA | 3.0 | 2.0 | 1056 | $1,800 | $1.70 | 5d | 1 | 0.75mi |
| 9161 Thrash St SW Covington, GA | 4.0 | 2.0 | 1272 | $1,481 | $1.16 | 43d | 1 | 0.91mi |
| 9135 Jefferson Village Dr SW Covington, GA | 3.0 | 2.5 | 1126 | $1,736 | $1.54 | 5d | 1 | 1.01mi |
| 9123 Jefferson Village Dr SW Covington, GA | 3.0 | 2.0 | 1220 | $1,750 | $1.43 | 22d | 1 | 1.03mi |
| 8246 Collier St SW Covington, GA | 3.0 | 1.0 | 1225 | $1,300 | $1.06 | 43d | 1 | 1.18mi |
| 65 Kenzi Way SW Covington, GA | 3.0 | 2.0 | 1217 | $1,000 | $0.82 | 5d | 1 | 1.34mi |
Listing history 3 events
-
2026-05-07status Under Contract 346-char remark
Show marketing remark (346 chars)
Brick rancher with lots of character and a wonderful setting on .92 acres! 3 bedrooms, 2 baths (1448 sq. ft), plus a 1 bedroom, 1 bath guesthouse (743 sq. ft)! Hardwoods throughout main home, lots of outdoor living space, small shop and a "she shed." Guest house presents potential income or in-law suite. Some TLC needed, estate owned.
-
2026-03-26price $245,000 346-char remark
Show marketing remark (346 chars)
Brick rancher with lots of character and a wonderful setting on .92 acres! 3 bedrooms, 2 baths (1448 sq. ft), plus a 1 bedroom, 1 bath guesthouse (743 sq. ft)! Hardwoods throughout main home, lots of outdoor living space, small shop and a "she shed." Guest house presents potential income or in-law suite. Some TLC needed, estate owned.
-
2026-01-28$259,000 New 346-char remark
Show marketing remark (346 chars)
Brick rancher with lots of character and a wonderful setting on .92 acres! 3 bedrooms, 2 baths (1448 sq. ft), plus a 1 bedroom, 1 bath guesthouse (743 sq. ft)! Hardwoods throughout main home, lots of outdoor living space, small shop and a "she shed." Guest house presents potential income or in-law suite. Some TLC needed, estate owned.
ⓘ Source: listings_history table (triggers on properties + properties_extension) + one-shot
backfill from property_details.listing_events for pre-trigger history.
Tax reassessment forecast GA · Resets to sale price
- Current annual tax
- $963 · $80/mo
- Projected year-2 tax
- $2,254 · $188/mo
- Expected delta
- +$1,291/yr (+$108/mo · 134.0%)
ⓘ Screening estimate from a state-policy table — verify with the county assessor before closing.
Climate risk First Street
- Flood 1/10 Low FEMA zone X (unshaded) · 0% chance over 30 yrs
- Wildfire 3/10 Moderate
- Heat 6/10 Major 7 d/yr ≥106°F today · 18 d/yr by 30 yrs out
- Wind 6/10 Major 27% chance of damaging wind over 30 yrs
- Air quality 4/10 Moderate 5 unhealthy d/yr today · 6 by 30 yrs out
Nearby sold comps map
Loading sold comps map…
Walkable amenities ~0.75 mi
Loading nearby amenities…
Taxation est. · year 1
- Rental income
- $24,309
- − Mortgage interest
- −$13,724
- − Property taxes
- −$963
- − Insurance
- −$1,225
- − Repairs & maintenance
- −$1,945
- − Management
- −$1,945
- − Depreciation
- −$7,127
- Taxable loss
- −$2,620
- Est. tax savings @ 24.0%
- +$629
- After-tax cash flow
- $2,227/yr
For passive investors: Depreciation is non-cash, so a rental often shows a tax loss while cash-flowing — sheltering income. Rental losses are passive: they offset passive income freely, and up to $25,000/yr can offset ordinary (W-2) income if you actively participate and your MAGI is under $100k (phasing out to $0 by $150k); unused losses carry forward. On sale, claimed depreciation is recaptured at up to 25%, and gains may owe capital-gains tax (a 1031 exchange can defer both). Figures are a year-1 estimate at your 24.0% rate — not tax advice; consult a CPA.
Schools (NCES district)
- District
- Newton County
- NCES district ID
- 1303930
- Math proficiency
- 17% ▼ -13.00%
- Reading proficiency
- 26% ▼ -8.00%
- Median HH income
- $50,768
- Composite
- 19.2/100
- National rank
- #8816
- State rank
- #137 of 174 in GA
Livability — Porterdale
- Score
- 58/100
- State rank
- #447
- US rank
- #21362
Category grades
Schools grade is shown separately in the Schools card above.
Census & demographics
- County
- Newton County · 104,393 people
- City population
- 76
- Metro
- Atlanta-Sandy Springs-Alpharetta, GA
- Population (ZIP)
- 62,968
- Household income
- $79,527
- Rent vs Own
- Severe rent burden
- 1172.0
Population outlook (Newton County) Hauer SSP2
- Today (2025)
- 118,372 people
- By 2030
- 124,234 · +5.0%
- By 2040
- 135,550 · +14.5%
- By 2050
- 145,309 · +22.8%
- By 2075
- 166,843 · +40.9%
- By 2100
- 175,800 · +48.5%
Race, ethnicity, and origin ACS 2023
- Neighborhood character
- Diverse neighborhood (Simpson 0.57)
- Race & ethnicity
- Black 59% White 29% Two or more races 8% Hispanic / Latino 6% Asian 1%
- Hispanic origin (detail)
- Mexican 4%
- Common ancestry
- Lithuanian 1% Slovak 1%
- Foreign-born
- 6% · Canada, China
- Languages at home
- 94% English-only · Spanish 4% Other Asian/Pacific 1% French/Haitian/Cajun 1%
Political lean MEDSL · Newton
- 2024 margin
- D (+15.1) · D 57.3% · R 42.2%
- 2008→2024 swing
- +14.0pp toward D · 2008: 1.2pp · 2024: 15.1pp
- All cycles
- 2024: D+15.1 2020: D+10.9 2016: D+2.4 2012: D+2.0 2008: D+1.2
Not yet ingested
- Civics
- —
Market trends
- HPI YoY
- ▼ -29.68%
- Current HPI
- 317.5605
- Rent YoY
- ▲ 1.84%
- Metro
- Atlanta-Sandy Springs-Alpharetta, GA
- State GDP YoY
- ▲ 2.66%
- F500 in state
- 28
Industry mix (Fortune 500 HQ in GA)
| Industry | F500 HQs | Revenue |
|---|---|---|
| Paper / Packaging | 2 | $29B |
|
||
| Retail | 1 | $160B |
|
||
| Transportation / Logistics | 1 | $91B |
|
||
| Airlines | 1 | $62B |
|
||
| Consumer Goods | 1 | $47B |
|
||
| Utilities | 1 | $25B |
|
||
Price history
-5.4% since first listed3 events — show timeline
- 2026-05-07 Pending — GAMLS
- 2026-03-26 Price Changed $245,000 GAMLS
- 2026-01-28 Listed $259,000 GAMLS
Property tax history
+24.6%/yrLatest (2025): $963 · +13.0% YoY. Source: county tax records.
Cash-flow waterfall
monthlySold comps — $/sqft
last 12 mo · ≤1 miLoading sold comps…