 Multi-family
511 1st St · Menominee, MI
Flood risk No data
- FEMA flood zone
- —
- Chance of flooding over 30 yrs
- —
- Est. flood insurance / yr
- —
Fire risk No data
- Est. fire insurance / yr
- —
Heat risk No data
- Hot days now (above threshold)
- —
- Hot days in 30 yrs
- —
Wind risk No data
- Chance of severe wind over 30 yrs
- —
Air-quality risk No data
- Unhealthy air days now
- —
- Unhealthy air days in 30 yrs
- —
Risk factors via First Street. Map © Google.
Why this score? — see what drove the B- grade
The composite is a weighted blend of 9 inputs, each scored 0–100. Each bar is that input's sub-score; the figure is the points it added to the 100-point composite (weight × sub-score).
- Cash flow +30.0/30.0
- 1% rule +10.0/10.0
- DSCR +10.0/10.0
- ARV discount +7.5/15.0
- Livability +3.6/5.0
- Schools +2.9/10.0
- Rent growth +2.5/5.0
- Condition / age +1.0/5.0
- Appreciation +0.0/10.0
$245,000
🖨 Deal sheet 📄 Offer letter ✓ Due diligence
Multi-family units
County records classify this as Multi-Family (2-4 Unit). Listing-text estimate: 1 unit. estimate disagrees with records
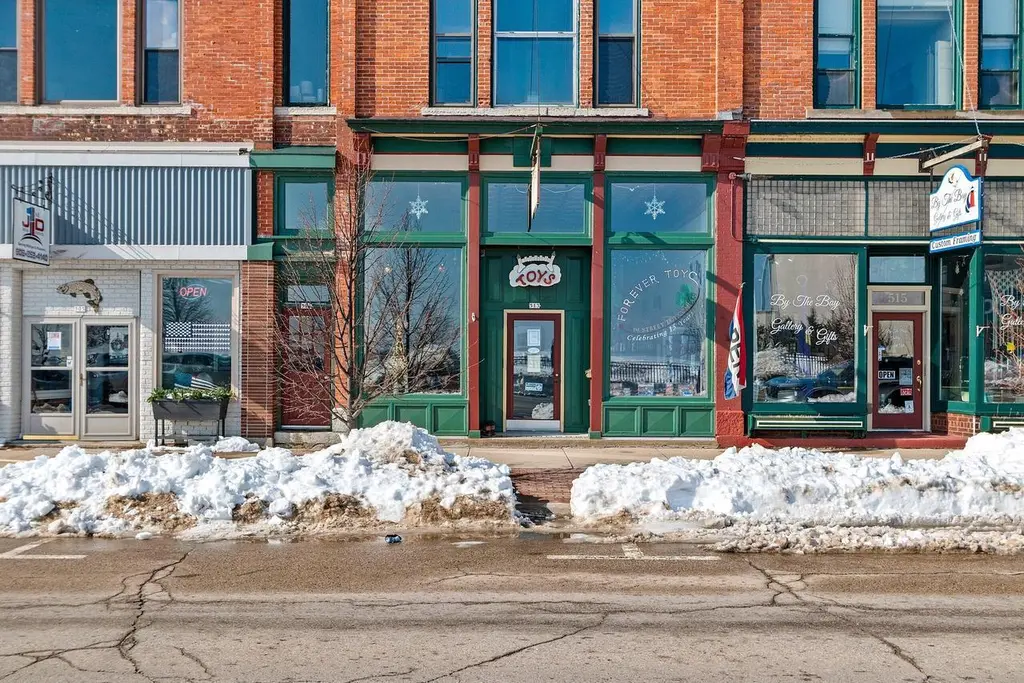
Listing remarks
Incredible opportunity is located in the beautiful downtown historic district. So much potential, 4 rental units, 3 stories, generating income of $2190 per month. All tenants on a mo to mo basis. EXCELLENT rental history!! 1st floor is currently Retail Commercial property & boasts 2200+sq', Ideal location for any retail business or many other options. 3 Residential Rentals, 2 on the 2nd floor & 1 on the 3rd floor. Front unit overlooks the Bay of Green Bay, is 2 BR w/ 1136sq', Back unit is a 1 BR w/ 700sq', 3rd floor is 1 BR w/ 795sq', designated tenant parking, coin op laundry w/ 50/50 split with leasing co. Retail Business is also available for $30K & includes fixtures,
Key facts
- Coin op laundry
- 4 rental units
- 3 stories
Tags
Neighborhood map
What this means for you Summary
Snapshot
- This is a multifamily listed at $245k. Condition is rated poor.
Deal economics
- At list price, monthly cash flow is $2k ($19k/yr) — positive.
- The deal already cash-flows at list — no discount required.
- Meets the 1% rule at list price ($4k rent vs $245k).
- Cap rate 14.0% vs local median 4.0% in Menominee — top-decile yield for the area; either an underpriced asset or a hidden risk that comps aren't pricing in. Stress-test before assuming the spread holds.
Location & tenants
- Location reads 71/100 on livability (#282 in MI) — a middle-class / working-renter tenant base. Strengths: cost of living A+, housing A+, health & safety A+; Watch: schools C-, amenities F, commute F.
- Menominee Area Public Schools (town): math 26% / reading 42% proficiency, ranked #312 of 540 in MI (top 58%) — families likely to look elsewhere, expect single-tenant / working-renter base with shorter leases.
- Market conditions: 64 active listings in the ZIP; 26 units permitted in Menominee County in 2024 (0 in 5+ unit buildings).
Forward outlook
- Local home prices are declining (-3.0%/yr); year-one equity from $2k of loan paydown is wiped out by about $7k of value loss. Plan a longer hold.
- Menominee County population projected at -19% by 2050 — secular population decline; favor cash flow + early exit over multi-decade hold.
- At projected returns (-3.0% appreciation + 3.0% rent growth), your $69k cash investment doubles in ~5 years — after that, you're playing with house money.
Negotiation context
- Only 11 days on market — expect competitive offers; lowballing is unlikely to land.
Risks & watch-outs
- Watch-outs: built in 1890 — expect roof / HVAC / electrical / plumbing capex.
Questions for the listing agent
- Have any recent inspections been done? Can we get a copy of the seller's disclosures and any deferred-maintenance estimates?
- Built in 1890 — when were the roof, HVAC, electrical panel, plumbing, and water heater last replaced?
- Is there a deadline driving the sale (1031 exchange, divorce, estate, relocation)? That informs how much negotiation room exists.
- What's the average days-on-market for RENTAL listings here right now (not sales)? A rising rental-DOM trend means longer vacancies and softer asking-rent achievability than the comps imply.
- What's the recent tenant-quality profile in this submarket — average credit score on applications, eviction rate, late-payment / NSF rate, and stable-employment percentage? A property-management company in the area should have these aggregated.
- How much new apartment / multifamily construction is in the pipeline within 1–3 miles? Heavy new supply (>2% of stock underway) typically softens rents 12–24 months out; light construction supports rent growth.
Investment metrics
- 1% rule
- 1.69% ✓
- Cap rate
- 13.98%
- Cash-on-cash
- 27.46%
- DSCR
- 2.22
- GRM
- 4.9
CMA / ARV
No comps found within radius.
Projected returns pro-forma
-3.0% appreciation · 3.0% rent growth · sell at horizon
- IRR
- 21.5%
- Equity multiple
- 1.88×
- Total profit
- $60,328
- Equity at exit
- $36,530
- IRR
- 29.6%
- Equity multiple
- 3.65×
- Total profit
- $181,508
- Equity at exit
- $21,183
Cash invested: $68,600 (down + closing). Projections, not guarantees.
Landlord ↔ Tenant lean methodology
- Overall (STATE)
- 62 Landlord-Friendly
- State Michigan
- 62 Landlord-Friendly · EVEN
- County
- — inherits STATE
- City
- — inherits STATE
ZIP-level market 49858
- Home prices YoY
- -31.4%
- Active inventory
- 64
- Price-to-rent
- 19.8×
Monthly cashflow live
- Estimated rent
- $4,130 medium interval (Pro) →
- Mortgage (P&I)
- −$1,285
- Tax est. 1.5%
- −$306 /mo · $3,675/yr
- Insurance
- −$102
- HOA
- −$0
- Vacancy / Maint / Mgmt
- −$867
- Net cashflow
- $1,570
Break-even live
4-unit breakdown (identical units grouped — click to expand)
| Units | Beds | Baths | Est. rent |
|---|---|---|---|
| 1× unit | 3 | 1.5 | $1,032 |
| 3× units | 1 | 1.5 | $3,096 |
| #2 | 1 | 1.5 | $1,032 |
| #3 | 1 | 1.5 | $1,032 |
| #4 | 1 | 1.5 | $1,032 |
| Total (4 units) | $4,130 | ||
UW: 25.0% down · 7.5% · 30yr · 1.5% tax · 5.0% vac · 8.0% maint · 8.0% mgmt
Financing live
Cash to close
- Down payment
- $61,250
- Closing costs
- $7,350
- Reserves months
- —
- Total cash needed
- —
Loan-product check · same deal, 3 products live
Conventional
25% down · 7.5% · 30yr
- Down + closing
- —
- Monthly P&I
- —
- Monthly cashflow
- —
- DSCR
- —
- Eligible?
- —
Personal DTI + credit; lowest rate.
DSCR
20% down · 8.5% · 30yr
- Down + closing
- —
- Monthly P&I
- —
- Monthly cashflow
- —
- DSCR
- —
- Eligible?
- —
No personal income docs; deal must DSCR.
Hard money
10% down · 12.0% · 12mo
- Down + closing
- —
- Monthly P&I
- —
- Monthly cashflow
- —
- DSCR
- —
- Eligible?
- —
Short-term bridge; refi at stabilization.
Listing history 2 events
-
2026-04-03status Pending
-
2026-03-21$245,000 Active
ⓘ Source: listings_history table (triggers on properties + properties_extension) + one-shot
backfill from property_details.listing_events for pre-trigger history.
Nearby sold comps map
Loading sold comps map…
Walkable amenities ~0.75 mi
Loading nearby amenities…
Taxation est. · year 1
- Rental income
- $49,560
- − Mortgage interest
- −$13,724
- − Property taxes
- −$3,675
- − Insurance
- −$1,225
- − Repairs & maintenance
- −$3,965
- − Management
- −$3,965
- − Depreciation
- −$7,127
- Taxable income
- $15,879
- Est. tax owed @ 24.0%
- −$3,811
- After-tax cash flow
- $15,024/yr
For passive investors: Depreciation is non-cash, so a rental often shows a tax loss while cash-flowing — sheltering income. Rental losses are passive: they offset passive income freely, and up to $25,000/yr can offset ordinary (W-2) income if you actively participate and your MAGI is under $100k (phasing out to $0 by $150k); unused losses carry forward. On sale, claimed depreciation is recaptured at up to 25%, and gains may owe capital-gains tax (a 1031 exchange can defer both). Figures are a year-1 estimate at your 24.0% rate — not tax advice; consult a CPA.
Condition & rehab AI · 1 photo
This multi-family property requires extensive repairs and updates, including a new roof, exterior siding and paint, HVAC and mechanical systems, and landscaping. Significant investment is needed to bring the property up to a good condition and improve its resale and rental value.
Repairs flagged
- Major roof — Signs of potential leaks and wear suggest a major repair is needed.
- Major exterior siding — The siding appears old and in poor condition, indicating a major repair is needed.
- Major HVAC/mechanicals — The lack of visible systems suggests they may be old and in need of replacement.
- Major landscaping — The sparse and poorly maintained landscaping suggests a major upgrade is needed to improve curb appeal.
Value-add opportunities
- Both roof replacement — A new roof would significantly improve the home's appearance and functionality.
- Both exterior siding and paint — Updating the siding and painting the exterior would greatly enhance the home's curb appeal and value.
- Both HVAC and mechanical systems — Upgrading the HVAC and mechanical systems would improve comfort and energy efficiency, both of which are important for both resale and rental value.
- Both landscaping and curb appeal — A well-maintained and aesthetically pleasing landscape would significantly boost the home's curb appeal and overall value.
Renovation cost estimate screening
| Repair item | Severity | Est. cost |
|---|---|---|
| roof · Signs of potential leaks and wear suggest a major repair is needed. | Major | $15,000–50,000 |
| exterior siding · The siding appears old and in poor condition, indicating a major repair is needed. | Major | $15,000–50,000 |
| HVAC/mechanicals · The lack of visible systems suggests they may be old and in need of replacement. | Major | $15,000–50,000 |
| landscaping · The sparse and poorly maintained landscaping suggests a major upgrade is needed to improve curb appeal. | Major | $15,000–50,000 |
| Total estimated repair cost · 4 items | $60,000–200,000 |
Value-add ROI direction
- Both roof replacement — A new roof would significantly improve the home's appearance and functionality. ↑
- Both exterior siding and paint — Updating the siding and painting the exterior would greatly enhance the home's curb appeal and value. ↑
- Both HVAC and mechanical systems — Upgrading the HVAC and mechanical systems would improve comfort and energy efficiency, both of which are important for both resale and rental value. ↑
- Both landscaping and curb appeal — A well-maintained and aesthetically pleasing landscape would significantly boost the home's curb appeal and overall value. ↑
ⓘ Cost ranges are severity-bucket heuristics (US national rule-of-thumb). Get contractor quotes + a written scope before underwriting a rehab budget.
Schools (NCES district)
- District
- Menominee Area Public Schools
- NCES district ID
- 2623550
- Math proficiency
- 26% ▼ -6.00%
- Reading proficiency
- 42% ▼ -3.00%
- Median HH income
- $41,809
- Composite
- 28.68/100
- National rank
- #6694
- State rank
- #312 of 540 in MI
Livability — Menominee
- Score
- 71/100
- State rank
- #282
- US rank
- #6909
Category grades
Schools grade is shown separately in the Schools card above.
Census & demographics
- Census place
- Menominee, MI
- Population (ZIP)
- 11,870
Population outlook (Menominee County) Hauer SSP2
- Today (2025)
- 22,668 people
- By 2030
- 21,986 · -3.0%
- By 2040
- 20,196 · -10.9%
- By 2050
- 18,335 · -19.1%
- By 2075
- 14,771 · -34.8%
- By 2100
- 10,999 · -51.5%
Race, ethnicity, and origin ACS 2023
- Neighborhood character
- Predominantly White (95%)
- Race & ethnicity
- White 95% Two or more races 4% Hispanic / Latino 2%
- Common ancestry
- Lithuanian 8% Romanian 7% Portuguese 4%
- Foreign-born
- 2% · Canada
- Languages at home
- 99% English-only · French/Haitian/Cajun 1%
Political lean MEDSL · Menominee
- 2024 margin
- Solid R (+33.6) · D 32.6% · R 66.2% · Other 1.2%
- 2008→2024 swing
- -43.8pp toward R · 2008: 10.2pp · 2024: -33.6pp
- All cycles
- 2024: R+33.6 2020: R+30.1 2016: R+29.4 2012: R+2.9 2008: D+10.2
Not yet ingested
- Civics
- —
Market trends
- HPI YoY
- ▼ -94.34%
- Current HPI
- 206.2461
- Rent YoY
- —
- Metro
- —
- State GDP YoY
- ▲ 1.37%
- F500 in state
- 28
Industry mix (Fortune 500 HQ in MI)
| Industry | F500 HQs | Revenue |
|---|---|---|
| Automotive Parts | 3 | $48B |
|
||
| Automotive | 2 | $372B |
|
||
| Chemicals | 1 | $45B |
|
||
| Automotive Retail | 1 | $29B |
|
||
| Healthcare / Medical Devices | 1 | $23B |
|
||
| Automotive Technology | 1 | $20B |
|
||
Price history
2 events — show timeline
- 2026-04-03 Pending — METROMLS
- 2026-03-21 Listed $245,000 METROMLS
Cash-flow waterfall
monthlySold comps — $/sqft
last 12 mo · ≤1 miLoading sold comps…