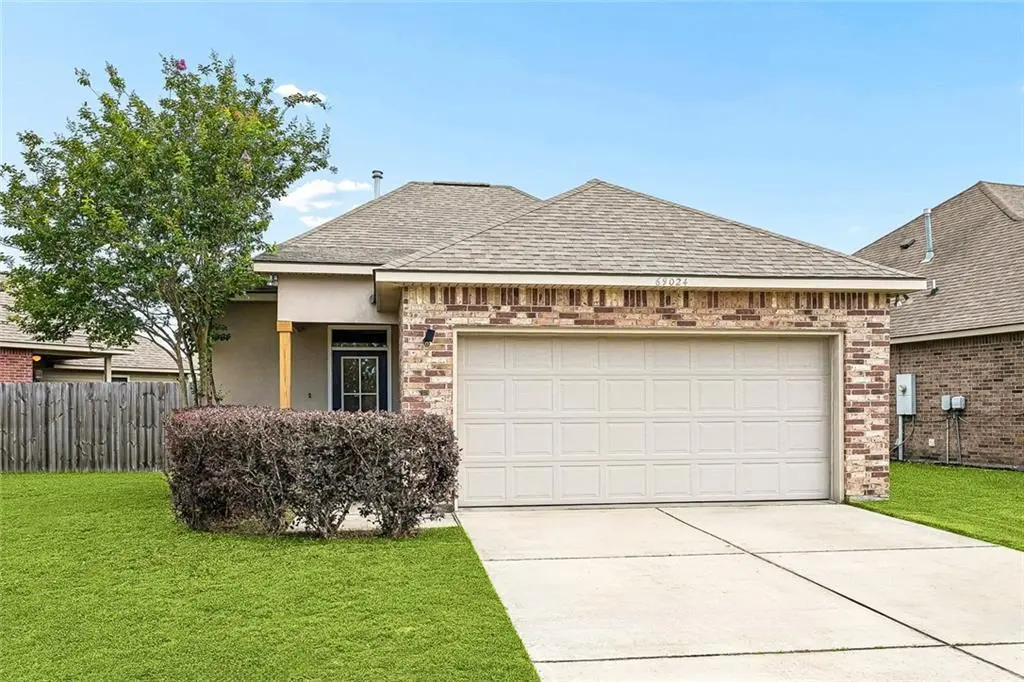
69024 Taverny Ct · Madisonville, LA
Flood risk 7/10 · Major
- FEMA flood zone
- X
- Chance of flooding over 30 yrs
- 0.99%
- Est. flood insurance / yr
- $507 – $1,088
Fire risk 5/10 · Moderate
- Est. fire insurance / yr
- $1,269 – $2,357
Heat risk 9/10 · Severe
- Hot days now (above 109°F)
- 7 days/yr
- Hot days in 30 yrs
- 23 days/yr
Wind risk 9/10 · Severe
- Chance of severe wind over 30 yrs
- 99.0%
Air-quality risk 2/10 · Minimal
- Unhealthy air days now
- 0 days/yr
- Unhealthy air days in 30 yrs
- 1 days/yr
Risk factors via First Street. Map © Google.
Why this score? — see what drove the C- grade
The composite is a weighted blend of 9 inputs, each scored 0–100. Each bar is that input's sub-score; the figure is the points it added to the 100-point composite (weight × sub-score).
- Cash flow +20.9/30.0
- ARV discount +8.2/15.0
- DSCR +6.7/10.0
- 1% rule +4.8/10.0
- Schools +4.3/10.0
- Livability +4.0/5.0
- Rent growth +2.5/5.0
- Condition / age +2.5/5.0
- Appreciation +0.0/10.0
$249,000
🖨 Deal sheet 📄 Offer letter ✓ Due diligence
Listing remarks MLS
Precious and pristine 3BR/2BA home offering 1,602 living sq ft and an open-concept floor plan. Bright living spaces flow seamlessly into the kitchen and dining areas, creating the perfect setting for everyday living and entertaining. Kitchen offers granite countertops, generous cabinet space, and seating at both counter AND island. Split-bedroom layout, spacious primary suite, abundant natural light, and move-in-ready condition throughout. Rear yard opens to shared greenspace. Generous driveway parking and attached 2-car garage. Beautifully maintained inside and out!
Key facts
- 5,732 sq ft lot
- Garage
- Built 2017
Property features AI
Finance
- HOA & community: Homeowners association with an annual fee of $275
Exterior
- Parking: Attached garage with two spaces
- Utilities: Public water; Public sewer
- Home design: Single-story home; Shingle roof; Excellent condition; Built with brick and vinyl siding; Slab foundation
- Construction: Brick and vinyl siding construction; Shingle roof; Slab foundation
- Exterior features: City lot; Rectangular lot; Lot dimensions approximately 68 x 122 x 122 x 13
Interior
- Bedrooms: Total of 6 rooms (includes bedrooms and living spaces)
- Bathrooms: 2 full bathrooms
- Heating & cooling: Central heating; Central air conditioning
- Interior features: Gas fireplace
Neighborhood map
What this means for you Summary
Snapshot
- This is a 3-bed/2.0-bath single-family listed at $249k.
Deal economics
- At list price, monthly cash flow is $281 ($3k/yr) — positive.
- The deal already cash-flows at list — no discount required.
- To meet the 1% rule (rent ≥ 1% of price), the offer needs to be $245k (1.5% below list).
- Recommended offer: $245k (1.5% below list) — sets the bar for 1% rule.
- Cap rate 8.0% vs local median 4.6% in Madisonville — top-decile yield for the area; either an underpriced asset or a hidden risk that comps aren't pricing in. Stress-test before assuming the spread holds.
Location & tenants
- Location reads 79/100 on livability (#5 in LA, #2,302 nationally) — a middle-class / working-renter tenant base. Strengths: schools A+, crime A+, employment A+; Watch: amenities F, commute F.
- St. Tammany Parish (suburban): math 43% / reading 55% proficiency, ranked #11 of 98 in LA (top 11%) — families likely to look elsewhere, expect single-tenant / working-renter base with shorter leases.
- Market conditions: 252 active listings in the ZIP; 3 comparable units currently listed for rent nearby; rentals at typical pace (median 24d on market — plan ~3-4 weeks tenant-placement turnaround); high-income renter base; 1,064 units permitted in St. Tammany Parish in 2024 (0 in 5+ unit buildings).
Forward outlook
- Local home prices are declining (-3.0%/yr); year-one equity from $2k of loan paydown is wiped out by about $7k of value loss. Plan a longer hold.
- St. Tammany County population projected at +27% by 2050 — long-run rental-demand tailwind backs the buy-and-hold thesis.
Negotiation context
- Only 9 days on market — expect competitive offers; lowballing is unlikely to land.
- 4 sale attempts since 9y ago with the ask held roughly flat each time — persistent listings suggest the price (not the market) is what's stuck; bring a comps-based counter.
- Current owner paid $183k; 36% above their basis — modest negotiation headroom, anchor on the comps not their cost.
Risks & watch-outs
- Watch-outs: flood insurance adds $66/mo.
- Climate carrying-cost: major flood risk; severe wind risk, 99% chance of damaging wind over 30y; moderate wildfire risk; extreme-heat days projected 7→23/yr by 2055 (HVAC capex compounding) — expect insurance premiums to compound above CPI over the hold.
Questions for the listing agent
- What's the actual annual flood-insurance premium (NFIP or private), and is the property in a SFHA with mandatory coverage?
- What does the HOA fee cover, when was the last increase, and are there any pending special assessments or reserve-fund shortfalls?
- Is there a deadline driving the sale (1031 exchange, divorce, estate, relocation)? That informs how much negotiation room exists.
- Schools are A-rated — typically a magnet for longer-tenancy family renters. What's the average tenant stay here, and is there a school-zone premium baked into asking?
- What's the average days-on-market for RENTAL listings here right now (not sales)? A rising rental-DOM trend means longer vacancies and softer asking-rent achievability than the comps imply.
- What's the recent tenant-quality profile in this submarket — average credit score on applications, eviction rate, late-payment / NSF rate, and stable-employment percentage? A property-management company in the area should have these aggregated.
- How much new for-sale + rental construction is in the pipeline within 1–3 miles? Heavy new supply typically softens prices + rents 12–24 months out; constrained supply supports both.
Investment metrics
- 1% rule
- 0.98% ✗
- Cap rate
- 7.97%
- Cash-on-cash
- 5.98%
- DSCR
- 1.27
- GRM
- 8.5
CMA / ARV
- ARV (on-the-fly)
- $253,116
- Comps found
- 12
Show comp detail 12 sales within ~0.75 mi
| Address | Dist | Beds/Ba | Sqft | Sold | Price | $/sf | Match |
|---|---|---|---|---|---|---|---|
| 41958 Snowball Cir | 0.27mi | 3/2.0 | 1,617 (+1%) | 3mo | $229,000 | $142 | 84 |
| 69261 Taverny Ct | 0.15mi | 3/2.0 | 1,732 (+8%) | 0mo | $286,000 | $165 | 79 |
| 70048 Hirson Ct | 0.25mi | 3/2.0 | 1,689 (+5%) | 0mo | $267,000 | $158 | 79 |
| 28507 Rosedust Ln | 0.26mi | 3/2.0 | 1,683 (+5%) | 2mo | $238,000 | $141 | 78 |
| 10136 Cesson Ct | 0.41mi | 3/2.0 | 1,615 (+1%) | 3mo | $271,000 | $168 | 77 |
| 41173 Snowball Cir | 0.54mi | 3/2.0 | 1,585 (-1%) | 0mo | $215,000 | $136 | 73 |
| 69484 Taverny Ct | 0.24mi | 3/2.0 | 1,747 (+9%) | 4mo | $280,000 | $160 | 71 |
| 69628 Taverny Ct | 0.43mi | 3/2.0 | 1,715 (+7%) | 4mo | $272,000 | $159 | 65 |
| 9 Adrienne St | 0.35mi | 2/2.0 (-1) | 1,437 (-10%) | 2mo | $175,000 | $122 | 60 |
| 28515 Vintage Ln | 0.62mi | 3/2.0 | 1,476 (-8%) | 4mo | $224,000 | $152 | 55 |
| 46 Mary St | 0.68mi | 3/2.0 | 1,735 (+8%) | 2mo | $290,000 | $167 | 53 |
| 28465 Plum St | 0.74mi | 3/2.0 | 1,438 (-10%) | 3mo | $203,680 | $142 | 46 |
Match score weights: distance 35% · size 25% · config 20% · recency 20%. Top-matched comps best support the ARV.
Projected returns pro-forma
-3.0% appreciation · 3.0% rent growth · sell at horizon
- IRR
- -8.8%
- Equity multiple
- 0.68×
- Total profit
- $-22,451
- Equity at exit
- $37,127
- IRR
- 0.7%
- Equity multiple
- 1.05×
- Total profit
- $3,489
- Equity at exit
- $21,529
Cash invested: $69,720 (down + closing). Projections, not guarantees.
Landlord ↔ Tenant lean methodology
- Overall (STATE)
- 90 Strongly Landlord-Friendly
- State Louisiana
- 90 Strongly Landlord-Friendly · R+12
- County
- — inherits STATE
- City
- — inherits STATE
ZIP-level market 70447
- Home prices YoY
- -28.1%
- Active inventory
- 252
- Price-to-rent
- 8.5×
Monthly cashflow live
- Estimated rent
- $2,452 medium interval (Pro) →
- Mortgage (P&I)
- −$1,306
- Tax from tax record
- −$157 /mo · $1,881/yr
- Insurance
- −$104
- Flood insurance flood zone
- −$66 /mo · $798/yr
- HOA
- −$23
- Vacancy / Maint / Mgmt
- −$515
- Net cashflow
- $281
Break-even live
UW: 25.0% down · 7.5% · 30yr · 1.5% tax · 5.0% vac · 8.0% maint · 8.0% mgmt
Financing live
Cash to close
- Down payment
- $62,250
- Closing costs
- $7,470
- Reserves months
- —
- Total cash needed
- —
Loan-product check · same deal, 3 products live
Conventional
25% down · 7.5% · 30yr
- Down + closing
- —
- Monthly P&I
- —
- Monthly cashflow
- —
- DSCR
- —
- Eligible?
- —
Personal DTI + credit; lowest rate.
DSCR
20% down · 8.5% · 30yr
- Down + closing
- —
- Monthly P&I
- —
- Monthly cashflow
- —
- DSCR
- —
- Eligible?
- —
No personal income docs; deal must DSCR.
Hard money
10% down · 12.0% · 12mo
- Down + closing
- —
- Monthly P&I
- —
- Monthly cashflow
- —
- DSCR
- —
- Eligible?
- —
Short-term bridge; refi at stabilization.
Rent comps 3 comps
| Address | Beds | Baths | Sqft | Rent | $/sqft | DOM | Units | Dist |
|---|---|---|---|---|---|---|---|---|
| 69332 Taverny Ct Madisonville, LA | 3.0 | 2.0 | 2000 | $2,250 | $1.12 | 43d | 1 | 0.14mi |
| 400 Walter Ln Madisonville, LA | 3.0 | 2.5 | 2217 | $2,400 | $1.08 | 23d | 1 | 1.20mi |
| 116 Fayedaye Dr Madisonville, LA | 3.0 | 2.0 | 1450 | $2,100 | $1.45 | 21d | 1 | 1.48mi |
HOA detail
- Monthly dues
- $23 · $276/yr
Listing history 7 events
-
2026-06-18days on market $249,000 Active 9 DOM
-
2026-06-17days on market $249,000 Active 8 DOM
-
2026-06-16days on market $249,000 Active 7 DOM
-
2026-06-15days on market $249,000 Active 6 DOM
-
2026-06-13days on market $249,000 Active 4 DOM
-
2026-06-10remarks 573-char remark
-
2026-06-10$249,000 Active 1 DOM
ⓘ Source: listings_history table (triggers on properties + properties_extension) + one-shot
backfill from property_details.listing_events for pre-trigger history.
Tax reassessment forecast LA · Resets to sale price
- Current annual tax
- $1,881 · $157/mo
- Projected year-2 tax
- $1,881 · $157/mo
- Expected delta
- $0/yr ($0/mo · 0.0%)
ⓘ Screening estimate from a state-policy table — verify with the county assessor before closing.
Climate risk First Street
- Flood 7/10 Severe FEMA zone X · 99% chance over 30 yrs
- Wildfire 5/10 Major
- Heat 9/10 Extreme 7 d/yr ≥109°F today · 23 d/yr by 30 yrs out
- Wind 9/10 Extreme 99% chance of damaging wind over 30 yrs
- Air quality 2/10 Low 0 unhealthy d/yr today · 1 by 30 yrs out
Nearby sold comps map
Loading sold comps map…
Walkable amenities ~0.75 mi
Loading nearby amenities…
Taxation est. · year 1
- Rental income
- $29,420
- − Mortgage interest
- −$13,948
- − Property taxes
- −$1,881
- − Insurance
- −$2,042
- − Repairs & maintenance
- −$2,354
- − Management
- −$2,354
- − HOA
- −$276
- − Depreciation
- −$7,244
- Taxable loss
- −$678
- Est. tax savings @ 24.0%
- +$163
- After-tax cash flow
- $3,536/yr
For passive investors: Depreciation is non-cash, so a rental often shows a tax loss while cash-flowing — sheltering income. Rental losses are passive: they offset passive income freely, and up to $25,000/yr can offset ordinary (W-2) income if you actively participate and your MAGI is under $100k (phasing out to $0 by $150k); unused losses carry forward. On sale, claimed depreciation is recaptured at up to 25%, and gains may owe capital-gains tax (a 1031 exchange can defer both). Figures are a year-1 estimate at your 24.0% rate — not tax advice; consult a CPA.
Schools (NCES district)
- District
- St. Tammany Parish
- NCES district ID
- 2201650
- Math proficiency
- 43% ▼ -32.00%
- Reading proficiency
- 55% ▼ -26.00%
- Median HH income
- $61,752
- Composite
- 43.04/100
- National rank
- #3098
- State rank
- #11 of 98 in LA
Livability — Madisonville
- Score
- 79/100
- State rank
- #5
- US rank
- #2302
Category grades
Schools grade is shown separately in the Schools card above.
Census & demographics
- County
- Saint Tammany Parish · 228,296 people
- City population
- 17,897
- Metro
- New Orleans-Metairie, LA
- Population (ZIP)
- 17,897
- Household income
- $122,574
- Rent vs Own
- Severe rent burden
- 47.0
Population outlook (St. Tammany County) Hauer SSP2
- Today (2025)
- 286,725 people
- By 2030
- 304,175 · +6.1%
- By 2040
- 336,203 · +17.3%
- By 2050
- 364,590 · +27.2%
- By 2075
- 433,362 · +51.1%
- By 2100
- 470,333 · +64.0%
Race, ethnicity, and origin ACS 2023
- Neighborhood character
- Predominantly White (84%)
- Race & ethnicity
- White 84% Two or more races 7% Hispanic / Latino 6% Black 2%
- Hispanic origin (detail)
- Mexican 1%
- Common ancestry
- Lithuanian 19% Slovak 3% Romanian 2%
- Foreign-born
- 5% · Canada
- Languages at home
- 97% English-only · Spanish 1% Other Asian/Pacific 1% Russian/Polish/Slavic 1%
Political lean MEDSL · St. Tammany
- 2024 margin
- Solid R (+43.8) · D 27.3% · R 71.1% · Other 1.6%
- 2008→2024 swing
- +9.6pp toward D · 2008: -53.4pp · 2024: -43.8pp
- All cycles
- 2024: R+43.8 2020: R+44.2 2016: R+50.8 2012: R+52.2 2008: R+53.4
Not yet ingested
- Civics
- —
Market trends
- HPI YoY
- ▼ -68.07%
- Current HPI
- 174.0804
- Rent YoY
- —
- Metro
- New Orleans-Metairie, LA
- State GDP YoY
- ▲ 3.29%
- F500 in state
- 10
Industry mix (Fortune 500 HQ in LA)
| Industry | F500 HQs | Revenue |
|---|---|---|
| Telecommunications | 2 | $23B |
|
||
| Utilities | 1 | $12B |
|
||
| Wholesale / Distribution | 1 | $5B |
|
||
| Advertising | 1 | $2B |
|
||
Price history
+36.1% since first listed6 events — show timeline
- 2026-06-08 Listed $249,000 AcadianaMLS
- 2026-06-08 Listed $249,000 GSREIN
- 2017-07-27 Sold (MLS) $182,900 GSREIN
- 2017-01-17 Pending — GSREIN
- 2017-01-05 Listed $182,900 GSREIN
- 2017-01-05 Listed $182,900 AcadianaMLS
Property tax history
+26.7%/yrLatest (2025): $1,881 · -2.4% YoY. Source: county tax records.
Cash-flow waterfall
monthlySold comps — $/sqft
last 12 mo · ≤1 miLoading sold comps…