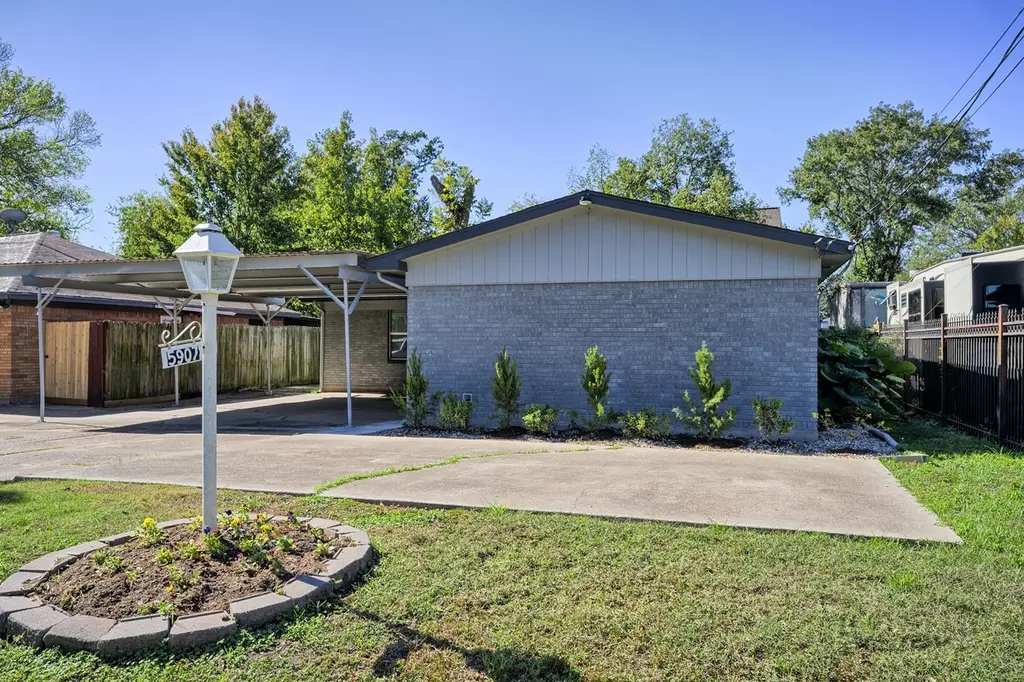
5907 Nancy Ann St · Houston, TX
Flood risk 1/10 · Minimal
- FEMA flood zone
- X (unshaded)
- Chance of flooding over 30 yrs
- 0.0%
- Est. flood insurance / yr
- $507 – $1,088
Fire risk 1/10 · Minimal
- Est. fire insurance / yr
- $1,222 – $2,270
Heat risk 9/10 · Severe
- Hot days now (above 109°F)
- 7 days/yr
- Hot days in 30 yrs
- 24 days/yr
Wind risk 9/10 · Severe
- Chance of severe wind over 30 yrs
- 99.0%
Air-quality risk 3/10 · Minor
- Unhealthy air days now
- 2 days/yr
- Unhealthy air days in 30 yrs
- 3 days/yr
Risk factors via First Street. Map © Google.
Why this score? — see what drove the D grade
The composite is a weighted blend of 9 inputs, each scored 0–100. Each bar is that input's sub-score; the figure is the points it added to the 100-point composite (weight × sub-score).
- ARV discount +15.0/15.0
- Cash flow +10.4/30.0
- 1% rule +4.1/10.0
- Livability +3.7/5.0
- DSCR +3.0/10.0
- Rent growth +2.7/5.0
- Schools +2.7/10.0
- Condition / age +2.5/5.0
- Appreciation +0.0/10.0
$270,000
🖨 Deal sheet (PDF) 📄 Offer letter ✓ Due diligence
Listing remarks MLS
Welcome to this charming and move-in-ready home, thoughtfully updated for comfort and peace of mind. Featuring a new roof, fresh interior and exterior paint, and updated flooring and windows, this home shines inside and out. Enjoy the security of a lifetime transferable foundation warranty and the reassurance of no flooding history. Located just minutes from Downtown Houston and one block from the METRO Rail, this home offers unbeatable convenience with easy commuting and access to all the city has to offer. With no HOA and low taxes, you’ll appreciate the flexibility and affordability that comes with this property. The enclosed patio is a true standout, complete with a custom BBQ smoker—perfect for weekend gatherings and year-round entertaining. The oversized backyard provides plenty of space to relax, garden, or create your ideal outdoor retreat. Packed with updates, charm, and location benefits, this home is a must-see. Schedule your showing today!
Key facts
- 7,866 sq ft lot
- 2 parking spots
- Built 1957
Neighborhood map
What this means for you Summary
Snapshot
- This is a 3-bed/1.5-bath single-family listed at $270k.
Deal economics
- At list price, monthly cash flow is $-145 ($-2k/yr) — negative.
- To cash-flow at today's rent, offer at most $244k (9.5% below list).
- To meet the 1% rule (rent ≥ 1% of price), the offer needs to be $246k (8.8% below list).
- Recommended offer: $238k (12.0% below list) — sets the bar for market timing.
- Cap rate 5.6% vs local median 3.2% in Houston — top-decile yield for the area; either an underpriced asset or a hidden risk that comps aren't pricing in. Stress-test before assuming the spread holds.
Location & tenants
- Location reads 74/100 on livability (#184 in TX, #4,771 nationally) — a middle-class / working-renter tenant base. Strengths: amenities A+, cost of living A+, housing A+; Watch: crime F.
- Houston ISD (urban): math 27% / reading 35% proficiency, ranked #593 of 826 in TX (top 72%) — families likely to look elsewhere, expect single-tenant / working-renter base with shorter leases; 71% free/reduced lunch — lower-income household profile, screen leases tightly.
- Zoned schools: Jefferson El (math 12% / reading 22%, grade F, #3,836 of 4,322 statewide, top 91%, 344 students, 95% FRL); Marshall Middle (math 14% / reading 22%, grade F, #1,491 of 1,662 statewide, top 91%, 607 students, 97% FRL); Northside H S (math 15% / reading 26%, grade F, #1,389 of 1,632 statewide, top 86%, 1,168 students, 94% FRL) — zoned schools average 95% FRL vs 71% district-wide (24 pts higher); higher-poverty schools than district average — tighter screening recommended.
- Zoned-school proficiency averages 18% at this address vs 31% district-wide (-12 pts) — the specific schools serving this property underperform the Houston ISD average; the district grade overstates school quality for this exact location.
- Market conditions: Rents flat; 605 active listings in the ZIP; 31 comparable units currently listed for rent nearby; rentals lingering (median 46d on market — plan ~5-8 weeks vacancy on turnover, expect pricing pressure); 52% of comp listings sitting > 30 days — soft ceiling on asking rent; solid renter incomes; 29,883 units permitted in Harris County in 2024 (8,621 in 5+ unit buildings).
- This rent runs 36% of the median local income ($83k/yr) — at the standard rent-burdened threshold; future hikes will face affordability resistance.
Forward outlook
- Local home prices are declining (-3.0%/yr); year-one equity from $2k of loan paydown is wiped out by about $8k of value loss. Plan a longer hold.
- Harris County population projected at +47% by 2050 — long-run rental-demand tailwind backs the buy-and-hold thesis.
Negotiation context
- It's been on market 209 days — a 12% lower offer ($238k) is reasonable based on typical stale-listing flexibility.
- 6 sale attempts since 20y ago; this cycle's ask is 12173% above the opening price — seller raised mid-cycle; expect resistance to lowballs.
Risks & watch-outs
- Watch-outs: property tax is 2.5% of price; built in 1957 — expect roof / HVAC / electrical / plumbing capex.
- Climate carrying-cost: severe wind risk, 99% chance of damaging wind over 30y; extreme-heat days projected 7→24/yr by 2055 (HVAC capex compounding) — expect insurance premiums to compound above CPI over the hold.
Questions for the listing agent
- What do current leases actually rent for vs. the listed asking? Can we see a recent rent roll and the last 12 months of T-12 income?
- It's been on market 209 days. Have you received any prior offers? Is the seller open to a 12% concession, seller financing, or rate buy-down credit?
- Built in 1957 — when were the roof, HVAC, electrical panel, plumbing, and water heater last replaced?
- Property tax is high relative to price — has the assessment been appealed recently, and will the sale trigger a re-assessment?
- Why hasn't it sold? Are there any deal-killer items the seller is aware of (foundation, flood, title, zoning, code violations)?
- Is there a deadline driving the sale (1031 exchange, divorce, estate, relocation)? That informs how much negotiation room exists.
- Schools are D-rated, which usually means shorter tenancies and higher turnover. Who's the typical renter profile here, and what's been the actual vacancy rate?
- Crime grade is F in this area — have there been break-ins, vandalism, or insurance claims at this property in the last 3 years? What carrier currently insures it and at what premium?
- The area grade is low — what's the realistic commute time and amenity access for the typical tenant pool here? Any planned neighborhood developments (good or bad) we should know about?
- What's the average days-on-market for RENTAL listings here right now (not sales)? A rising rental-DOM trend means longer vacancies and softer asking-rent achievability than the comps imply.
- What's the recent tenant-quality profile in this submarket — average credit score on applications, eviction rate, late-payment / NSF rate, and stable-employment percentage? A property-management company in the area should have these aggregated.
- How much new for-sale + rental construction is in the pipeline within 1–3 miles? Heavy new supply typically softens prices + rents 12–24 months out; constrained supply supports both.
Investment metrics
- 1% rule
- 0.91% ✗
- Cap rate
- 5.65%
- Cash-on-cash
- -2.30%
- DSCR
- 0.90
- GRM
- 9.1
CMA / ARV
- ARV (median comp)
- $351,717
- List price
- $270,000
- Delta
- -23.23%
- Verdict
- UNDERPRICED
- Comps
- 20 within 1.0 mi
Show comp detail 12 sales within ~0.75 mi
| Address | Dist | Beds/Ba | Sqft | Sold | Price | $/sf | Match |
|---|---|---|---|---|---|---|---|
| 304 Woodard St | 0.24mi | 3/2.0 | 1,488 (-6%) | 0mo | $435,000 | $292 | 76 |
| 1737 Tabor St | 0.45mi | 3/2.0 | 1,603 (+1%) | 3mo | $440,000 | $274 | 73 |
| 1833 Tabor St | 0.39mi | 3/2.0 | 1,662 (+5%) | 2mo | $525,000 | $316 | 70 |
| 516 Eleanor St | 0.40mi | 4/2.0 (+1) | 1,635 (+3%) | 4mo | $429,990 | $263 | 66 |
| 505 Woodard St | 0.37mi | 3/2.0 | 1,466 (-8%) | 4mo | $495,000 | $338 | 65 |
| 806 English St | 0.71mi | 3/2.0 | 1,586 (0%) | 2mo | $650,000 | $410 | 64 |
| 1616 Tabor St | 0.57mi | 3/2.0 | 1,482 (-7%) | 2mo | $399,900 | $270 | 59 |
| 316 English St | 0.41mi | 3/2.5 | 1,746 (+10%) | 4mo | $799,900 | $458 | 57 |
| 406 Gale St | 0.56mi | 4/2.0 (+1) | 1,511 (-5%) | 4mo | $349,900 | $232 | 56 |
| 805 Sue St | 0.71mi | 2/2.0 (-1) | 1,640 (+3%) | 0mo | $449,000 | $274 | 54 |
| 500 Fairbanks St | 0.38mi | 2/1.0 (-1) | 1,361 (-14%) | 1mo | $775,000 | $569 | 51 |
| 1410 Walton St | 0.63mi | 3/2.0 | 1,381 (-13%) | 2mo | $335,000 | $243 | 46 |
Match score weights: distance 35% · size 25% · config 20% · recency 20%. Top-matched comps best support the ARV.
Projected returns pro-forma
-3.0% appreciation · 0.84% rent growth · sell at horizon
- IRR
- -22.8%
- Equity multiple
- 0.23×
- Total profit
- $-58,050
- Equity at exit
- $40,258
- IRR
- -24.8%
- Equity multiple
- -0.09×
- Total profit
- $-82,319
- Equity at exit
- $23,345
Cash invested: $75,600 (down + closing). Projections, not guarantees.
Landlord ↔ Tenant lean methodology
- Overall (STATE)
- 87 Strongly Landlord-Friendly
- State Texas
- 87 Strongly Landlord-Friendly · R+5
- County
- — inherits STATE
- City
- — inherits STATE
ZIP-level market 77009
- Rents YoY
- 0.8%
- Active inventory
- 605
- Price-to-rent
- 9.1×
Monthly cashflow live
- Estimated rent
- $2,464 high interval (Pro) →
- Mortgage (P&I)
- −$1,416
- Tax from tax record
- −$563 /mo · $6,754/yr
- Insurance
- −$112
- HOA
- −$0
- Vacancy / Maint / Mgmt
- −$517
- Net cashflow
- $-145
Break-even live
Sensitivity live
| Price | -10% $8 | -5% $-69 | +0% $-145 | +5% $-221 | +10% $-298 |
|---|---|---|---|---|---|
| Rent | -10% $-340 | -5% $-242 | +0% $-145 | +5% $-48 | +10% $50 |
| Rate | -1.0pp $-9 | -0.5pp $-76 | base $-145 | +0.5pp $-215 | +1.0pp $-286 |
UW: 25.0% down · 7.5% · 30yr · 1.5% tax · 5.0% vac · 8.0% maint · 8.0% mgmt
Financing live
Cash to close
- Down payment
- $67,500
- Closing costs
- $8,100
- Reserves months
- —
- Total cash needed
- —
Loan-product check · same deal, 3 products live
Conventional
25% down · 7.5% · 30yr
- Down + closing
- —
- Monthly P&I
- —
- Monthly cashflow
- —
- DSCR
- —
- Eligible?
- —
Personal DTI + credit; lowest rate.
DSCR
20% down · 8.5% · 30yr
- Down + closing
- —
- Monthly P&I
- —
- Monthly cashflow
- —
- DSCR
- —
- Eligible?
- —
No personal income docs; deal must DSCR.
Hard money
10% down · 12.0% · 12mo
- Down + closing
- —
- Monthly P&I
- —
- Monthly cashflow
- —
- DSCR
- —
- Eligible?
- —
Short-term bridge; refi at stabilization.
Rent comps 31 comps
| Address | Beds | Baths | Sqft | Rent | $/sqft | DOM | Units | Dist |
|---|---|---|---|---|---|---|---|---|
| 1690 North Loop Houston, TX | 1.0–2.0 | 1.0–2.0 | 876 | $2,269 | $2.59 | 0d | 40 | 0.42mi |
| 207 Lindale St Unit 1316403P Houston, TX | 2.0 | 1.0 | 1119 | $3,187 | $2.85 | 1d | 1 | 0.43mi |
| 1617 Enid St Houston, TX | 1.0–2.0 | 1.0–2.0 | 974 | $2,417 | $2.48 | 0d | 54 | 0.50mi |
| 705 Link Rd Houston, TX | 3.0 | 3.5 | 1850 | $2,600 | $1.41 | 1d | 1 | 0.58mi |
| 705 Link Rd Houston, TX | 3.0 | 3.5 | 1850 | $2,600 | $1.41 | 9d | 1 | 0.58mi |
| 1420 E 31st St Houston, TX | 3.0 | 2.5 | 1790 | $2,600 | $1.45 | 26d | 1 | 0.59mi |
| 1420 E 31st St Houston, TX | 3.0 | 2.5 | 1980 | $2,600 | $1.31 | 45d | 1 | 0.59mi |
| 4605 Fisk St Houston, TX | 3.0 | 2.0 | 1628 | $3,000 | $1.84 | 45d | 1 | 0.71mi |
| 770 Strawberry Pines Ct Houston, TX | 2.0–3.0 | 2.5 | 1422 | $2,735 | $1.92 | 3d | 12 | 0.71mi |
| 1204 E 29th St Unit 1018984P Houston, TX | 3.0 | 2.5 | 2142 | $10,290 | $4.80 | 45d | 1 | 0.75mi |
| 1204 E 29th St Houston, TX | 3.0 | 2.5 | 2151 | $8,750 | $4.07 | 45d | 1 | 0.75mi |
| 6918 Irvington Blvd Houston, TX | 2.0 | 2.0 | 1100 | $1,550 | $1.41 | 45d | 1 | 0.94mi |
| 1416 Fairbanks St Houston, TX | 4.0 | 3.5 | 1888 | $1,899 | $1.01 | 9d | 1 | 1.03mi |
| 835E Dorchester St Unit 1273076P Houston, TX | 3.0 | 2.0 | 1528 | $3,079 | $2.02 | 1d | 1 | 1.04mi |
| 823 North Loop Unit A Houston, TX | 3.0 | 2.0 | 1532 | $2,500 | $1.63 | 26d | 1 | 1.05mi |
| 1141 Louise St Houston, TX | 4.0 | 4.0 | 2228 | $4,000 | $1.80 | 45d | 1 | 1.12mi |
| 1039 Hillstar St Houston, TX | 3.0 | 2.5 | 1780 | $2,750 | $1.54 | 13d | 1 | 1.16mi |
| 4601 N Main St Houston, TX | 2.0 | 2.0 | 1058 | $2,095 | $1.98 | 26d | 1 | 1.22mi |
| 1127 Walling St Unit R Houston, TX | 2.0 | 2.0 | 1400 | $2,295 | $1.64 | 45d | 1 | 1.25mi |
| 3514 Ajax St Unit 1047956P Houston, TX | 3.0 | 2.5 | 1689 | $3,114 | $1.84 | 9d | 1 | 1.25mi |
| 401 Walton St Houston, TX | 3.0 | 2.0 | 2112 | $2,500 | $1.18 | 16d | 1 | 1.27mi |
| 1524 Evelyn St Houston, TX | 3.0 | 2.5 | 1804 | $2,800 | $1.55 | 45d | 1 | 1.29mi |
| 4132 Europa St Houston, TX | 3.0 | 2.0 | 1259 | $1,430 | $1.14 | 14d | 1 | 1.31mi |
| 811 E 42nd St Houston, TX | 4.0 | 2.0 | 1213 | $1,600 | $1.32 | 45d | 1 | 1.42mi |
| 538 E 38th St Houston, TX | 3.0 | 2.5 | 1521 | $2,300 | $1.51 | 45d | 1 | 1.42mi |
| 611 E 39th St Houston, TX | 2.0 | 2.0 | 1326 | $2,099 | $1.58 | 45d | 1 | 1.43mi |
| 725 Peddie St Unit 1257756P Houston, TX | 2.0 | 1.0 | 1496 | $5,083 | $3.40 | 45d | 1 | 1.43mi |
| 322 E 33rd St Houston, TX | 2.0 | 1.0 | 1100 | $1,500 | $1.36 | 45d | 1 | 1.46mi |
| 5124 Gold St Unit B Houston, TX | 3.0 | 2.5 | 1650 | $1,895 | $1.15 | 45d | 1 | 1.46mi |
| 914 Bunton St Houston, TX | 3.0 | 2.0 | 1389 | $1,950 | $1.40 | 45d | 1 | 1.47mi |
| 604 E 17th St Houston, TX | 3.0 | 2.0 | 1724 | $3,500 | $2.03 | 45d | 1 | 1.48mi |
Listing history 32 events
-
2026-06-21days on market $270,000 Active 209 DOM
-
2026-06-18days on market $270,000 Active 206 DOM
-
2026-06-17days on market $270,000 Active 205 DOM
-
2026-06-16days on market $270,000 Active 204 DOM
-
2026-06-15days on market $270,000 Active 203 DOM
-
2026-06-13days on market $270,000 Active 201 DOM
-
2026-06-10days on market $270,000 Active 197 DOM
-
2026-06-08days on market $270,000 Active 196 DOM
-
2026-06-07days on market $270,000 Active 195 DOM
-
2026-06-04days on market $270,000 Active 192 DOM
-
2026-06-01days on market $270,000 Active 189 DOM
-
2026-05-31days on market $270,000 Active 188 DOM
-
2026-05-20price $2,050
-
2026-04-28price $270,000 980-char remark
Show marketing remark (980 chars)
Welcome to this charming and move-in-ready home, thoughtfully updated for comfort and peace of mind. Featuring a new roof, fresh interior and exterior paint, and updated flooring and windows, this home shines inside and out. Enjoy the security of a lifetime transferable foundation warranty and the reassurance of no flooding history. Located just minutes from Downtown Houston and one block from the METRO Rail, this home offers unbeatable convenience with easy commuting and access to all the city has to offer. With no HOA and low taxes, you’ll appreciate the flexibility and affordability that comes with this property. The enclosed patio is a true standout, complete with a custom BBQ smoker—perfect for weekend gatherings and year-round entertaining. The oversized backyard provides plenty of space to relax, garden, or create your ideal outdoor retreat. Packed with updates, charm, and location benefits, this home is a must-see. Schedule your showing today!
-
2026-04-12$2,200
-
2026-02-12price $285,000 980-char remark
Show marketing remark (980 chars)
Welcome to this charming and move-in-ready home, thoughtfully updated for comfort and peace of mind. Featuring a new roof, fresh interior and exterior paint, and updated flooring and windows, this home shines inside and out. Enjoy the security of a lifetime transferable foundation warranty and the reassurance of no flooding history. Located just minutes from Downtown Houston and one block from the METRO Rail, this home offers unbeatable convenience with easy commuting and access to all the city has to offer. With no HOA and low taxes, you’ll appreciate the flexibility and affordability that comes with this property. The enclosed patio is a true standout, complete with a custom BBQ smoker—perfect for weekend gatherings and year-round entertaining. The oversized backyard provides plenty of space to relax, garden, or create your ideal outdoor retreat. Packed with updates, charm, and location benefits, this home is a must-see. Schedule your showing today!
-
2025-11-24$324,950 Active 980-char remark
Show marketing remark (980 chars)
Welcome to this charming and move-in-ready home, thoughtfully updated for comfort and peace of mind. Featuring a new roof, fresh interior and exterior paint, and updated flooring and windows, this home shines inside and out. Enjoy the security of a lifetime transferable foundation warranty and the reassurance of no flooding history. Located just minutes from Downtown Houston and one block from the METRO Rail, this home offers unbeatable convenience with easy commuting and access to all the city has to offer. With no HOA and low taxes, you’ll appreciate the flexibility and affordability that comes with this property. The enclosed patio is a true standout, complete with a custom BBQ smoker—perfect for weekend gatherings and year-round entertaining. The oversized backyard provides plenty of space to relax, garden, or create your ideal outdoor retreat. Packed with updates, charm, and location benefits, this home is a must-see. Schedule your showing today!
-
2025-11-24historical
Show marketing remark (980 chars)
Welcome to this charming and move-in-ready home, thoughtfully updated for comfort and peace of mind. Featuring a new roof, fresh interior and exterior paint, and updated flooring and windows, this home shines inside and out. Enjoy the security of a lifetime transferable foundation warranty and the reassurance of no flooding history. Located just minutes from Downtown Houston and one block from the METRO Rail, this home offers unbeatable convenience with easy commuting and access to all the city has to offer. With no HOA and low taxes, you’ll appreciate the flexibility and affordability that comes with this property. The enclosed patio is a true standout, complete with a custom BBQ smoker—perfect for weekend gatherings and year-round entertaining. The oversized backyard provides plenty of space to relax, garden, or create your ideal outdoor retreat. Packed with updates, charm, and location benefits, this home is a must-see. Schedule your showing today!
-
2025-10-27price $339,900
-
2025-06-26$350,000 Active
-
2025-06-26historical
-
2025-06-22price $350,000
-
2025-06-02price $335,000
-
2025-05-07price $355,000
-
2025-03-19price $395,000
-
2025-03-19price $419,000
-
2025-02-05$429,000 Active
-
2011-08-03historical
-
2011-02-02$161,700
-
2007-08-30historical
-
2006-08-08$154,000
-
1988-12-02soldstatus
ⓘ Source: listings_history table (triggers on properties + properties_extension) + one-shot
backfill from property_details.listing_events for pre-trigger history.
Tax reassessment forecast TX · Resets to sale price
- Current annual tax
- $6,754 · $563/mo
- Projected year-2 tax
- $6,754 · $563/mo
- Expected delta
- $0/yr ($0/mo · 0.0%)
ⓘ Screening estimate from a state-policy table — verify with the county assessor before closing.
Climate risk First Street
- Flood 1/10 Low FEMA zone X (unshaded) · 0% chance over 30 yrs
- Wildfire 1/10 Low
- Heat 9/10 Extreme 7 d/yr ≥109°F today · 24 d/yr by 30 yrs out
- Wind 9/10 Extreme 99% chance of damaging wind over 30 yrs
- Air quality 3/10 Moderate 2 unhealthy d/yr today · 3 by 30 yrs out
Nearby sold comps map
Loading sold comps map…
Walkable amenities ~0.75 mi
Loading nearby amenities…
Taxation est. · year 1
- Rental income
- $29,564
- − Mortgage interest
- −$15,124
- − Property taxes
- −$6,754
- − Insurance
- −$1,350
- − Repairs & maintenance
- −$2,365
- − Management
- −$2,365
- − Depreciation
- −$7,855
- Taxable loss
- −$6,249
- Est. tax savings @ 24.0%
- +$1,500
- After-tax cash flow
- $-240/yr
For passive investors: Depreciation is non-cash, so a rental often shows a tax loss while cash-flowing — sheltering income. Rental losses are passive: they offset passive income freely, and up to $25,000/yr can offset ordinary (W-2) income if you actively participate and your MAGI is under $100k (phasing out to $0 by $150k); unused losses carry forward. On sale, claimed depreciation is recaptured at up to 25%, and gains may owe capital-gains tax (a 1031 exchange can defer both). Figures are a year-1 estimate at your 24.0% rate — not tax advice; consult a CPA.
Schools (NCES district)
- District
- Houston ISD
- NCES district ID
- 4823640
- Math proficiency
- 27% ▼ -18.00%
- Reading proficiency
- 35% ▼ -6.00%
- Median HH income
- $46,054
- Composite
- 26.63/100
- National rank
- #7173
- State rank
- #593 of 826 in TX
Livability — Houston
- Score
- 74/100
- State rank
- #184
- US rank
- #4771
Category grades
Schools grade is shown separately in the Schools card above.
Census & demographics
- Census place
- Houston, TX
- County
- Harris County · 4,702,590 people
- City population
- 3,226,434
- Metro
- Houston-The Woodlands-Sugar Land, TX
- Population (ZIP)
- 35,769
- Household income
- $83,148
- Rent vs Own
- Severe rent burden
- 994.0
Population outlook (Harris County) Hauer SSP2
- Today (2025)
- 5,571,493 people
- By 2030
- 6,089,821 · +9.3%
- By 2040
- 7,142,806 · +28.2%
- By 2050
- 8,185,864 · +46.9%
- By 2075
- 10,574,329 · +89.8%
- By 2100
- 12,109,958 · +117.4%
Race, ethnicity, and origin ACS 2023
- Neighborhood character
- Diverse neighborhood (Simpson 0.60)
- Race & ethnicity
- Hispanic / Latino 53% White 33% Two or more races 22% Black 8% Asian 3%
- Hispanic origin (detail)
- Mexican 46%
- Common ancestry
- Italian 2% Lithuanian 2% Slovak 1%
- Foreign-born
- 20% · Canada
- Languages at home
- 55% English-only · Spanish 40% Other Indo-European 2% Other Asian/Pacific 1%
Political lean MEDSL · Harris
- 2024 margin
- Lean D (+5.5) · D 52.0% · R 46.4% · Other 1.6%
- 2008→2024 swing
- +3.9pp toward D · 2008: 1.6pp · 2024: 5.5pp
- All cycles
- 2024: D+5.5 2020: D+13.3 2016: D+12.4 2012: D+0.1 2008: D+1.6
Not yet ingested
- Civics
- —
Market trends
- HPI YoY
- ▼ -533.57%
- Current HPI
- 219.5037
- Rent YoY
- ▲ 0.84%
- Metro
- Houston-The Woodlands-Sugar Land, TX
- State GDP YoY
- ▲ 3.95%
- F500 in state
- 110
Industry mix (Fortune 500 HQ in TX)
| Industry | F500 HQs | Revenue |
|---|---|---|
| Energy | 16 | $1,198B |
|
||
| Technology | 5 | $198B |
|
||
| Engineering / Construction | 4 | $72B |
|
||
| Energy Services | 3 | $60B |
|
||
| Utilities | 3 | $41B |
|
||
| Healthcare | 2 | $330B |
|
||
Price history
-98.7% since first listed20 events — show timeline
- 2026-05-20 Price Changed $2,050 HARMLS
- 2026-04-28 Price Changed $270,000 HARMLS
- 2026-04-12 Listed for Rent $2,200 HARMLS
- 2026-02-12 Price Changed $285,000 HARMLS
- 2025-11-24 Listing Removed — HARMLS
- 2025-11-24 Listed $324,950 HARMLS
- 2025-10-27 Price Changed $339,900 HARMLS
- 2025-06-26 Listing Removed — HARMLS
- 2025-06-26 Listed $350,000 HARMLS
- 2025-06-22 Price Changed $350,000 HARMLS
- 2025-06-02 Price Changed $335,000 HARMLS
- 2025-05-07 Price Changed $355,000 HARMLS
- 2025-03-19 Price Changed $395,000 HARMLS
- 2025-03-19 Price Changed $419,000 HARMLS
- 2025-02-05 Listed $429,000 HARMLS
- 2011-08-03 Listing Removed — HARMLS
- 2011-02-02 Listed $161,700 HARMLS
- 2007-08-30 Listing Removed — HARMLS
- 2006-08-08 Listed $154,000 HARMLS
- 1988-12-02 Sold (Public Records) — Public Records
Property tax history
+7.3%/yrLatest (2025): $6,754 · -13.2% YoY. Source: county tax records.
Cash-flow waterfall
monthlySold comps — $/sqft
last 12 mo · ≤1 miLoading sold comps…