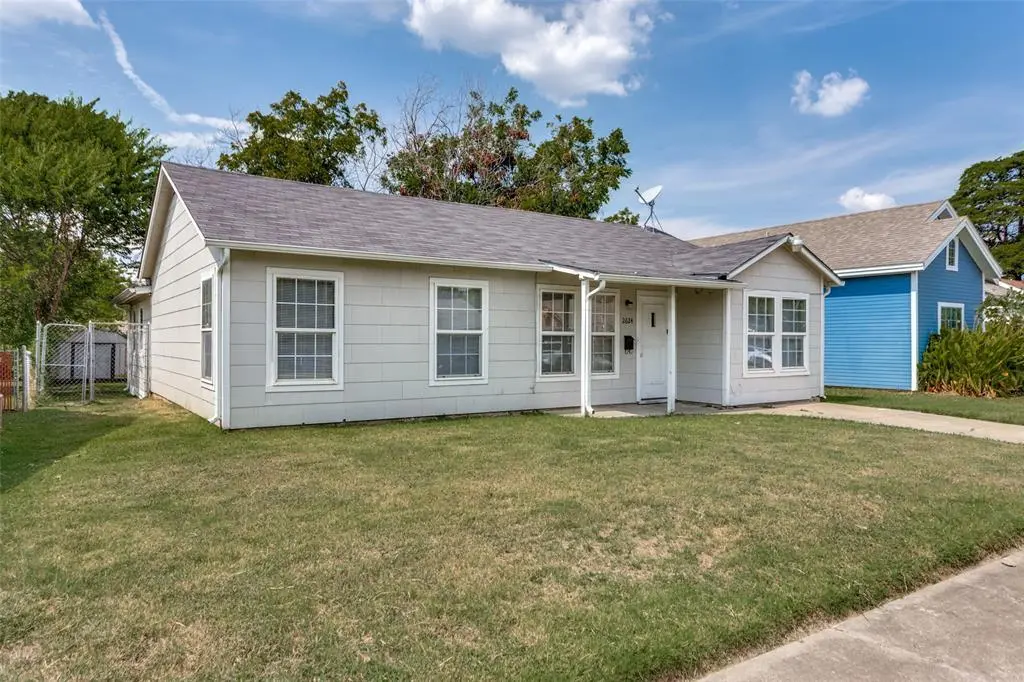
2624 Frazier Ave · Fort Worth, TX
Flood risk 1/10 · Minimal
- FEMA flood zone
- X (unshaded)
- Chance of flooding over 30 yrs
- 0.0%
- Est. flood insurance / yr
- $507 – $1,088
Fire risk 1/10 · Minimal
- Est. fire insurance / yr
- $1,222 – $2,270
Heat risk 7/10 · Major
- Hot days now (above 109°F)
- 7 days/yr
- Hot days in 30 yrs
- 23 days/yr
Wind risk 4/10 · Minor
- Chance of severe wind over 30 yrs
- 24.0%
Air-quality risk 3/10 · Minor
- Unhealthy air days now
- 2 days/yr
- Unhealthy air days in 30 yrs
- 3 days/yr
Risk factors via First Street. Map © Google.
Why this score? — see what drove the C grade
The composite is a weighted blend of 9 inputs, each scored 0–100. Each bar is that input's sub-score; the figure is the points it added to the 100-point composite (weight × sub-score).
- Cash flow +17.6/30.0
- ARV discount +15.0/15.0
- 1% rule +5.9/10.0
- DSCR +5.5/10.0
- Livability +4.0/5.0
- Rent growth +2.7/5.0
- Condition / age +2.5/5.0
- Schools +2.0/10.0
- Appreciation +0.0/10.0
$274,900
🖨 Deal sheet 📄 Offer letter ✓ Due diligence
Listing remarks MLS
Full of vintage charm and modern updates, this beautiful Craftsman-style home offers character and convenience in a highly desirable Fort Worth Neighborhood. Ideally located in walking distance to TCU, Paschal, the Fort Worth Zoo, Tillery Park, the Hospital District, and a variety of restaurants, this timeless home is a smart choice for both homeowners and investors. Inside, you’ll find built-in shelving, arched doorways, and double-doors, giving the home so much character. Featuring three bedrooms, two full baths, an oversized living room, plus dining and breakfast areas, and a spacious back deck for enjoying evenings outdoors. Major updates include a new HVAC system (2020), water heater (2021), and roof (2017), ensuring peace of mind. With it's ideal location and proven rental potential, this home presents a rare opportunity in one of Fort Worth’s most sought-after areas!
Key facts
- Modern updates
- Craftsman-style home
- Arched doorways
Tags
Neighborhood map
What this means for you Summary
Snapshot
- This is a 3-bed/2.0-bath single-family listed at $275k.
Deal economics
- At list price, monthly cash flow is $217 ($3k/yr) — positive.
- The deal already cash-flows at list — no discount required.
- Meets the 1% rule at list price ($3k rent vs $275k).
- Recommended offer: $242k (12.0% below list) — sets the bar for market timing.
- Cap rate 7.2% vs local median 3.9% in Fort Worth — top-decile yield for the area; either an underpriced asset or a hidden risk that comps aren't pricing in. Stress-test before assuming the spread holds.
Location & tenants
- Location reads 80/100 on livability (#49 in TX, #1,954 nationally) — a professional / high-income tenant draw. Strengths: amenities A+, cost of living A+, housing A+; Watch: schools D+, crime F.
- Fort Worth ISD (urban): math 18% / reading 28% proficiency, ranked #742 of 826 in TX (top 90%) — low school quality limits family demand, transient renter base, plan for 1-2y turnover; 73% free/reduced lunch — lower-income household profile, screen leases tightly.
- Market conditions: Rents flat; 150 active listings in the ZIP; 40 comparable units currently listed for rent nearby; rentals at typical pace (median 19d on market — plan ~3-4 weeks tenant-placement turnaround); 18,938 units permitted in Tarrant County in 2024 (8,336 in 5+ unit buildings).
- At $2,995/mo this rent would consume 52% of the median local household income ($70k/yr) (locally 1471% of renters already pay >50% of income on rent) — very limited rent-growth headroom before tenants either downsize or default.
Forward outlook
- Local home prices are declining (-3.0%/yr); year-one equity from $2k of loan paydown is wiped out by about $8k of value loss. Plan a longer hold.
- Tarrant County population projected at +41% by 2050 — long-run rental-demand tailwind backs the buy-and-hold thesis.
Negotiation context
- It's been on market 160 days — a 12% lower offer ($242k) is reasonable based on typical stale-listing flexibility.
- 11 sale attempts since 21y ago; this cycle's ask has dropped $24k (8%) from the opening price — seller is motivated, your offer sets the floor, not the list.
Risks & watch-outs
- Watch-outs: property tax is 2.6% of price; built in 1948 — expect roof / HVAC / electrical / plumbing capex.
- Climate carrying-cost: extreme-heat days projected 7→23/yr by 2055 (HVAC capex compounding) — expect insurance premiums to compound above CPI over the hold.
Questions for the listing agent
- It's been on market 160 days. Have you received any prior offers? Is the seller open to a 12% concession, seller financing, or rate buy-down credit?
- Built in 1948 — when were the roof, HVAC, electrical panel, plumbing, and water heater last replaced?
- Property tax is high relative to price — has the assessment been appealed recently, and will the sale trigger a re-assessment?
- Why hasn't it sold? Are there any deal-killer items the seller is aware of (foundation, flood, title, zoning, code violations)?
- Is there a deadline driving the sale (1031 exchange, divorce, estate, relocation)? That informs how much negotiation room exists.
- Schools are D-rated, which usually means shorter tenancies and higher turnover. Who's the typical renter profile here, and what's been the actual vacancy rate?
- Crime grade is F in this area — have there been break-ins, vandalism, or insurance claims at this property in the last 3 years? What carrier currently insures it and at what premium?
- What's the average days-on-market for RENTAL listings here right now (not sales)? A rising rental-DOM trend means longer vacancies and softer asking-rent achievability than the comps imply.
- What's the recent tenant-quality profile in this submarket — average credit score on applications, eviction rate, late-payment / NSF rate, and stable-employment percentage? A property-management company in the area should have these aggregated.
- How much new for-sale + rental construction is in the pipeline within 1–3 miles? Heavy new supply typically softens prices + rents 12–24 months out; constrained supply supports both.
Investment metrics
- 1% rule
- 1.09% ✓
- Cap rate
- 7.24%
- Cash-on-cash
- 3.38%
- DSCR
- 1.15
- GRM
- 7.6
CMA / ARV
- ARV (median comp)
- $476,253
- List price
- $274,900
- Delta
- -42.28%
- Verdict
- UNDERPRICED
- Comps
- 20 within 1.0 mi
Show comp detail 12 sales within ~0.75 mi
| Address | Dist | Beds/Ba | Sqft | Sold | Price | $/sf | Match |
|---|---|---|---|---|---|---|---|
| 2624 Townsend Dr | 0.06mi | 4/3.0 (+1) | 1,922 (+5%) | 1mo | $420,000 | $219 | 79 |
| 2720 Sandage Ave | 0.26mi | 3/3.5 | 1,802 (-2%) | 6mo | $745,000 | $413 | 74 |
| 2301 Stanley Ave | 0.42mi | 3/2.0 | 1,716 (-6%) | 5mo | $675,000 | $393 | 65 |
| 2802 Addison Park Ln | 0.32mi | 3/3.5 | 1,937 (+6%) | 6mo | $399,900 | $206 | 65 |
| 1929 Forest Park Blvd | 0.70mi | 3/2.0 | 1,826 (-0%) | 3mo | $650,000 | $356 | 64 |
| 3001 Willing Ave | 0.65mi | 3/2.0 | 1,802 (-2%) | 4mo | $625,000 | $347 | 63 |
| 2001 Warner Rd | 0.66mi | 3/2.0 | 1,779 (-3%) | 6mo | $640,000 | $360 | 59 |
| 2711 Greene Ave | 0.45mi | 3/2.0 | 1,616 (-12%) | 5mo | $599,000 | $371 | 55 |
| 2204 6th Ave | 0.74mi | 2/2.0 (-1) | 1,779 (-3%) | 2mo | $545,000 | $306 | 54 |
| 2233 Fairmount Ave | 0.67mi | 3/2.0 | 1,596 (-13%) | 1mo | $539,500 | $338 | 47 |
| 2239 6th Ave | 0.71mi | 3/2.5 | 2,029 (+11%) | 6mo | $535,000 | $264 | 42 |
| 2219 Fairmount Ave | 0.69mi | 2/2.0 (-1) | 1,631 (-11%) | 7mo | $449,000 | $275 | 38 |
Match score weights: distance 35% · size 25% · config 20% · recency 20%. Top-matched comps best support the ARV.
Projected returns pro-forma
-3.0% appreciation · 0.7% rent growth · sell at horizon
- IRR
- -13.8%
- Equity multiple
- 0.52×
- Total profit
- $-37,303
- Equity at exit
- $40,988
- IRR
- -9.6%
- Equity multiple
- 0.47×
- Total profit
- $-40,434
- Equity at exit
- $23,768
Cash invested: $76,972 (down + closing). Projections, not guarantees.
Landlord ↔ Tenant lean methodology
- Overall (STATE)
- 87 Strongly Landlord-Friendly
- State Texas
- 87 Strongly Landlord-Friendly · R+5
- County
- — inherits STATE
- City
- — inherits STATE
ZIP-level market 76110
- Rents YoY
- 0.7%
- Active inventory
- 150
- Price-to-rent
- 7.6×
Monthly cashflow live
- Estimated rent
- $2,995 high interval (Pro) →
- Mortgage (P&I)
- −$1,442
- Tax from tax record
- −$593 /mo · $7,119/yr
- Insurance
- −$115
- HOA
- −$0
- Vacancy / Maint / Mgmt
- −$629
- Net cashflow
- $217
Break-even live
UW: 25.0% down · 7.5% · 30yr · 1.5% tax · 5.0% vac · 8.0% maint · 8.0% mgmt
Financing live
Cash to close
- Down payment
- $68,725
- Closing costs
- $8,247
- Reserves months
- —
- Total cash needed
- —
Loan-product check · same deal, 3 products live
Conventional
25% down · 7.5% · 30yr
- Down + closing
- —
- Monthly P&I
- —
- Monthly cashflow
- —
- DSCR
- —
- Eligible?
- —
Personal DTI + credit; lowest rate.
DSCR
20% down · 8.5% · 30yr
- Down + closing
- —
- Monthly P&I
- —
- Monthly cashflow
- —
- DSCR
- —
- Eligible?
- —
No personal income docs; deal must DSCR.
Hard money
10% down · 12.0% · 12mo
- Down + closing
- —
- Monthly P&I
- —
- Monthly cashflow
- —
- DSCR
- —
- Eligible?
- —
Short-term bridge; refi at stabilization.
Rent comps 40 comps
| Address | Beds | Baths | Sqft | Rent | $/sqft | DOM | Units | Dist |
|---|---|---|---|---|---|---|---|---|
| 2600 Townsend Dr Fort Worth, TX | 4.0 | 3.0 | 2300 | $4,000 | $1.74 | 18d | 1 | 0.09mi |
| 2001 Park Hill Dr Fort Worth, TX | 1.0–3.0 | 1.0–2.0 | 1024 | $2,459 | $2.40 | 2d | 50 | 0.18mi |
| 2205 Park Hill Dr Fort Worth, TX | 2.0 | 2.0 | 1368 | $1,950 | $1.43 | 43d | 1 | 0.18mi |
| 2816 Gordon Ave Fort Worth, TX | 3.0 | 3.0 | 1570 | $3,000 | $1.91 | 6d | 1 | 0.20mi |
| 2714 McCart Ave Fort Worth, TX | 4.0 | 4.0 | 2090 | $4,800 | $2.30 | 18d | 1 | 0.21mi |
| 2828 Livingston Ave Fort Worth, TX | 4.0 | 2.5 | 2208 | $3,700 | $1.68 | 43d | 1 | 0.25mi |
| 1741 W Cantey St Fort Worth, TX | 3.0 | 3.5 | 1882 | $2,400 | $1.28 | 3d | 1 | 0.27mi |
| 2807 Stanley Ave Fort Worth, TX | 3.0 | 2.5 | 1906 | $2,395 | $1.26 | 24d | 1 | 0.28mi |
| 2800 Sandage Ave Apt 203 Fort Worth, TX | 3.0 | 3.0 | 1931 | $3,300 | $1.71 | 6d | 1 | 0.30mi |
| 2828 Addison Park Ln Fort Worth, TX | 3.0 | 3.5 | 1936 | $2,495 | $1.29 | 20d | 1 | 0.32mi |
| 2311 Warner Rd Fort Worth, TX | 3.0 | 2.0 | 2114 | $3,750 | $1.77 | 18d | 1 | 0.39mi |
| 2311 Warner Rd Fort Worth, TX | 3.0 | 2.0 | 2114 | $3,750 | $1.77 | 6d | 1 | 0.39mi |
| 2800 Lubbock Ave Unit 102 Fort Worth, TX | 3.0 | 2.5 | 2405 | $4,200 | $1.75 | 22d | 1 | 0.39mi |
| 2813 Parmer Ave Unit 103 Fort Worth, TX | 3.0 | 2.5 | 2405 | $4,200 | $1.75 | 19d | 1 | 0.41mi |
| 2821 Parmer Ave #125 Fort Worth, TX | 3.0 | 3.5 | 1898 | $2,350 | $1.24 | 43d | 1 | 0.42mi |
| 2532 Ryan Ave Fort Worth, TX | 3.0 | 2.0 | 1416 | $2,100 | $1.48 | 43d | 1 | 0.42mi |
| 2911 Ryan Ave Fort Worth, TX | 3.0 | 2.0 | 1790 | $1,750 | $0.98 | 6d | 1 | 0.51mi |
| 2615 Cockrell Ave Fort Worth, TX | 3.0 | 2.0 | 1813 | $3,495 | $1.93 | 20d | 1 | 0.53mi |
| 2606 Cockrell Ave Fort Worth, TX | 3.0 | 2.0 | 2142 | $4,000 | $1.87 | 43d | 1 | 0.56mi |
| 3134 Wayside Ave Fort Worth, TX | 3.0 | 2.5 | 1922 | $3,000 | $1.56 | 6d | 1 | 0.58mi |
| 2625 S University Dr Fort Worth, TX | 4.0 | 2.5 | 1964 | $2,695 | $1.37 | 2d | 1 | 0.59mi |
| 3136 Wayside Ave Fort Worth, TX | 3.0 | 2.5 | 1875 | $3,000 | $1.60 | 6d | 1 | 0.59mi |
| 3201 Forest Park Blvd Fort Worth, TX | 4.0 | 4.0 | 1772 | $3,750 | $2.12 | 18d | 1 | 0.63mi |
| 2500 S University Dr Fort Worth, TX | 2.0 | 2.5 | 1411 | $2,200 | $1.56 | 43d | 1 | 0.66mi |
| 2565 Rogers Ave Fort Worth, TX | 2.0 | 1.0 | 1425 | $1,795 | $1.26 | 24d | 1 | 0.67mi |
| 3128 Lubbock Ave Fort Worth, TX | 4.0 | 4.0 | 1800 | $3,500 | $1.94 | 6d | 1 | 0.69mi |
| 2812 Ryan Place Dr Fort Worth, TX | 2.0 | 1.0 | 1234 | $2,795 | $2.26 | 17d | 1 | 0.70mi |
| 3145 Waits Ave #302 Fort Worth, TX | 3.0 | 3.0 | 1245 | $3,000 | $2.41 | 24d | 1 | 0.72mi |
| 2200 6th Ave Fort Worth, TX | 3.0 | 3.0 | 1552 | $2,650 | $1.71 | 43d | 1 | 0.75mi |
| 3217 Lubbock Ave Unit B Fort Worth, TX | 3.0 | 3.0 | 1856 | $3,150 | $1.70 | 18d | 1 | 0.75mi |
| 3201 Ryan Ave Fort Worth, TX | 4.0 | 2.0 | 2000 | $2,100 | $1.05 | 43d | 1 | 0.76mi |
| 3240 Sandage Ave Fort Worth, TX | 4.0 | 4.0 | 2200 | $3,900 | $1.77 | 14d | 1 | 0.77mi |
| 1921 Ben Hall Ct Fort Worth, TX | 3.0 | 1.0 | 1507 | $2,850 | $1.89 | 10d | 1 | 0.77mi |
| 2101 Fairmount Ave Fort Worth, TX | 3.0 | 2.5 | 1516 | $3,200 | $2.11 | 2d | 1 | 0.78mi |
| 3136 Cockrell Ave Unit 102 Fort Worth, TX | 3.0 | 3.0 | 1376 | $3,900 | $2.83 | 5d | 1 | 0.80mi |
| 3229 Waits Ave Fort Worth, TX | 4.0 | 3.0 | 1830 | $3,900 | $2.13 | 43d | 1 | 0.80mi |
| 2505 Benbrook Blvd Unit 503 Fort Worth, TX | 3.0 | 3.0 | 1367 | $2,495 | $1.83 | 43d | 1 | 0.81mi |
| 3144 Cockrell Ave Fort Worth, TX | 3.0 | 3.0 | 2210 | $2,550 | $1.15 | 4d | 1 | 0.81mi |
| 2509 Benbrook Blvd Unit 902 Fort Worth, TX | 3.0 | 3.0 | 1756 | $2,595 | $1.48 | 43d | 1 | 0.81mi |
| 2521 Benbrook Blvd Fort Worth, TX | 3.0 | 3.0 | 1849 | $4,000 | $2.16 | 4d | 1 | 0.83mi |
Listing history 50 events
-
2026-06-18days on market $274,900 Active 160 DOM
-
2026-06-17days on market $274,900 Active 159 DOM
-
2026-06-16days on market $274,900 Active 158 DOM
-
2026-06-15days on market $274,900 Active 157 DOM
-
2026-06-13days on market $274,900 Active 155 DOM
-
2026-06-09days on market $274,900 Active 151 DOM
-
2026-06-08days on market $274,900 Active 150 DOM
-
2026-06-07days on market $274,900 Active 149 DOM
-
2026-06-04statusdays on market $274,900 Active 146 DOM
-
2026-06-02statusdays on market $274,900 Pending 145 DOM
-
2026-06-02statusdays on market $274,900 Active Option Contract 144 DOM
-
2026-05-31days on market $274,900 Active 143 DOM
-
2026-02-14price $274,900 903-char remark
Show marketing remark (903 chars)
Full of vintage charm and modern updates, this beautiful Craftsman-style home offers character and convenience in a highly desirable Fort Worth Neighborhood. Ideally located in walking distance to TCU, Paschal, the Fort Worth Zoo, Tillery Park, the Hospital District, and a variety of restaurants, this timeless home is a smart choice for both homeowners and investors. Inside, you’ll find built-in shelving, arched doorways, and double-doors, giving the home so much character. Featuring three bedrooms, two full baths, an oversized living room, plus dining and breakfast areas, and a spacious back deck for enjoying evenings outdoors. Major updates include a new HVAC system (2020), water heater (2021), and roof (2017), ensuring peace of mind. With it's ideal location and proven rental potential, this home presents a rare opportunity in one of Fort Worth’s most sought-after areas!
-
2026-01-30price $294,000 903-char remark
Show marketing remark (903 chars)
Full of vintage charm and modern updates, this beautiful Craftsman-style home offers character and convenience in a highly desirable Fort Worth Neighborhood. Ideally located in walking distance to TCU, Paschal, the Fort Worth Zoo, Tillery Park, the Hospital District, and a variety of restaurants, this timeless home is a smart choice for both homeowners and investors. Inside, you’ll find built-in shelving, arched doorways, and double-doors, giving the home so much character. Featuring three bedrooms, two full baths, an oversized living room, plus dining and breakfast areas, and a spacious back deck for enjoying evenings outdoors. Major updates include a new HVAC system (2020), water heater (2021), and roof (2017), ensuring peace of mind. With it's ideal location and proven rental potential, this home presents a rare opportunity in one of Fort Worth’s most sought-after areas!
-
2026-01-08$299,000 Active 903-char remark
Show marketing remark (903 chars)
Full of vintage charm and modern updates, this beautiful Craftsman-style home offers character and convenience in a highly desirable Fort Worth Neighborhood. Ideally located in walking distance to TCU, Paschal, the Fort Worth Zoo, Tillery Park, the Hospital District, and a variety of restaurants, this timeless home is a smart choice for both homeowners and investors. Inside, you’ll find built-in shelving, arched doorways, and double-doors, giving the home so much character. Featuring three bedrooms, two full baths, an oversized living room, plus dining and breakfast areas, and a spacious back deck for enjoying evenings outdoors. Major updates include a new HVAC system (2020), water heater (2021), and roof (2017), ensuring peace of mind. With it's ideal location and proven rental potential, this home presents a rare opportunity in one of Fort Worth’s most sought-after areas!
-
2025-12-16historical
-
2025-12-11price $319,000
-
2025-09-16$333,000 Active
-
2024-07-12historical $1,925
-
2024-07-05price $1,925
-
2024-06-23$2,000
-
2024-06-20historical $2,175
-
2024-05-10price $2,175
-
2024-04-27$2,235
-
2024-04-27historical $2,235
-
2024-04-12price $2,235
-
2024-03-26price $2,325
-
2024-03-06$2,430
-
2023-10-21historical $2,500
-
2023-10-12$2,500
-
2023-10-12historical $2,500
-
2023-10-10price $2,500
-
2023-09-14$2,550
-
2021-10-06soldstatus
-
2021-10-05soldstatus Sold
-
2021-09-10status Pending
-
2021-08-26historical Active Option Contract
-
2021-08-18price $279,900
-
2021-08-09price $289,900
-
2021-07-30price $299,900
-
2021-07-22price $314,900
-
2021-07-20price $329,900
-
2021-07-16price $339,900
-
2021-07-13price $349,900
-
2021-07-08price $354,900
-
2021-07-03price $364,900
-
2021-07-01price $374,900
-
2021-06-19$384,900 Active
-
2018-08-02soldstatus
-
2018-04-30historical
ⓘ Source: listings_history table (triggers on properties + properties_extension) + one-shot
backfill from property_details.listing_events for pre-trigger history.
Tax reassessment forecast TX · Resets to sale price
- Current annual tax
- $7,119 · $593/mo
- Projected year-2 tax
- $7,119 · $593/mo
- Expected delta
- $0/yr ($0/mo · 0.0%)
ⓘ Screening estimate from a state-policy table — verify with the county assessor before closing.
Climate risk First Street
- Flood 1/10 Low FEMA zone X (unshaded) · 0% chance over 30 yrs
- Wildfire 1/10 Low
- Heat 7/10 Severe 7 d/yr ≥109°F today · 23 d/yr by 30 yrs out
- Wind 4/10 Moderate 24% chance of damaging wind over 30 yrs
- Air quality 3/10 Moderate 2 unhealthy d/yr today · 3 by 30 yrs out
Nearby sold comps map
Loading sold comps map…
Walkable amenities ~0.75 mi
Loading nearby amenities…
Taxation est. · year 1
- Rental income
- $35,945
- − Mortgage interest
- −$15,399
- − Property taxes
- −$7,119
- − Insurance
- −$1,374
- − Repairs & maintenance
- −$2,876
- − Management
- −$2,876
- − Depreciation
- −$7,997
- Taxable loss
- −$1,695
- Est. tax savings @ 24.0%
- +$407
- After-tax cash flow
- $3,011/yr
For passive investors: Depreciation is non-cash, so a rental often shows a tax loss while cash-flowing — sheltering income. Rental losses are passive: they offset passive income freely, and up to $25,000/yr can offset ordinary (W-2) income if you actively participate and your MAGI is under $100k (phasing out to $0 by $150k); unused losses carry forward. On sale, claimed depreciation is recaptured at up to 25%, and gains may owe capital-gains tax (a 1031 exchange can defer both). Figures are a year-1 estimate at your 24.0% rate — not tax advice; consult a CPA.
Schools (NCES district)
- District
- Fort Worth ISD
- NCES district ID
- 4819700
- Math proficiency
- 18% ▼ -16.00%
- Reading proficiency
- 28% ▼ -6.00%
- Median HH income
- $42,109
- Composite
- 19.61/100
- National rank
- #8753
- State rank
- #742 of 826 in TX
Livability — Fort Worth
- Score
- 80/100
- State rank
- #49
- US rank
- #1954
Category grades
Schools grade is shown separately in the Schools card above.
Census & demographics
- Census place
- Fort Worth, TX
- County
- Tarrant County · 2,033,669 people
- City population
- 911,619
- Metro
- Dallas-Fort Worth-Arlington, TX
- Population (ZIP)
- 33,441
- Household income
- $69,790
- Rent vs Own
- Severe rent burden
- 1471.0
Population outlook (Tarrant County) Hauer SSP2
- Today (2025)
- 2,380,417 people
- By 2030
- 2,578,900 · +8.3%
- By 2040
- 2,974,995 · +25.0%
- By 2050
- 3,350,489 · +40.8%
- By 2075
- 4,216,909 · +77.2%
- By 2100
- 4,741,527 · +99.2%
Race, ethnicity, and origin ACS 2023
- Neighborhood character
- Majority Hispanic (63%)
- Race & ethnicity
- Hispanic / Latino 63% White 30% Two or more races 24% Black 2% Asian 2%
- Hispanic origin (detail)
- Mexican 57%
- Common ancestry
- Slovak 1% Italian 1% Lithuanian 1%
- Foreign-born
- 26% · Canada, China
- Languages at home
- 45% English-only · Spanish 52% Other Asian/Pacific 1% Other Indo-European 1%
Political lean MEDSL · Tarrant
- 2024 margin
- Lean R (+5.1) · D 46.7% · R 51.9% · Other 1.4%
- 2008→2024 swing
- +6.6pp toward D · 2008: -11.7pp · 2024: -5.1pp
- All cycles
- 2024: R+5.1 2020: D+0.2 2016: R+8.7 2012: R+15.7 2008: R+11.7
Not yet ingested
- Civics
- —
Market trends
- HPI YoY
- ▼ -194.46%
- Current HPI
- 274.8888
- Rent YoY
- ▲ 0.70%
- Metro
- Dallas-Fort Worth-Arlington, TX
- State GDP YoY
- ▲ 3.95%
- F500 in state
- 110
Industry mix (Fortune 500 HQ in TX)
| Industry | F500 HQs | Revenue |
|---|---|---|
| Energy | 16 | $1,198B |
|
||
| Technology | 5 | $198B |
|
||
| Engineering / Construction | 4 | $72B |
|
||
| Energy Services | 3 | $60B |
|
||
| Utilities | 3 | $41B |
|
||
| Healthcare | 2 | $330B |
|
||
Price history
+149.9% since first listed51 events — show timeline
- 2026-02-14 Price Changed $274,900 NTREIS
- 2026-01-30 Price Changed $294,000 NTREIS
- 2026-01-08 Listed $299,000 NTREIS
- 2025-12-16 Listing Removed — NTREIS
- 2025-12-11 Price Changed $319,000 NTREIS
- 2025-09-16 Listed $333,000 NTREIS
- 2024-07-12 Rental Removed $1,925 RENTLY
- 2024-07-05 Price Changed $1,925 RENTLY
- 2024-06-23 Listed for Rent $2,000 RENTLY
- 2024-06-20 Rental Removed $2,175 NTREIS
- 2024-05-10 Price Changed $2,175 NTREIS
- 2024-04-27 Listed for Rent $2,235 NTREIS
- 2024-04-27 Rental Removed $2,235 RENTLY
- 2024-04-12 Price Changed $2,235 RENTLY
- 2024-03-26 Price Changed $2,325 RENTLY
- 2024-03-06 Listed for Rent $2,430 RENTLY
- 2023-10-21 Rental Removed $2,500 NTREIS
- 2023-10-12 Listed for Rent $2,500 NTREIS
- 2023-10-12 Rental Removed $2,500 RENTLY
- 2023-10-10 Price Changed $2,500 RENTLY
- 2023-09-14 Listed for Rent $2,550 RENTLY
- 2021-10-06 Sold (Public Records) — Public Records
- 2021-10-05 Sold (MLS) — NTREIS
- 2021-09-10 Pending — NTREIS
- 2021-08-26 Contingent — NTREIS
- 2021-08-18 Price Changed $279,900 NTREIS
- 2021-08-09 Price Changed $289,900 NTREIS
- 2021-07-30 Price Changed $299,900 NTREIS
- 2021-07-22 Price Changed $314,900 NTREIS
- 2021-07-20 Price Changed $329,900 NTREIS
- 2021-07-16 Price Changed $339,900 NTREIS
- 2021-07-13 Price Changed $349,900 NTREIS
- 2021-07-08 Price Changed $354,900 NTREIS
- 2021-07-03 Price Changed $364,900 NTREIS
- 2021-07-01 Price Changed $374,900 NTREIS
- 2021-06-19 Listed $384,900 NTREIS
- 2018-08-02 Sold (Public Records) — Public Records
- 2018-04-30 Listing Removed — NTREIS
- 2018-04-09 Price Changed $249,900 NTREIS
- 2018-03-22 Price Changed $254,900 NTREIS
- 2018-03-15 Listed $274,900 NTREIS
- 2009-09-08 Sold (Public Records) — Public Records
- 2009-08-28 Sold (MLS) — NTREIS
- 2009-07-16 Listing Removed — NTREIS
- 2009-02-06 Listed $135,000 NTREIS
- 2005-08-04 Sold (Public Records) — Public Records
- 2005-07-20 Sold (MLS) — NTREIS
- 2005-04-11 Listing Removed — NTREIS
- 2005-01-06 Listed $110,000 NTREIS
- 1999-06-29 Sold (Public Records) — Public Records
- 1999-04-06 Sold (Public Records) — Public Records
Property tax history
+5.2%/yrLatest (2025): $7,119 · -13.6% YoY. Source: county tax records.
Cash-flow waterfall
monthlySold comps — $/sqft
last 12 mo · ≤1 miLoading sold comps…