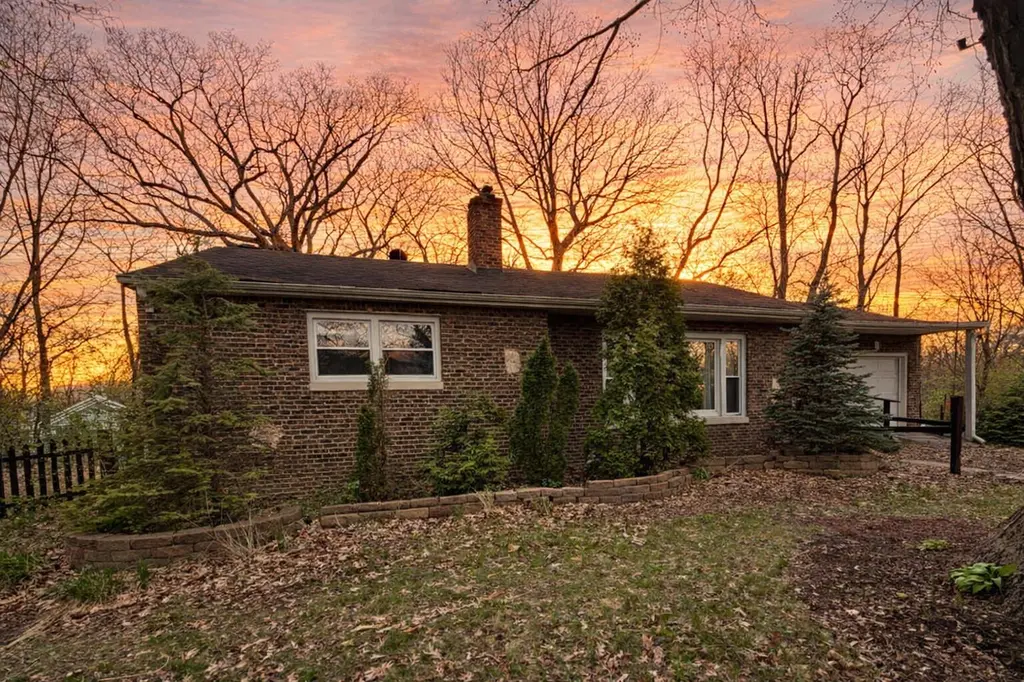
1000 E 61st Pl · Merrillville, IN
Flood risk 1/10 · Minimal
- FEMA flood zone
- X (unshaded)
- Chance of flooding over 30 yrs
- 0.0%
- Est. flood insurance / yr
- $473 – $860
Fire risk 2/10 · Minimal
- Est. fire insurance / yr
- $717 – $1,331
Heat risk 2/10 · Minimal
- Hot days now (above 101°F)
- 7 days/yr
- Hot days in 30 yrs
- 15 days/yr
Wind risk 2/10 · Minimal
- Chance of severe wind over 30 yrs
- —
Air-quality risk 3/10 · Minor
- Unhealthy air days now
- 2 days/yr
- Unhealthy air days in 30 yrs
- 3 days/yr
Risk factors via First Street. Map © Google.
Why this score? — see what drove the C+ grade
The composite is a weighted blend of 9 inputs, each scored 0–100. Each bar is that input's sub-score; the figure is the points it added to the 100-point composite (weight × sub-score).
- Cash flow +22.2/30.0
- ARV discount +15.0/15.0
- DSCR +7.1/10.0
- 1% rule +5.0/10.0
- Livability +3.8/5.0
- Rent growth +3.5/5.0
- Schools +2.6/10.0
- Condition / age +2.5/5.0
- Appreciation +0.0/10.0
$146,000
🖨 Deal sheet (PDF) 📄 Offer letter ✓ Due diligence
Listing remarks MLS
Great Ranch style brick home 3 bedrooms, 1 bath with fireplace in living room offer you endless options. Great for owner occupant or investor. Central location with easy access to shopping, schools & recreation. Offer deadline Thursday March 23, 2017 3pm!
Key facts
- Peaceful creek
- Generous deck
- Brick home
Tags
Neighborhood map
What this means for you Summary
Snapshot
- This is a 2-bed/2.0-bath single-family listed at $146k.
Deal economics
- At list price, monthly cash flow is $237 ($3k/yr) — positive.
- The deal already cash-flows at list — no discount required.
- To meet the 1% rule (rent ≥ 1% of price), the offer needs to be $146k (0.0% below list).
- Recommended offer: $146k (0.0% below list) — sets the bar for 1% rule.
- Cap rate 8.2% vs local median 4.7% in Merrillville — top-decile yield for the area; either an underpriced asset or a hidden risk that comps aren't pricing in. Stress-test before assuming the spread holds.
Location & tenants
- Location reads 76/100 on livability (#50 in IN, #3,393 nationally) — a middle-class / working-renter tenant base. Strengths: commute A+, cost of living A+, housing A+; Watch: schools D+, amenities F, health & safety D-.
- Merrillville Community School Corporation (suburban): math 22% / reading 36% proficiency, ranked #240 of 301 in IN (top 80%) — low school quality limits family demand, transient renter base, plan for 1-2y turnover.
- Market conditions: Rents rising fast (+4.1%/yr); 264 active listings in the ZIP; 8 comparable units currently listed for rent nearby; rentals leasing fast (median 14d on market — plan ~1-2 weeks tenant-placement turnaround); 1,642 units permitted in Lake County in 2024 (14 in 5+ unit buildings).
Forward outlook
- Local home prices are declining (-3.0%/yr); year-one equity from $1k of loan paydown is wiped out by about $4k of value loss. Plan a longer hold.
- Lake County population projected to shrink 7% by 2050 — rents likely to lag national; underwrite the cash flow, not the appreciation.
Negotiation context
- Only 9 days on market — expect competitive offers; lowballing is unlikely to land.
- 4 sale attempts since 24y ago with the ask held roughly flat each time — persistent listings suggest the price (not the market) is what's stuck; bring a comps-based counter.
- Current owner paid $47k; list at $146k implies a 210% gain — meaningful room to come down on a strong offer.
Risks & watch-outs
- Watch-outs: built in 1951 — expect roof / HVAC / electrical / plumbing capex.
Questions for the listing agent
- Built in 1951 — when were the roof, HVAC, electrical panel, plumbing, and water heater last replaced?
- Is there a deadline driving the sale (1031 exchange, divorce, estate, relocation)? That informs how much negotiation room exists.
- Schools are D-rated, which usually means shorter tenancies and higher turnover. Who's the typical renter profile here, and what's been the actual vacancy rate?
- What's the average days-on-market for RENTAL listings here right now (not sales)? A rising rental-DOM trend means longer vacancies and softer asking-rent achievability than the comps imply.
- What's the recent tenant-quality profile in this submarket — average credit score on applications, eviction rate, late-payment / NSF rate, and stable-employment percentage? A property-management company in the area should have these aggregated.
- How much new for-sale + rental construction is in the pipeline within 1–3 miles? Heavy new supply typically softens prices + rents 12–24 months out; constrained supply supports both.
Investment metrics
- 1% rule
- 1.00% ✗
- Cap rate
- 8.24%
- Cash-on-cash
- 6.94%
- DSCR
- 1.31
- GRM
- 8.3
CMA / ARV
- ARV (on-the-fly)
- $181,256
- Comps found
- 10
Show comp detail 10 sales within ~0.75 mi
| Address | Dist | Beds/Ba | Sqft | Sold | Price | $/sf | Match |
|---|---|---|---|---|---|---|---|
| 6181 Kentucky Pl | 0.12mi | 3/2.0 (+1) | 1,127 (+1%) | 19mo | $230,500 | $205 | 71 |
| 6150 Virginia St | 0.28mi | 3/1.0 (+1) | 1,040 (-6%) | 0mo | $170,000 | $163 | 67 |
| 1029 E 64th Pl | 0.42mi | 2/1.0 | 1,092 (-2%) | 8mo | $82,500 | $76 | 66 |
| 735 E 61st Ave | 0.19mi | 3/1.0 (+1) | 1,152 (+4%) | 13mo | $160,000 | $139 | 65 |
| 1424 Mississippi Pl | 0.63mi | 3/1.0 (+1) | 1,176 (+6%) | 5mo | $132,000 | $112 | 48 |
| 6391 Vermont St | 0.31mi | 3/1.0 (+1) | 1,026 (-8%) | 20mo | $176,500 | $172 | 47 |
| 46 E 66th Pl | 0.72mi | 3/1.0 (+1) | 1,180 (+6%) | 2mo | $188,000 | $159 | 46 |
| 6174 Pennsylvania St | 0.46mi | 3/1.0 (+1) | 1,008 (-9%) | 16mo | $121,500 | $121 | 40 |
| 43 E 66th Pl | 0.75mi | 3/1.0 (+1) | 1,009 (-9%) | 13mo | $207,000 | $205 | 30 |
| 6667 Connecticut St | 0.75mi | 3/1.0 (+1) | 960 (-14%) | 10mo | $190,000 | $198 | 25 |
Match score weights: distance 35% · size 25% · config 20% · recency 20%. Top-matched comps best support the ARV.
Projected returns pro-forma
-3.0% appreciation · 4.1% rent growth · sell at horizon
- IRR
- -4.5%
- Equity multiple
- 0.83×
- Total profit
- $-6,993
- Equity at exit
- $21,769
- IRR
- 6.3%
- Equity multiple
- 1.49×
- Total profit
- $20,025
- Equity at exit
- $12,623
Cash invested: $40,880 (down + closing). Projections, not guarantees.
Landlord ↔ Tenant lean methodology
- Overall (STATE)
- 90 Strongly Landlord-Friendly
- State Indiana
- 90 Strongly Landlord-Friendly · R+11
- County
- — inherits STATE
- City
- — inherits STATE
ZIP-level market 46410
- Rents YoY
- 4.1%
- Active inventory
- 264
- Price-to-rent
- 8.3×
Monthly cashflow live
- Estimated rent
- $1,460 high interval (Pro) →
- Mortgage (P&I)
- −$766
- Tax from tax record
- −$90 /mo · $1,082/yr
- Insurance
- −$61
- HOA
- −$0
- Vacancy / Maint / Mgmt
- −$307
- Net cashflow
- $237
Break-even live
Sensitivity live
| Price | -10% $319 | -5% $278 | +0% $237 | +5% $195 | +10% $154 |
|---|---|---|---|---|---|
| Rent | -10% $121 | -5% $179 | +0% $237 | +5% $294 | +10% $352 |
| Rate | -1.0pp $310 | -0.5pp $274 | base $237 | +0.5pp $199 | +1.0pp $160 |
UW: 25.0% down · 7.5% · 30yr · 1.5% tax · 5.0% vac · 8.0% maint · 8.0% mgmt
Financing live
Cash to close
- Down payment
- $36,500
- Closing costs
- $4,380
- Reserves months
- —
- Total cash needed
- —
Loan-product check · same deal, 3 products live
Conventional
25% down · 7.5% · 30yr
- Down + closing
- —
- Monthly P&I
- —
- Monthly cashflow
- —
- DSCR
- —
- Eligible?
- —
Personal DTI + credit; lowest rate.
DSCR
20% down · 8.5% · 30yr
- Down + closing
- —
- Monthly P&I
- —
- Monthly cashflow
- —
- DSCR
- —
- Eligible?
- —
No personal income docs; deal must DSCR.
Hard money
10% down · 12.0% · 12mo
- Down + closing
- —
- Monthly P&I
- —
- Monthly cashflow
- —
- DSCR
- —
- Eligible?
- —
Short-term bridge; refi at stabilization.
Rent comps 8 comps
| Address | Beds | Baths | Sqft | Rent | $/sqft | DOM | Units | Dist |
|---|---|---|---|---|---|---|---|---|
| 5850 Pennsylvania St Merrillville, IN | 1.0–2.0 | 1.0 | 826 | $1,195 | $1.45 | 2d | 4 | 0.56mi |
| 330 E 69th Pl Merrillville, IN | 3.0 | 1.5 | 1482 | $1,850 | $1.25 | 2d | 1 | 1.14mi |
| 5719 Van Buren St Merrillville, IN | 3.0 | 2.0 | 950 | $1,500 | $1.58 | 22d | 1 | 1.16mi |
| 5026 Kentucky St Gary, IN | 3.0 | 1.0 | 1200 | $1,100 | $0.92 | 7d | 1 | 1.39mi |
| 5001 Carolina St Gary, IN | 3.0 | 1.0 | 875 | $1,350 | $1.54 | 3d | 1 | 1.42mi |
| 6850 Van Buren Pl Merrillville, IN | 3.0 | 1.0 | 1120 | $1,795 | $1.60 | 21d | 1 | 1.45mi |
| 6839 Harrison St Merrillville, IN | 3.0 | 1.0 | 1128 | $1,650 | $1.46 | 13d | 1 | 1.45mi |
| 4974 Tennessee St Gary, IN | 2.0 | 1.0 | 1100 | $1,175 | $1.07 | 20d | 1 | 1.46mi |
Listing history 8 events
-
2026-04-23status Pending
-
2026-04-13$146,000 Active
-
2025-04-07historical
-
2025-02-27$215,000 Active
-
2017-04-18soldstatus $47,050 261-char remark
Show marketing remark (261 chars)
Great Ranch style brick home 3 bedrooms, 1 bath with fireplace in living room offer you endless options. Great for owner occupant or investor. Central location with easy access to shopping, schools & recreation. Offer deadline Thursday March 23, 2017 3pm!
-
2017-03-18$42,300 261-char remark
Show marketing remark (261 chars)
Great Ranch style brick home 3 bedrooms, 1 bath with fireplace in living room offer you endless options. Great for owner occupant or investor. Central location with easy access to shopping, schools & recreation. Offer deadline Thursday March 23, 2017 3pm!
-
2003-11-20historical
-
2002-01-17$95,900
ⓘ Source: listings_history table (triggers on properties + properties_extension) + one-shot
backfill from property_details.listing_events for pre-trigger history.
Tax reassessment forecast IN · Partial reset (capped growth)
- Current annual tax
- $1,082 · $90/mo
- Projected year-2 tax
- $1,162 · $97/mo
- Expected delta
- +$79/yr (+$7/mo · 7.3%)
ⓘ Screening estimate from a state-policy table — verify with the county assessor before closing.
Climate risk First Street
- Flood 1/10 Low FEMA zone X (unshaded) · 0% chance over 30 yrs
- Wildfire 2/10 Low
- Heat 2/10 Low 7 d/yr ≥101°F today · 15 d/yr by 30 yrs out
- Wind 2/10 Low
- Air quality 3/10 Moderate 2 unhealthy d/yr today · 3 by 30 yrs out
Nearby sold comps map
Loading sold comps map…
Walkable amenities ~0.75 mi
Loading nearby amenities…
Taxation est. · year 1
- Rental income
- $17,517
- − Mortgage interest
- −$8,178
- − Property taxes
- −$1,082
- − Insurance
- −$730
- − Repairs & maintenance
- −$1,401
- − Management
- −$1,401
- − Depreciation
- −$4,247
- Taxable income
- $477
- Est. tax owed @ 24.0%
- −$114
- After-tax cash flow
- $2,724/yr
For passive investors: Depreciation is non-cash, so a rental often shows a tax loss while cash-flowing — sheltering income. Rental losses are passive: they offset passive income freely, and up to $25,000/yr can offset ordinary (W-2) income if you actively participate and your MAGI is under $100k (phasing out to $0 by $150k); unused losses carry forward. On sale, claimed depreciation is recaptured at up to 25%, and gains may owe capital-gains tax (a 1031 exchange can defer both). Figures are a year-1 estimate at your 24.0% rate — not tax advice; consult a CPA.
Schools (NCES district)
- District
- Merrillville Community School Corporation
- NCES district ID
- 1809690
- Math proficiency
- 22% ▼ -17.00%
- Reading proficiency
- 36% ▼ -8.00%
- Median HH income
- $54,401
- Composite
- 25.74/100
- National rank
- #7375
- State rank
- #240 of 301 in IN
Livability — Merrillville
- Score
- 76/100
- State rank
- #50
- US rank
- #3393
Category grades
Schools grade is shown separately in the Schools card above.
Census & demographics
- Census place
- Merrillville, IN
- County
- Lake County · 422,878 people
- City population
- 39,243
- Metro
- Chicago-Naperville-Elgin, IL-IN-WI
- Population (ZIP)
- 39,243
- Household income
- $64,127
- Rent vs Own
- Severe rent burden
- 1644.0
Population outlook (Lake County) Hauer SSP2
- Today (2025)
- 484,026 people
- By 2030
- 478,091 · -1.2%
- By 2040
- 462,974 · -4.3%
- By 2050
- 449,894 · -7.1%
- By 2075
- 436,169 · -9.9%
- By 2100
- 426,607 · -11.9%
Race, ethnicity, and origin ACS 2023
- Neighborhood character
- Diverse neighborhood (Simpson 0.66)
- Race & ethnicity
- Black 46% White 32% Hispanic / Latino 16% Two or more races 9% Asian 2%
- Hispanic origin (detail)
- Mexican 11% Puerto Rican 3%
- Common ancestry
- Romanian 4% Iranian 2% Italian 1%
- Foreign-born
- 7% · Canada
- Languages at home
- 88% English-only · Spanish 7% Other Indo-European 2%
Political lean MEDSL · Lake
- 2024 margin
- Lean D (+5.6) · D 52.1% · R 46.5% · Other 1.5%
- 2008→2024 swing
- -28.6pp toward R · 2008: 34.3pp · 2024: 5.6pp
- All cycles
- 2024: D+5.6 2020: D+15.1 2016: D+20.6 2012: D+31.0 2008: D+34.3
Not yet ingested
- Civics
- —
Market trends
- HPI YoY
- ▼ -180.11%
- Current HPI
- 240.8833
- Rent YoY
- ▲ 4.10%
- Metro
- Chicago-Naperville-Elgin, IL-IN-WI
- State GDP YoY
- ▲ 2.90%
- F500 in state
- 18
Industry mix (Fortune 500 HQ in IN)
| Industry | F500 HQs | Revenue |
|---|---|---|
| Industrial Machinery | 2 | $37B |
|
||
| Healthcare | 1 | $177B |
|
||
| Pharmaceuticals | 1 | $45B |
|
||
| Metals / Steel | 1 | $18B |
|
||
| Agriculture | 1 | $17B |
|
||
| Packaging | 1 | $12B |
|
||
Price history
+52.2% since first listed8 events — show timeline
- 2026-04-23 Pending — NIRA MLS as Distributed by MLS Grid
- 2026-04-13 Listed $146,000 NIRA MLS as Distributed by MLS Grid
- 2025-04-07 Listing Removed — NIRA MLS as Distributed by MLS Grid
- 2025-02-27 Listed $215,000 NIRA MLS as Distributed by MLS Grid
- 2017-04-18 Sold (MLS) $47,050 NIRA MLS as Distributed by MLS Grid
- 2017-03-18 Listed $42,300 NIRA MLS as Distributed by MLS Grid
- 2003-11-20 Listing Removed — NIRA MLS as Distributed by MLS Grid
- 2002-01-17 Listed $95,900 NIRA MLS as Distributed by MLS Grid
Property tax history
+3.8%/yrLatest (2024): $1,082 · +7.6% YoY. Source: county tax records.
Cash-flow waterfall
monthlySold comps — $/sqft
last 12 mo · ≤1 miLoading sold comps…