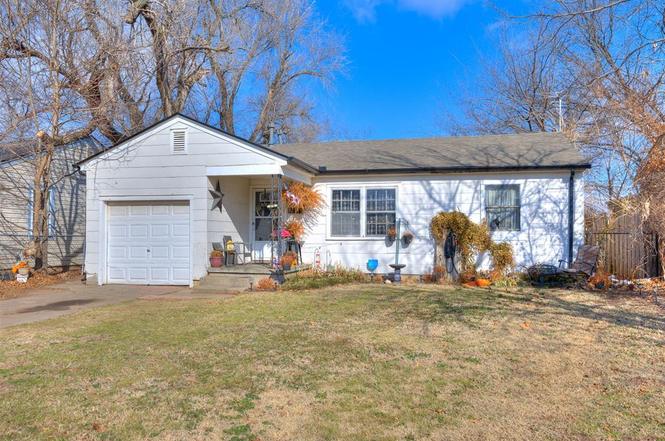
903 Dakota St · Norman, OK
Flood risk 1/10 · Minimal
- FEMA flood zone
- X (unshaded)
- Chance of flooding over 30 yrs
- 0.0%
- Est. flood insurance / yr
- $507 – $1,088
Fire risk 4/10 · Minor
- Est. fire insurance / yr
- $2,463 – $4,575
Heat risk 6/10 · Moderate
- Hot days now (above 108°F)
- 7 days/yr
- Hot days in 30 yrs
- 19 days/yr
Wind risk 2/10 · Minimal
- Chance of severe wind over 30 yrs
- 4.0%
Air-quality risk 2/10 · Minimal
- Unhealthy air days now
- 1 days/yr
- Unhealthy air days in 30 yrs
- 1 days/yr
Risk factors via First Street. Map © Google.
Why this score? — see what drove the B grade
The composite is a weighted blend of 9 inputs, each scored 0–100. Each bar is that input's sub-score; the figure is the points it added to the 100-point composite (weight × sub-score).
- Cash flow +28.5/30.0
- ARV discount +15.0/15.0
- DSCR +10.0/10.0
- 1% rule +7.3/10.0
- Rent growth +4.4/5.0
- Livability +4.2/5.0
- Schools +2.6/10.0
- Condition / age +2.5/5.0
- Appreciation +0.0/10.0
$110,000
🖨 Deal sheet 📄 Offer letter ✓ Due diligence
Listing remarks MLS
Has lots of potential. Structural report on file. Wood floors, needs mostly cosmetic updating.
Key facts
- 6,970 sq ft lot
- Garage
- Built 1950
Neighborhood map
What this means for you Summary
Snapshot
- This is a 3-bed/1.0-bath single-family listed at $110k.
Deal economics
- At list price, monthly cash flow is $359 ($4k/yr) — positive.
- The deal already cash-flows at list — no discount required.
- Meets the 1% rule at list price ($1k rent vs $110k).
- Recommended offer: $108k (1.5% below list) — sets the bar for market timing.
- Cap rate 10.2% vs local median 3.6% in Norman — top-decile yield for the area; either an underpriced asset or a hidden risk that comps aren't pricing in. Stress-test before assuming the spread holds.
Location & tenants
- Location reads 85/100 on livability (#1 in OK, #557 nationally) — a professional / high-income tenant draw. Strengths: amenities A+, commute A+, cost of living A+.
- Norman (suburban): math 27% / reading 32% proficiency, ranked #61 of 270 in OK (top 23%) — low school quality limits family demand, transient renter base, plan for 1-2y turnover.
- Zoned schools: Adams Es (math 16% / reading 20%, grade F, #534 of 845 statewide, top 64%, 550 students, 0% FRL); Norman North Hs (math 45% / reading 57%, grade D+, #2 of 447 statewide, top 0%, 2,401 students, 0% FRL) — zoned schools average 0% FRL vs 39% district-wide (39 pts lower); this property's tenant base skews higher-income than the district average.
- Market conditions: Rents rising fast (+7.7%/yr); 250 active listings in the ZIP; 6 comparable units currently listed for rent nearby; rentals at typical pace (median 15d on market — plan ~3-4 weeks tenant-placement turnaround); 592 units permitted in Cleveland County in 2024 (12 in 5+ unit buildings).
Forward outlook
- Local home prices are declining (-3.0%/yr); year-one equity from $761 of loan paydown is wiped out by about $3k of value loss. Plan a longer hold.
- Cleveland County population projected at +40% by 2050 — long-run rental-demand tailwind backs the buy-and-hold thesis.
- At projected returns (-3.0% appreciation + 7.7% rent growth), your $31k cash investment doubles in ~7 years — after that, you're playing with house money.
Negotiation context
- It's been on market 21 days — a 2% lower offer ($108k) is reasonable based on typical stale-listing flexibility.
- 2 sale attempts since 24y ago with the ask held roughly flat each time — persistent listings suggest the price (not the market) is what's stuck; bring a comps-based counter.
- Current owner paid $56k; list at $110k implies a 96% gain — meaningful room to come down on a strong offer.
Risks & watch-outs
- Watch-outs: built in 1950 — expect roof / HVAC / electrical / plumbing capex.
- Climate carrying-cost: extreme-heat days projected 7→19/yr by 2055 (HVAC capex compounding) — expect insurance premiums to compound above CPI over the hold.
Questions for the listing agent
- Built in 1950 — when were the roof, HVAC, electrical panel, plumbing, and water heater last replaced?
- Is there a deadline driving the sale (1031 exchange, divorce, estate, relocation)? That informs how much negotiation room exists.
- What's the average days-on-market for RENTAL listings here right now (not sales)? A rising rental-DOM trend means longer vacancies and softer asking-rent achievability than the comps imply.
- What's the recent tenant-quality profile in this submarket — average credit score on applications, eviction rate, late-payment / NSF rate, and stable-employment percentage? A property-management company in the area should have these aggregated.
- How much new for-sale + rental construction is in the pipeline within 1–3 miles? Heavy new supply typically softens prices + rents 12–24 months out; constrained supply supports both.
Investment metrics
- 1% rule
- 1.23% ✓
- Cap rate
- 10.21%
- Cash-on-cash
- 13.98%
- DSCR
- 1.62
- GRM
- 6.8
CMA / ARV
- ARV (on-the-fly)
- $135,762
- Comps found
- 12
Show comp detail 12 sales within ~0.75 mi
| Address | Dist | Beds/Ba | Sqft | Sold | Price | $/sf | Match |
|---|---|---|---|---|---|---|---|
| 840 Iowa St | 0.11mi | 2/1.0 (-1) | 765 (+5%) | 6mo | $150,000 | $196 | 76 |
| 1221 Dakota St | 0.17mi | 2/1.0 (-1) | 708 (-2%) | 10mo | $135,000 | $191 | 74 |
| 1226 Iowa St | 0.21mi | 2/1.0 (-1) | 783 (+8%) | 3mo | $139,000 | $178 | 70 |
| 618 Iowa St | 0.25mi | 2/2.0 (-1) | 730 (+1%) | 13mo | $145,000 | $199 | 67 |
| 806 Denison Dr | 0.18mi | 2/1.0 (-1) | 789 (+9%) | 8mo | $147,500 | $187 | 65 |
| 1234 Iowa St | 0.25mi | 2/1.0 (-1) | 720 (-1%) | 22mo | $105,000 | $146 | 64 |
| 711 Iowa St | 0.18mi | 2/1.0 (-1) | 702 (-3%) | 22mo | $105,000 | $150 | 62 |
| 923 Kansas St | 0.21mi | 2/1.0 (-1) | 820 (+13%) | 8mo | $95,000 | $116 | 57 |
| 1002 Garver St | 0.56mi | 2/1.0 (-1) | 786 (+8%) | 9mo | $200,000 | $254 | 48 |
| 1324 Dorchester Dr | 0.43mi | 2/1.0 (-1) | 795 (+10%) | 14mo | $160,000 | $201 | 48 |
| 1422 Eisenhower Rd | 0.72mi | 2/1.0 (-1) | 754 (+4%) | 14mo | $100,000 | $133 | 43 |
| 718 N University Blvd | 0.43mi | 2/1.0 (-1) | 811 (+12%) | 18mo | $145,000 | $179 | 40 |
Match score weights: distance 35% · size 25% · config 20% · recency 20%. Top-matched comps best support the ARV.
Projected returns pro-forma
-3.0% appreciation · 7.66% rent growth · sell at horizon
- IRR
- 9.2%
- Equity multiple
- 1.38×
- Total profit
- $11,666
- Equity at exit
- $16,401
- IRR
- 21.8%
- Equity multiple
- 3.26×
- Total profit
- $69,561
- Equity at exit
- $9,511
Cash invested: $30,800 (down + closing). Projections, not guarantees.
Landlord ↔ Tenant lean methodology
- Overall (STATE)
- 83 Strongly Landlord-Friendly
- State Oklahoma
- 83 Strongly Landlord-Friendly · R+20
- County
- — inherits STATE
- City
- — inherits STATE
ZIP-level market 73069
- Rents YoY
- 7.7%
- Active inventory
- 250
- Price-to-rent
- 6.8×
Monthly cashflow live
- Estimated rent
- $1,353 high interval (Pro) →
- Mortgage (P&I)
- −$577
- Tax from tax record
- −$87 /mo · $1,045/yr
- Insurance
- −$46
- HOA
- −$0
- Vacancy / Maint / Mgmt
- −$284
- Net cashflow
- $359
Break-even live
UW: 25.0% down · 7.5% · 30yr · 1.5% tax · 5.0% vac · 8.0% maint · 8.0% mgmt
Financing live
Cash to close
- Down payment
- $27,500
- Closing costs
- $3,300
- Reserves months
- —
- Total cash needed
- —
Loan-product check · same deal, 3 products live
Conventional
25% down · 7.5% · 30yr
- Down + closing
- —
- Monthly P&I
- —
- Monthly cashflow
- —
- DSCR
- —
- Eligible?
- —
Personal DTI + credit; lowest rate.
DSCR
20% down · 8.5% · 30yr
- Down + closing
- —
- Monthly P&I
- —
- Monthly cashflow
- —
- DSCR
- —
- Eligible?
- —
No personal income docs; deal must DSCR.
Hard money
10% down · 12.0% · 12mo
- Down + closing
- —
- Monthly P&I
- —
- Monthly cashflow
- —
- DSCR
- —
- Eligible?
- —
Short-term bridge; refi at stabilization.
Rent comps 6 comps
| Address | Beds | Baths | Sqft | Rent | $/sqft | DOM | Units | Dist |
|---|---|---|---|---|---|---|---|---|
| 911 Nebraska St Norman, OK | 2.0 | 1.0 | 750 | $1,095 | $1.46 | 14d | 1 | 0.12mi |
| 1238 Iowa St Norman, OK | 2.0 | 1.0 | 720 | $1,150 | $1.60 | 23d | 1 | 0.25mi |
| 222 S University Blvd Unit 2 Norman, OK | 2.0 | 2.0 | 685 | $2,055 | $3.00 | 14d | 1 | 0.81mi |
| 303 E Himes St Unit 2 Norman, OK | 2.0 | 1.0 | 671 | $1,045 | $1.56 | 23d | 1 | 0.96mi |
| 301 Hal Muldrow Dr Norman, OK | 1.0–2.0 | 1.0–2.0 | 857 | $1,100 | $1.28 | 1d | 6 | 1.03mi |
| 602 Tiffin Ave Norman, OK | 2.0 | 1.0 | 720 | $1,249 | $1.73 | 10d | 1 | 1.41mi |
Listing history 6 events
-
2026-02-26status Pending
-
2026-01-26$110,000 Active
-
2005-02-01soldstatus $56,000
-
2002-12-06soldstatus $41,500 96-char remark
Show marketing remark (96 chars)
Has lots of potential. Structural report on file. Wood floors, needs mostly cosmetic updating.
-
2002-12-06soldstatus $41,500
Show marketing remark (96 chars)
Has lots of potential. Structural report on file. Wood floors, needs mostly cosmetic updating.
-
2002-10-21$50,000 96-char remark
Show marketing remark (96 chars)
Has lots of potential. Structural report on file. Wood floors, needs mostly cosmetic updating.
ⓘ Source: listings_history table (triggers on properties + properties_extension) + one-shot
backfill from property_details.listing_events for pre-trigger history.
Tax reassessment forecast OK · Resets to sale price
- Current annual tax
- $1,045 · $87/mo
- Projected year-2 tax
- $1,045 · $87/mo
- Expected delta
- $0/yr ($0/mo · 0.0%)
ⓘ Screening estimate from a state-policy table — verify with the county assessor before closing.
Climate risk First Street
- Flood 1/10 Low FEMA zone X (unshaded) · 0% chance over 30 yrs
- Wildfire 4/10 Moderate
- Heat 6/10 Major 7 d/yr ≥108°F today · 19 d/yr by 30 yrs out
- Wind 2/10 Low 4% chance of damaging wind over 30 yrs
- Air quality 2/10 Low 1 unhealthy d/yr today · 1 by 30 yrs out
Nearby sold comps map
Loading sold comps map…
Walkable amenities ~0.75 mi
Loading nearby amenities…
Taxation est. · year 1
- Rental income
- $16,233
- − Mortgage interest
- −$6,162
- − Property taxes
- −$1,045
- − Insurance
- −$550
- − Repairs & maintenance
- −$1,299
- − Management
- −$1,299
- − Depreciation
- −$3,200
- Taxable income
- $2,679
- Est. tax owed @ 24.0%
- −$643
- After-tax cash flow
- $3,664/yr
For passive investors: Depreciation is non-cash, so a rental often shows a tax loss while cash-flowing — sheltering income. Rental losses are passive: they offset passive income freely, and up to $25,000/yr can offset ordinary (W-2) income if you actively participate and your MAGI is under $100k (phasing out to $0 by $150k); unused losses carry forward. On sale, claimed depreciation is recaptured at up to 25%, and gains may owe capital-gains tax (a 1031 exchange can defer both). Figures are a year-1 estimate at your 24.0% rate — not tax advice; consult a CPA.
Schools (NCES district)
- District
- Norman
- NCES district ID
- 4021720
- Math proficiency
- 27% ▼ -9.00%
- Reading proficiency
- 32% ▼ -8.00%
- Median HH income
- $48,940
- Composite
- 25.67/100
- National rank
- #7395
- State rank
- #61 of 270 in OK
Livability — Norman
- Score
- 85/100
- State rank
- #1
- US rank
- #557
Category grades
Schools grade is shown separately in the Schools card above.
Census & demographics
- Census place
- Norman, OK
- County
- Cleveland County · 239,547 people
- City population
- 123,141
- Metro
- Oklahoma City, OK
- Population (ZIP)
- 28,462
- Household income
- $58,888
- Rent vs Own
- Severe rent burden
- 1704.0
Population outlook (Cleveland County) Hauer SSP2
- Today (2025)
- 323,621 people
- By 2030
- 349,070 · +7.9%
- By 2040
- 400,168 · +23.7%
- By 2050
- 454,101 · +40.3%
- By 2075
- 602,926 · +86.3%
- By 2100
- 734,485 · +127.0%
Race, ethnicity, and origin ACS 2023
- Neighborhood character
- Diverse neighborhood (Simpson 0.56)
- Race & ethnicity
- White 64% Two or more races 15% Hispanic / Latino 14% Native American 4% Black 4% Asian 3% Pacific Islander 1%
- Hispanic origin (detail)
- Mexican 9%
- Common ancestry
- Lithuanian 3% Italian 3% Slovak 2%
- Foreign-born
- 9% · Canada, China
- Languages at home
- 84% English-only · Spanish 10% Other Indo-European 1% Chinese 1%
Political lean MEDSL · Cleveland
- 2024 margin
- R (+14.9) · D 41.4% · R 56.4% · Other 2.2%
- 2008→2024 swing
- +9.1pp toward D · 2008: -24.0pp · 2024: -14.9pp
- All cycles
- 2024: R+14.9 2020: R+14.1 2016: R+21.7 2012: R+25.9 2008: R+24.0
Not yet ingested
- Civics
- —
Market trends
- HPI YoY
- ▼ -252.79%
- Current HPI
- 272.4754
- Rent YoY
- ▲ 7.66%
- Metro
- Oklahoma City, OK
- State GDP YoY
- ▲ 1.55%
- F500 in state
- 6
Industry mix (Fortune 500 HQ in OK)
| Industry | F500 HQs | Revenue |
|---|---|---|
| Energy | 3 | $48B |
|
||
Price history
+120.0% since first listed6 events — show timeline
- 2026-02-26 Pending — MLSOK
- 2026-01-26 Listed $110,000 MLSOK
- 2005-02-01 Sold (Public Records) $56,000 Public Records
- 2002-12-06 Sold (Public Records) $41,500 Public Records
- 2002-12-06 Sold (MLS) $41,500 MLSOK
- 2002-10-21 Listed $50,000 MLSOK
Property tax history
+2.2%/yrLatest (2024): $1,045 · +4.6% YoY. Source: county tax records.
Cash-flow waterfall
monthlySold comps — $/sqft
last 12 mo · ≤1 miLoading sold comps…