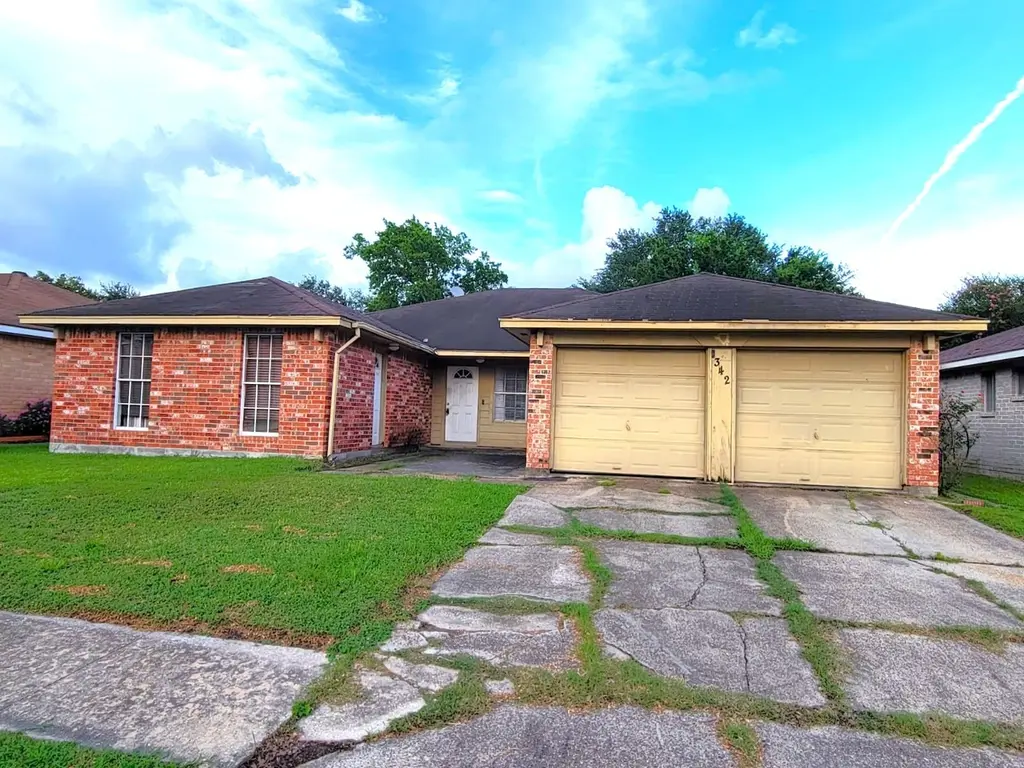
1342 Goswell Ln · Channelview, TX
Flood risk 1/10 · Minimal
- FEMA flood zone
- X (unshaded)
- Chance of flooding over 30 yrs
- 0.0%
- Est. flood insurance / yr
- $507 – $1,088
Fire risk 3/10 · Minor
- Est. fire insurance / yr
- $1,222 – $2,270
Heat risk 9/10 · Severe
- Hot days now (above 109°F)
- 7 days/yr
- Hot days in 30 yrs
- 24 days/yr
Wind risk 9/10 · Severe
- Chance of severe wind over 30 yrs
- 99.0%
Air-quality risk 2/10 · Minimal
- Unhealthy air days now
- 2 days/yr
- Unhealthy air days in 30 yrs
- 2 days/yr
Risk factors via First Street. Map © Google.
Why this score? — see what drove the C+ grade
The composite is a weighted blend of 9 inputs, each scored 0–100. Each bar is that input's sub-score; the figure is the points it added to the 100-point composite (weight × sub-score).
- Cash flow +20.6/30.0
- ARV discount +15.0/15.0
- DSCR +6.5/10.0
- 1% rule +6.4/10.0
- Rent growth +5.0/5.0
- Livability +3.3/5.0
- Schools +2.5/10.0
- Condition / age +2.5/5.0
- Appreciation +0.0/10.0
$199,000
🖨 Deal sheet 📄 Offer letter ✓ Due diligence
Listing remarks MLS
CALL NOW & purchase this GREAT home that showcases a HUGE living area; PLENTY of space TOWERING ceilings; FRESH paint; LARGE kitchen w/ ENDLESS counter space; SWIRLING ceiling fans; UNIQUE Five(5) bedrooms; REGAL fireplace; and a RECENT exterior AC system. DON T MISS OUT! This MATURE neighborhood is close to a PLETHORA of dining; shopping; Dell Dale; I-10; Beltway 8E. FANTASTIC BUY!
Key facts
- 6,098 sq ft lot
- 2 garage spots
- Built 1980
Property features AI
Finance
- HOA & community: Member of Sterling Green HOA
Exterior
- Parking: Attached 2-car garage
- Utilities: Public water; Public sewer
- Home design: Residential property; Built in 1980; Slab foundation
- Construction: Brick construction
- Exterior features: Lot approximately 6,098 sq ft; Lot features: Other
Interior
- Bedrooms: Bedroom on first level (12 x 11); Bedroom on first level (12 x 11); Bedroom on first level (14 x 12); Bedroom on first level (14 x 11); Bedroom on first level (19 x 12)
- Bathrooms: Two full bathrooms
- Heating & cooling: Central heating; Gas heating
- Interior features: One fireplace; Five total rooms
Neighborhood map
What this means for you Summary
Snapshot
- This is a 5-bed/2.5-bath single-family listed at $199k.
Deal economics
- At list price, monthly cash flow is $265 ($3k/yr) — positive.
- The deal already cash-flows at list — no discount required.
- Meets the 1% rule at list price ($2k rent vs $199k).
- Cap rate 7.9% vs local median 4.8% in Channelview — top-decile yield for the area; either an underpriced asset or a hidden risk that comps aren't pricing in. Stress-test before assuming the spread holds.
Location & tenants
- Location reads 66/100 on livability (#598 in TX) — a middle-class / working-renter tenant base. Strengths: cost of living A+, housing A+; Watch: crime F, amenities F, commute F.
- Channelview ISD (suburban): math 27% / reading 30% proficiency, ranked #640 of 826 in TX (top 78%) — low school quality limits family demand, transient renter base, plan for 1-2y turnover; 70% free/reduced lunch — lower-income household profile, screen leases tightly.
- Zoned schools: Aguirre J H (math 24% / reading 28%, grade F, #1,222 of 1,662 statewide, top 74%, 975 students, 76% FRL); Channelview H S (math 24% / reading 35%, grade F, #1,112 of 1,632 statewide, top 70%, 2,893 students, 87% FRL).
- Market conditions: Rents rising fast (+16.9%/yr); 100 active listings in the ZIP; 3 comparable units currently listed for rent nearby; rentals leasing fast (median 5d on market — plan ~1-2 weeks tenant-placement turnaround); 29,883 units permitted in Harris County in 2024 (8,621 in 5+ unit buildings).
- This rent runs 44% of the median local income ($62k/yr) — at the standard rent-burdened threshold; future hikes will face affordability resistance.
Forward outlook
- Local home prices are declining (-3.0%/yr); year-one equity from $1k of loan paydown is wiped out by about $6k of value loss. Plan a longer hold.
- Harris County population projected at +47% by 2050 — long-run rental-demand tailwind backs the buy-and-hold thesis.
- At projected returns (-3.0% appreciation + 8.0% rent growth), your $56k cash investment doubles in ~9 years — after that, you're playing with house money.
Negotiation context
- Only 9 days on market — expect competitive offers; lowballing is unlikely to land.
- 4 sale attempts since 15y ago with the ask held roughly flat each time — persistent listings suggest the price (not the market) is what's stuck; bring a comps-based counter.
Risks & watch-outs
- Climate carrying-cost: severe wind risk, 99% chance of damaging wind over 30y; extreme-heat days projected 7→24/yr by 2055 (HVAC capex compounding) — expect insurance premiums to compound above CPI over the hold.
Questions for the listing agent
- Is there a deadline driving the sale (1031 exchange, divorce, estate, relocation)? That informs how much negotiation room exists.
- Schools are D-rated, which usually means shorter tenancies and higher turnover. Who's the typical renter profile here, and what's been the actual vacancy rate?
- Crime grade is F in this area — have there been break-ins, vandalism, or insurance claims at this property in the last 3 years? What carrier currently insures it and at what premium?
- What's the average days-on-market for RENTAL listings here right now (not sales)? A rising rental-DOM trend means longer vacancies and softer asking-rent achievability than the comps imply.
- What's the recent tenant-quality profile in this submarket — average credit score on applications, eviction rate, late-payment / NSF rate, and stable-employment percentage? A property-management company in the area should have these aggregated.
- How much new for-sale + rental construction is in the pipeline within 1–3 miles? Heavy new supply typically softens prices + rents 12–24 months out; constrained supply supports both.
Investment metrics
- 1% rule
- 1.14% ✓
- Cap rate
- 7.89%
- Cash-on-cash
- 5.70%
- DSCR
- 1.25
- GRM
- 7.3
CMA / ARV
- ARV (on-the-fly)
- $291,004
- Comps found
- 12
Show comp detail 12 sales within ~0.75 mi
| Address | Dist | Beds/Ba | Sqft | Sold | Price | $/sf | Match |
|---|---|---|---|---|---|---|---|
| 1347 Goswell Ln | 0.03mi | 4/2.0 (-1) | 2,156 (-2%) | 7mo | $255,000 | $118 | 83 |
| 15467 Arce Rojo St | 0.58mi | 4/2.5 (-1) | 2,219 (+1%) | 2mo | $295,000 | $133 | 64 |
| 1607 Jaquima Valley Way | 0.64mi | 4/2.5 (-1) | 2,198 (+0%) | 1mo | $305,000 | $139 | 64 |
| 15223 Bedford Glen Dr | 0.22mi | 4/2.5 (-1) | 1,905 (-13%) | 0mo | $229,000 | $120 | 63 |
| 1038 Willersley Ln | 0.44mi | 4/2.0 (-1) | 1,992 (-9%) | 8mo | $240,000 | $120 | 51 |
| 1231 Nuevo Carrasco Ln | 0.33mi | 4/2.0 (-1) | 1,904 (-13%) | 6mo | $285,000 | $150 | 51 |
| 15402 Cielo Azul Ln | 0.55mi | 4/2.0 (-1) | 1,974 (-10%) | 3mo | $285,000 | $144 | 49 |
| 15443 Cipres Verde St | 0.51mi | 4/2.0 (-1) | 1,881 (-14%) | 2mo | $259,900 | $138 | 44 |
| 1715 Mickle Creek Dr | 0.54mi | 4/2.5 (-1) | 2,428 (+11%) | 9mo | $284,900 | $117 | 44 |
| 1914 Rock Ridge Dr | 0.72mi | 4/2.5 (-1) | 2,428 (+11%) | 2mo | $289,900 | $119 | 42 |
| 1535 Carbonear Dr | 0.72mi | 4/2.5 (-1) | 1,977 (-10%) | 8mo | $229,000 | $116 | 39 |
| 1042 Rancho Grande Dr | 0.67mi | 4/2.0 (-1) | 1,869 (-15%) | 1mo | $260,000 | $139 | 37 |
Match score weights: distance 35% · size 25% · config 20% · recency 20%. Top-matched comps best support the ARV.
Projected returns pro-forma
-3.0% appreciation · 8.0% rent growth · sell at horizon
- IRR
- -1.5%
- Equity multiple
- 0.94×
- Total profit
- $-3,325
- Equity at exit
- $29,672
- IRR
- 13.3%
- Equity multiple
- 2.32×
- Total profit
- $73,695
- Equity at exit
- $17,206
Cash invested: $55,720 (down + closing). Projections, not guarantees.
Landlord ↔ Tenant lean methodology
- Overall (STATE)
- 87 Strongly Landlord-Friendly
- State Texas
- 87 Strongly Landlord-Friendly · R+5
- County
- — inherits STATE
- City
- — inherits STATE
ZIP-level market 77530
- Rents YoY
- 16.9%
- Active inventory
- 100
- Price-to-rent
- 7.3×
Monthly cashflow live
- Estimated rent
- $2,261 medium interval (Pro) →
- Mortgage (P&I)
- −$1,044
- Tax from tax record
- −$395 /mo · $4,745/yr
- Insurance
- −$83
- HOA
- −$0
- Vacancy / Maint / Mgmt
- −$475
- Net cashflow
- $265
Break-even live
UW: 25.0% down · 7.5% · 30yr · 1.5% tax · 5.0% vac · 8.0% maint · 8.0% mgmt
Financing live
Cash to close
- Down payment
- $49,750
- Closing costs
- $5,970
- Reserves months
- —
- Total cash needed
- —
Loan-product check · same deal, 3 products live
Conventional
25% down · 7.5% · 30yr
- Down + closing
- —
- Monthly P&I
- —
- Monthly cashflow
- —
- DSCR
- —
- Eligible?
- —
Personal DTI + credit; lowest rate.
DSCR
20% down · 8.5% · 30yr
- Down + closing
- —
- Monthly P&I
- —
- Monthly cashflow
- —
- DSCR
- —
- Eligible?
- —
No personal income docs; deal must DSCR.
Hard money
10% down · 12.0% · 12mo
- Down + closing
- —
- Monthly P&I
- —
- Monthly cashflow
- —
- DSCR
- —
- Eligible?
- —
Short-term bridge; refi at stabilization.
Rent comps 3 comps
| Address | Beds | Baths | Sqft | Rent | $/sqft | DOM | Units | Dist |
|---|---|---|---|---|---|---|---|---|
| 1379 Dell Dale St Channelview, TX | 4.0 | 2.0 | 1444 | $1,893 | $1.31 | 5d | 1 | 0.12mi |
| 1111 Chestnut Bough St Channelview, TX | 4.0 | 3.0 | 2366 | $2,049 | $0.87 | 1d | 1 | 0.31mi |
| 14611 Crosshaven Dr Houston, TX | 4.0 | 3.0 | 2719 | $2,500 | $0.92 | 43d | 1 | 1.20mi |
Listing history 7 events
-
2026-06-18days on market $199,000 Active 9 DOM
-
2026-06-17days on market $199,000 Active 8 DOM
-
2026-06-16days on market $199,000 Active 7 DOM
-
2026-06-15days on market $199,000 Active 6 DOM
-
2026-06-13days on market $199,000 Active 4 DOM
-
2026-06-10remarks 699-char remark
-
2026-06-10$199,000 Active 1 DOM
ⓘ Source: listings_history table (triggers on properties + properties_extension) + one-shot
backfill from property_details.listing_events for pre-trigger history.
Tax reassessment forecast TX · Resets to sale price
- Current annual tax
- $4,745 · $395/mo
- Projected year-2 tax
- $4,745 · $395/mo
- Expected delta
- $0/yr ($0/mo · 0.0%)
ⓘ Screening estimate from a state-policy table — verify with the county assessor before closing.
Climate risk First Street
- Flood 1/10 Low FEMA zone X (unshaded) · 0% chance over 30 yrs
- Wildfire 3/10 Moderate
- Heat 9/10 Extreme 7 d/yr ≥109°F today · 24 d/yr by 30 yrs out
- Wind 9/10 Extreme 99% chance of damaging wind over 30 yrs
- Air quality 2/10 Low 2 unhealthy d/yr today · 2 by 30 yrs out
Nearby sold comps map
Loading sold comps map…
Walkable amenities ~0.75 mi
Loading nearby amenities…
Taxation est. · year 1
- Rental income
- $27,136
- − Mortgage interest
- −$11,147
- − Property taxes
- −$4,745
- − Insurance
- −$995
- − Repairs & maintenance
- −$2,171
- − Management
- −$2,171
- − Depreciation
- −$5,789
- Taxable income
- $118
- Est. tax owed @ 24.0%
- −$28
- After-tax cash flow
- $3,146/yr
For passive investors: Depreciation is non-cash, so a rental often shows a tax loss while cash-flowing — sheltering income. Rental losses are passive: they offset passive income freely, and up to $25,000/yr can offset ordinary (W-2) income if you actively participate and your MAGI is under $100k (phasing out to $0 by $150k); unused losses carry forward. On sale, claimed depreciation is recaptured at up to 25%, and gains may owe capital-gains tax (a 1031 exchange can defer both). Figures are a year-1 estimate at your 24.0% rate — not tax advice; consult a CPA.
Schools (NCES district)
- District
- Channelview ISD
- NCES district ID
- 4813590
- Math proficiency
- 27% ▼ -22.00%
- Reading proficiency
- 30% ▼ -8.00%
- Median HH income
- $52,320
- Composite
- 25.18/100
- National rank
- #7513
- State rank
- #640 of 826 in TX
Livability — Channelview
- Score
- 66/100
- State rank
- #598
- US rank
- #11392
Category grades
Schools grade is shown separately in the Schools card above.
Census & demographics
- Census place
- Channelview, TX
- County
- Harris County · 4,702,590 people
- City population
- 31,527
- Metro
- Houston-The Woodlands-Sugar Land, TX
- Population (ZIP)
- 31,527
- Household income
- $62,195
- Rent vs Own
- Severe rent burden
- 966.0
Population outlook (Harris County) Hauer SSP2
- Today (2025)
- 5,571,493 people
- By 2030
- 6,089,821 · +9.3%
- By 2040
- 7,142,806 · +28.2%
- By 2050
- 8,185,864 · +46.9%
- By 2075
- 10,574,329 · +89.8%
- By 2100
- 12,109,958 · +117.4%
Race, ethnicity, and origin ACS 2023
- Neighborhood character
- Predominantly Hispanic (71%)
- Race & ethnicity
- Hispanic / Latino 71% Two or more races 31% White 16% Black 9% Asian 4% Native American 1%
- Hispanic origin (detail)
- Mexican 61%
- Common ancestry
- Slovak 1% Lithuanian 1%
- Foreign-born
- 33% · Canada, Vietnam, Jamaica
- Languages at home
- 37% English-only · Spanish 60% Other Asian/Pacific 1% Vietnamese 1%
Political lean MEDSL · Harris
- 2024 margin
- Lean D (+5.5) · D 52.0% · R 46.4% · Other 1.6%
- 2008→2024 swing
- +3.9pp toward D · 2008: 1.6pp · 2024: 5.5pp
- All cycles
- 2024: D+5.5 2020: D+13.3 2016: D+12.4 2012: D+0.1 2008: D+1.6
Not yet ingested
- Civics
- —
Market trends
- HPI YoY
- ▼ -172.05%
- Current HPI
- 292.1862
- Rent YoY
- ▲ 16.85%
- Metro
- Houston-The Woodlands-Sugar Land, TX
- State GDP YoY
- ▲ 3.95%
- F500 in state
- 110
Industry mix (Fortune 500 HQ in TX)
| Industry | F500 HQs | Revenue |
|---|---|---|
| Energy | 16 | $1,198B |
|
||
| Technology | 5 | $198B |
|
||
| Engineering / Construction | 4 | $72B |
|
||
| Energy Services | 3 | $60B |
|
||
| Utilities | 3 | $41B |
|
||
| Healthcare | 2 | $330B |
|
||
Price history
+99.0% since first listed11 events — show timeline
- 2026-06-09 Listed $199,000 HARMLS
- 2014-12-03 Sold (Public Records) — Public Records
- 2014-09-25 Sold (MLS) — HARMLS
- 2014-08-27 Pending — HARMLS
- 2014-08-13 Pending — HARMLS
- 2014-08-06 Relisted — HARMLS
- 2014-08-02 Pending — HARMLS
- 2014-07-09 Listed $117,000 HARMLS
- 2012-12-04 Listing Removed — HARMLS
- 2011-12-11 Listed $99,999 HARMLS
- 1988-01-02 Sold (Public Records) — Public Records
Property tax history
+1.9%/yrLatest (2025): $4,745 · -2.3% YoY. Source: county tax records.
Cash-flow waterfall
monthlySold comps — $/sqft
last 12 mo · ≤1 miLoading sold comps…