 8-Plex
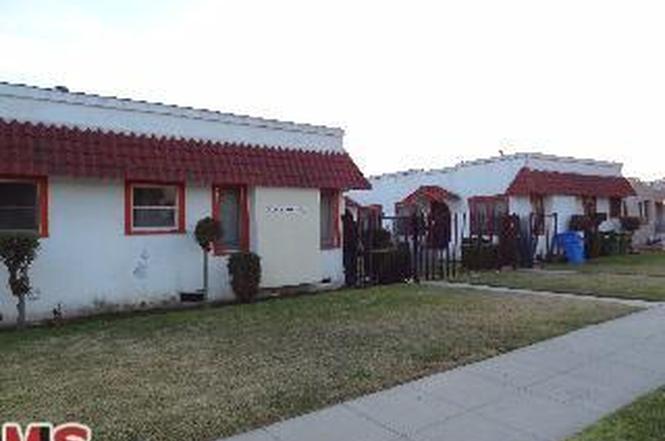
1462 W 53rd St · Los Angeles, CA
Flood risk 1/10 · Minimal
- FEMA flood zone
- X (shaded)
- Chance of flooding over 30 yrs
- 0.0%
- Est. flood insurance / yr
- $507 – $1,088
Fire risk 1/10 · Minimal
- Est. fire insurance / yr
- $659 – $1,223
Heat risk 5/10 · Moderate
- Hot days now (above 88°F)
- 7 days/yr
- Hot days in 30 yrs
- 21 days/yr
Wind risk 1/10 · Minimal
- Chance of severe wind over 30 yrs
- —
Air-quality risk 5/10 · Moderate
- Unhealthy air days now
- 7 days/yr
- Unhealthy air days in 30 yrs
- 7 days/yr
Risk factors via First Street. Map © Google.
Why this score? — see what drove the C+ grade
The composite is a weighted blend of 9 inputs, each scored 0–100. Each bar is that input's sub-score; the figure is the points it added to the 100-point composite (weight × sub-score).
- Cash flow +30.0/30.0
- DSCR +10.0/10.0
- 1% rule +9.1/10.0
- Rent growth +5.0/5.0
- Schools +3.6/10.0
- Livability +3.4/5.0
- Condition / age +2.5/5.0
- ARV discount +0.0/15.0
- Appreciation +0.0/10.0
$1,150,000
🖨 Deal sheet 📄 Offer letter ✓ Due diligence
Multi-family units
County records classify this as Multi-Family (5+ Unit). Listing-text estimate: 8 units. confirmed
5+ unit building — per-unit beds/baths from public records are typically unavailable; the breakdown below (if shown) is an estimate from the listing text.
Listing remarks
We are pleased to present the opportunity to acquire an 8-unit multifamily property located in the Vermont Square neighborhood of South Los Angeles. Built in 1922, the property features a classic courtyard layout with gated access and a desirable unit mix of (6) 1Bed/1Bath and (2) 2Bed/1Bath units. One 1-bedroom unit may become vacant in the near future, providing an opportunity for a new owner to capture additional rental income. The property includes eight (8) individual one-car garages with alley access and is individually metered for gas and electricity, minimizing operating expenses for ownership. The building offers 4,992 square feet of rentable space on an oversized 11,372 square fo
Key facts
- Alley access
- Individual garages
- Gated access
Tags
Property features AI
Finance
- Other: Unit rents (actual) — Unit 1: $1,298; Unit 2: $1,495; Unit 3: $1,027; Unit 4: $1,178; Unit 5: $1,298; Unit 6: $943; Unit 7: $1,100; Unit 8: $1,975; Projected rents listed for comparison (vary by unit)
- Financial info: Actual gross income: 123,768; Gross operating income: $121,682; Net operating income: $78,236; Total annual expenses: $43,445; Cap rate: 6.8%; Gross rent multiplier: 9.29; Income reported as Actual
- HOA & community: Total of 8 units in the complex
Exterior
- Parking: Detached garage; Garage fits 4+ cars (4 garage spaces total)
- Utilities: Water heaters present; Sewer, power, and other utilities not specified
- Home design: Residential income property; Single-story (one level)
- Construction: Construction details not specified; Year built not specified; Foundation and roof details not specified
- Exterior features: Lot zoned LAR2; Other structures: None
Interior
- Kitchen: Kitchens in each unit (appliances not specified)
- Bedrooms: Two 2-bedroom units; Six 1-bedroom units
- Bathrooms: Eight units with 1 bathroom each
- Heating & cooling: Wall heating; No cooling
- Interior features: One-level building; Standard unit types; Three separate buildings on site; Water heaters present
- Laundry & utility: Washer/dryer information not specified
Neighborhood map
What this means for you Summary
Snapshot
- This is a 8 × 1-bed/?-bath units multifamily listed at $1.15M.
Deal economics
- At list price, monthly cash flow is $5k ($66k/yr) — positive. Per door: $686/mo.
- The deal already cash-flows at list — no discount required.
- Meets the 1% rule at list price ($16k rent vs $1.15M).
- Recommended offer: $1.01M (12.0% below list) — sets the bar for market timing.
- Cap rate 12.0% vs local median 2.1% in Los Angeles — top-decile yield for the area; either an underpriced asset or a hidden risk that comps aren't pricing in. Stress-test before assuming the spread holds.
Location & tenants
- Location reads 68/100 on livability (#273 in CA) — a middle-class / working-renter tenant base. Strengths: amenities A+, commute A+, employment B; Watch: health & safety C-, schools D+, crime F.
- Los Angeles Unified (urban): math 29% / reading 54% proficiency, ranked #223 of 517 in CA (top 43%) — families likely to look elsewhere, expect single-tenant / working-renter base with shorter leases; 67% free/reduced lunch — lower-income household profile, screen leases tightly.
- Market conditions: Rents rising fast (+14.5%/yr); 86 active listings in the ZIP; 19,697 units permitted in Los Angeles County in 2024 (9,426 in 5+ unit buildings).
- At $16,265/mo this rent would consume 288% of the median local household income ($68k/yr) (locally 1890% of renters already pay >50% of income on rent) — very limited rent-growth headroom before tenants either downsize or default.
Forward outlook
- Local home prices are declining (-3.0%/yr); year-one equity from $8k of loan paydown is wiped out by about $34k of value loss. Plan a longer hold.
- Los Angeles County population projected at +9% by 2050 — modest demand growth; plan on rents tracking national, not racing it.
- At projected returns (-3.0% appreciation + 8.0% rent growth), your $322k cash investment doubles in ~5 years — after that, you're playing with house money.
Negotiation context
- It's been on market 210 days — a 12% lower offer ($1.01M) is reasonable based on typical stale-listing flexibility.
- 5 sale attempts since 19y ago; this cycle's ask has dropped $100k (8%) from the opening price — seller is motivated, your offer sets the floor, not the list.
- Current owner paid $595k; list at $1.15M implies a 93% gain — meaningful room to come down on a strong offer.
Risks & watch-outs
- Watch-outs: built in 1922 — expect roof / HVAC / electrical / plumbing capex.
- Climate carrying-cost: extreme-heat days projected 7→21/yr by 2055 (HVAC capex compounding) — expect insurance premiums to compound above CPI over the hold.
Questions for the listing agent
- It's been on market 210 days. Have you received any prior offers? Is the seller open to a 12% concession, seller financing, or rate buy-down credit?
- Can we see the unit-by-unit rent roll, current vacancy, and any below-market leases? What's the average tenancy length?
- What capital expenditures (roof, boiler, parking lot, exteriors) have been made in the last 5 years, and what's planned in the next 2?
- Built in 1922 — when were the roof, HVAC, electrical panel, plumbing, and water heater last replaced?
- Why hasn't it sold? Are there any deal-killer items the seller is aware of (foundation, flood, title, zoning, code violations)?
- Is there a deadline driving the sale (1031 exchange, divorce, estate, relocation)? That informs how much negotiation room exists.
- Schools are D-rated, which usually means shorter tenancies and higher turnover. Who's the typical renter profile here, and what's been the actual vacancy rate?
- Crime grade is F in this area — have there been break-ins, vandalism, or insurance claims at this property in the last 3 years? What carrier currently insures it and at what premium?
- What's the average days-on-market for RENTAL listings here right now (not sales)? A rising rental-DOM trend means longer vacancies and softer asking-rent achievability than the comps imply.
- What's the recent tenant-quality profile in this submarket — average credit score on applications, eviction rate, late-payment / NSF rate, and stable-employment percentage? A property-management company in the area should have these aggregated.
- How much new apartment / multifamily construction is in the pipeline within 1–3 miles? Heavy new supply (>2% of stock underway) typically softens rents 12–24 months out; light construction supports rent growth.
Investment metrics
- 1% rule
- 1.41% ✓
- Cap rate
- 12.02%
- Cash-on-cash
- 20.46%
- DSCR
- 1.91
- GRM
- 5.9
CMA / ARV
- ARV (on-the-fly)
- $828,672
- Comps found
- 1
Show comp detail 1 sale within ~0.75 mi
| Address | Dist | Beds/Ba | Sqft | Sold | Price | $/sf | Match |
|---|---|---|---|---|---|---|---|
| 1425 W 48th St | 0.45mi | 8/4.0 | 5,686 (+14%) | 1mo | $945,600 | $166 | 40 |
Match score weights: distance 35% · size 25% · config 20% · recency 20%. Top-matched comps best support the ARV.
Projected returns pro-forma
-3.0% appreciation · 8.0% rent growth · sell at horizon
- IRR
- 18.0%
- Equity multiple
- 1.77×
- Total profit
- $249,143
- Equity at exit
- $171,469
- IRR
- 29.7%
- Equity multiple
- 4.29×
- Total profit
- $1,057,936
- Equity at exit
- $99,431
Cash invested: $322,000 (down + closing). Projections, not guarantees.
Landlord ↔ Tenant lean methodology
- Overall (CITY)
- 0 Strongly Tenant-Friendly
- State California
- 18 Strongly Tenant-Friendly · D+13
- County
- — inherits STATE
- City Los Angeles
- 0 Strongly Tenant-Friendly · D+22
ZIP-level market 90062
- Rents YoY
- 14.5%
- Active inventory
- 86
- Price-to-rent
- 47.1×
Monthly cashflow live
- Estimated rent
- $16,265 high interval (Pro) →
- Mortgage (P&I)
- −$6,031
- Tax from tax record
- −$850 /mo · $10,195/yr
- Insurance
- −$479
- HOA
- −$0
- Vacancy / Maint / Mgmt
- −$3,416
- Net cashflow
- $5,490
Break-even live
8-unit breakdown (identical units grouped — click to expand)
| Units | Beds | Baths | Est. rent |
|---|---|---|---|
| 8× units | 1 | — | $16,264 |
| #1 | 1 | — | $2,033 |
| #2 | 1 | — | $2,033 |
| #3 | 1 | — | $2,033 |
| #4 | 1 | — | $2,033 |
| #5 | 1 | — | $2,033 |
| #6 | 1 | — | $2,033 |
| #7 | 1 | — | $2,033 |
| #8 | 1 | — | $2,033 |
| Total (8 units) | $16,265 | ||
UW: 25.0% down · 7.5% · 30yr · 1.5% tax · 5.0% vac · 8.0% maint · 8.0% mgmt
Financing live
Cash to close
- Down payment
- $287,500
- Closing costs
- $34,500
- Reserves months
- —
- Total cash needed
- —
Loan-product check · same deal, 3 products live
Conventional
25% down · 7.5% · 30yr
- Down + closing
- —
- Monthly P&I
- —
- Monthly cashflow
- —
- DSCR
- —
- Eligible?
- —
Personal DTI + credit; lowest rate.
DSCR
20% down · 8.5% · 30yr
- Down + closing
- —
- Monthly P&I
- —
- Monthly cashflow
- —
- DSCR
- —
- Eligible?
- —
No personal income docs; deal must DSCR.
Hard money
10% down · 12.0% · 12mo
- Down + closing
- —
- Monthly P&I
- —
- Monthly cashflow
- —
- DSCR
- —
- Eligible?
- —
Short-term bridge; refi at stabilization.
Listing history 15 events
-
2026-06-01days on market $1,150,000 Active 210 DOM
-
2026-05-31days on market $1,150,000 Active 209 DOM
-
2026-03-03historical Backup Offers Accepted
-
2026-01-29price $1,150,000
-
2025-11-03$1,250,000 Active
-
2024-04-10historical $1,550
-
2024-04-03$1,550
-
2012-05-15soldstatus $595,000 Closed
-
2012-04-16soldstatus $595,000
-
2012-01-18status Pending
-
2011-12-07$590,000 Active
-
2009-02-06historical
-
2008-08-05
-
2008-07-29historical
-
2007-11-05
ⓘ Source: listings_history table (triggers on properties + properties_extension) + one-shot
backfill from property_details.listing_events for pre-trigger history.
Tax reassessment forecast CA · Resets to sale price
- Current annual tax
- $10,195 · $850/mo
- Projected year-2 tax
- $10,195 · $850/mo
- Expected delta
- $0/yr ($0/mo · 0.0%)
ⓘ Screening estimate from a state-policy table — verify with the county assessor before closing.
Climate risk First Street
- Flood 1/10 Low FEMA zone X (shaded) · 0% chance over 30 yrs
- Wildfire 1/10 Low
- Heat 5/10 Major 7 d/yr ≥88°F today · 21 d/yr by 30 yrs out
- Wind 1/10 Low
- Air quality 5/10 Major 7 unhealthy d/yr today · 7 by 30 yrs out
Nearby sold comps map
Loading sold comps map…
Walkable amenities ~0.75 mi
Loading nearby amenities…
Taxation est. · year 1
- Rental income
- $195,180
- − Mortgage interest
- −$64,418
- − Property taxes
- −$10,195
- − Insurance
- −$5,750
- − Repairs & maintenance
- −$15,614
- − Management
- −$15,614
- − Depreciation
- −$33,455
- Taxable income
- $50,134
- Est. tax owed @ 24.0%
- −$12,032
- After-tax cash flow
- $53,846/yr
For passive investors: Depreciation is non-cash, so a rental often shows a tax loss while cash-flowing — sheltering income. Rental losses are passive: they offset passive income freely, and up to $25,000/yr can offset ordinary (W-2) income if you actively participate and your MAGI is under $100k (phasing out to $0 by $150k); unused losses carry forward. On sale, claimed depreciation is recaptured at up to 25%, and gains may owe capital-gains tax (a 1031 exchange can defer both). Figures are a year-1 estimate at your 24.0% rate — not tax advice; consult a CPA.
Schools (NCES district)
- District
- Los Angeles Unified
- NCES district ID
- 0622710
- Math proficiency
- 29% ▼ -4.00%
- Reading proficiency
- 54% ▲ 10.00%
- Median HH income
- $50,403
- Composite
- 35.67/100
- National rank
- #4875
- State rank
- #223 of 517 in CA
Livability — Los Angeles
- Score
- 68/100
- State rank
- #273
- US rank
- #9237
Category grades
Schools grade is shown separately in the Schools card above.
Census & demographics
- Census place
- Los Angeles, CA
- County
- Los Angeles County · 9,444,647 people
- City population
- 3,838,149
- Metro
- Los Angeles-Long Beach-Anaheim, CA
- Population (ZIP)
- 32,715
- Household income
- $67,701
- Rent vs Own
- Severe rent burden
- 1890.0
Population outlook (Los Angeles County) Hauer SSP2
- Today (2025)
- 10,940,515 people
- By 2030
- 11,256,481 · +2.9%
- By 2040
- 11,729,929 · +7.2%
- By 2050
- 11,948,407 · +9.2%
- By 2075
- 11,818,114 · +8.0%
- By 2100
- 10,842,928 · -0.9%
Race, ethnicity, and origin ACS 2023
- Neighborhood character
- Majority Hispanic (63%)
- Race & ethnicity
- Hispanic / Latino 63% Black 26% Two or more races 15% White 3% Asian 2% Native American 2%
- Hispanic origin (detail)
- Mexican 29%
- Common ancestry
- British 3%
- Foreign-born
- 38% · Canada, South Korea, Guatemala
- Languages at home
- 36% English-only · Spanish 61% Korean 1% French/Haitian/Cajun 1%
Political lean MEDSL · Los Angeles
- 2024 margin
- Solid D (+32.9) · D 64.8% · R 31.9% · Other 3.3%
- 2008→2024 swing
- -7.4pp toward R · 2008: 40.4pp · 2024: 32.9pp
- All cycles
- 2024: D+32.9 2020: D+44.2 2016: D+48.0 2012: D+40.0 2008: D+40.4
Not yet ingested
- Civics
- —
Market trends
- HPI YoY
- ▼ -670.48%
- Current HPI
- 500.9289
- Rent YoY
- ▲ 14.48%
- Metro
- Los Angeles-Long Beach-Anaheim, CA
- State GDP YoY
- ▲ 3.21%
- F500 in state
- 116
Industry mix (Fortune 500 HQ in CA)
| Industry | F500 HQs | Revenue |
|---|---|---|
| Technology | 27 | $1,492B |
|
||
| Financial Services | 3 | $174B |
|
||
| Retail | 3 | $44B |
|
||
| Insurance | 3 | $26B |
|
||
| Media / Entertainment | 2 | $115B |
|
||
| Pharmaceuticals / Biotech | 2 | $62B |
|
||
Price history
+94.9% since first listed13 events — show timeline
- 2026-03-03 Contingent — TheMLS
- 2026-01-29 Price Changed $1,150,000 TheMLS
- 2025-11-03 Listed $1,250,000 TheMLS
- 2024-04-10 Rental Removed $1,550 APPFOLIO
- 2024-04-03 Listed for Rent $1,550 APPFOLIO
- 2012-05-15 Sold (MLS) $595,000 TheMLS
- 2012-04-16 Sold (Public Records) $595,000 Public Records
- 2012-01-18 Pending — TheMLS
- 2011-12-07 Listed $590,000 TheMLS
- 2009-02-06 Delisted — TheMLS
- 2008-08-05 Listed — TheMLS
- 2008-07-29 Delisted — TheMLS
- 2007-11-05 Listed — TheMLS
Property tax history
-1.6%/yrLatest (2025): $10,195 · +1.5% YoY. Source: county tax records.
Cash-flow waterfall
monthlySold comps — $/sqft
last 12 mo · ≤1 miLoading sold comps…