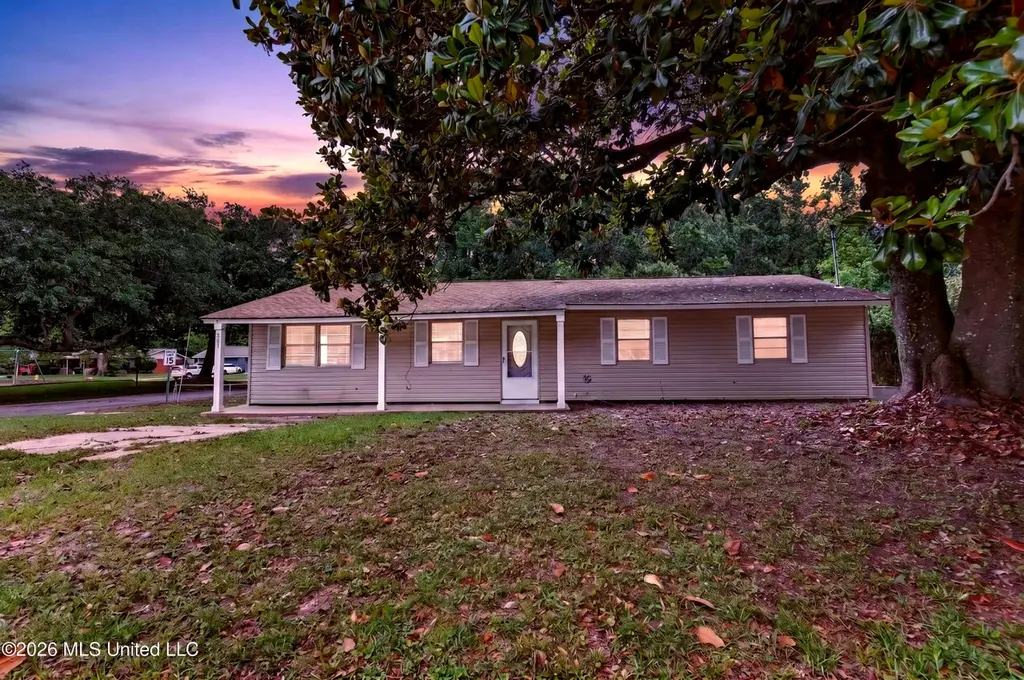
329 Park Dr · Biloxi, MS
Flood risk 6/10 · Moderate
- FEMA flood zone
- X (unshaded)
- Chance of flooding over 30 yrs
- 0.74%
- Est. flood insurance / yr
- $507 – $1,088
Fire risk 1/10 · Minimal
- Est. fire insurance / yr
- $1,241 – $2,305
Heat risk 10/10 · Severe
- Hot days now (above 106°F)
- 7 days/yr
- Hot days in 30 yrs
- 22 days/yr
Wind risk 9/10 · Severe
- Chance of severe wind over 30 yrs
- 99.0%
Air-quality risk 3/10 · Minor
- Unhealthy air days now
- 2 days/yr
- Unhealthy air days in 30 yrs
- 3 days/yr
Risk factors via First Street. Map © Google.
Why this score? — see what drove the C grade
The composite is a weighted blend of 9 inputs, each scored 0–100. Each bar is that input's sub-score; the figure is the points it added to the 100-point composite (weight × sub-score).
- Cash flow +20.4/30.0
- ARV discount +10.3/15.0
- DSCR +6.5/10.0
- 1% rule +4.8/10.0
- Schools +4.5/10.0
- Livability +4.0/5.0
- Rent growth +2.5/5.0
- Condition / age +2.5/5.0
- Appreciation +0.0/10.0
$157,900
🖨 Deal sheet 📄 Offer letter ✓ Due diligence
Listing remarks
Are you looking for your next investment or next place to call home? This spacious 4-bedroom, 1-bathroom gem is waiting for you to make this your own. Step inside to discover all this home has to offer. Laminated floors, refrigerator and stove included. The spacious kitchen offers ample cabinet and counter space. Enjoy sitting around the table for both everyday meals and entertaining guests. Each of the four bedrooms offers natural light and plenty of closet space. Enjoy a large backyard ideal for outdoor activities and gatherings. Conveniently located in a friendly neighborhood close to schools, restaurants and shopping. This move-in ready home is waiting for you to start creating memories
Key facts
- Ample counter space
- Spacious kitchen
- Large backyard
Tags
Property features AI
Finance
- Other: Zoned General Residential
Exterior
- Parking: Driveway (2 parking spaces); Paved driveway
- Utilities: Public water; Public sewer; Electricity connected; Water connected
- Home design: Single-family house; One story; Move-in ready
- Construction: Siding exterior; Shingle roof; Slab foundation; Built in public records (year available in records)
- Exterior features: Front porch; Private yard; Back yard fencing; Corner lot
Interior
- Kitchen: Appliances listed in remarks
- Flooring: Simulated wood flooring
- Bathrooms: 1 full bathroom
- Heating & cooling: Central heating; Central air conditioning
- Interior features: Ceiling fans
- Laundry & utility: Washer hookup; Electric dryer hookup; Dedicated laundry room
Neighborhood map
What this means for you Summary
Snapshot
- This is a 3-bed/1.0-bath single-family listed at $158k.
Deal economics
- At list price, monthly cash flow is $206 ($2k/yr) — positive.
- The deal already cash-flows at list — no discount required.
- To meet the 1% rule (rent ≥ 1% of price), the offer needs to be $154k (2.3% below list).
- Recommended offer: $153k (3.0% below list) — sets the bar for market timing.
- Cap rate 7.9% vs local median 3.5% in Biloxi — top-decile yield for the area; either an underpriced asset or a hidden risk that comps aren't pricing in. Stress-test before assuming the spread holds.
Location & tenants
- Location reads 79/100 on livability (#6 in MS, #2,141 nationally) — a middle-class / working-renter tenant base. Strengths: crime A+, cost of living A+, housing A+; Watch: commute D+, amenities F, employment D-.
- Biloxi Public School District (urban): math 60% / reading 48% proficiency, ranked #7 of 130 in MS (top 5%) — acceptable for families but not a draw, mixed tenant base, ~2y average lease.
- Zoned schools: Popps Ferry Elementary School (math 53% / reading 58%, grade C, #40 of 375 statewide, top 11%, 552 students, 100% FRL); Biloxi Junior High (math 60% / reading 43%, grade C, #27 of 179 statewide, top 16%, 881 students, 100% FRL); Biloxi High School (math 65% / reading 53%, grade C+, #7 of 197 statewide, top 3%, 1,728 students, 100% FRL) — zoned schools average 100% FRL vs 59% district-wide (40 pts higher); higher-poverty schools than district average — tighter screening recommended.
- Market conditions: Rents flat; 201 active listings in the ZIP; 20 comparable units currently listed for rent nearby; rentals at typical pace (median 21d on market — plan ~3-4 weeks tenant-placement turnaround); 45% of comp listings sitting > 30 days — soft ceiling on asking rent; 2,194 units permitted in Harrison County in 2024 (0 in 5+ unit buildings).
- This rent runs 34% of the median local income ($54k/yr) — at the standard rent-burdened threshold; future hikes will face affordability resistance.
Forward outlook
- Local home prices are declining (-3.0%/yr); year-one equity from $1k of loan paydown is wiped out by about $5k of value loss. Plan a longer hold.
- Harrison County population projected at +27% by 2050 — long-run rental-demand tailwind backs the buy-and-hold thesis.
Negotiation context
- It's been on market 49 days — a 3% lower offer ($153k) is reasonable based on typical stale-listing flexibility.
- 4 sale attempts since 2y ago with the ask held roughly flat each time — persistent listings suggest the price (not the market) is what's stuck; bring a comps-based counter.
Risks & watch-outs
- Climate carrying-cost: major flood risk; severe wind risk, 99% chance of damaging wind over 30y; extreme-heat days projected 7→22/yr by 2055 (HVAC capex compounding) — expect insurance premiums to compound above CPI over the hold.
Questions for the listing agent
- It's been on market 49 days. Have you received any prior offers? Is the seller open to a 3% concession, seller financing, or rate buy-down credit?
- Built in 1964 — when were the roof, HVAC, electrical panel, plumbing, and water heater last replaced?
- Is there a deadline driving the sale (1031 exchange, divorce, estate, relocation)? That informs how much negotiation room exists.
- What's the average days-on-market for RENTAL listings here right now (not sales)? A rising rental-DOM trend means longer vacancies and softer asking-rent achievability than the comps imply.
- What's the recent tenant-quality profile in this submarket — average credit score on applications, eviction rate, late-payment / NSF rate, and stable-employment percentage? A property-management company in the area should have these aggregated.
- How much new for-sale + rental construction is in the pipeline within 1–3 miles? Heavy new supply typically softens prices + rents 12–24 months out; constrained supply supports both.
Investment metrics
- 1% rule
- 0.98% ✗
- Cap rate
- 7.86%
- Cash-on-cash
- 5.60%
- DSCR
- 1.25
- GRM
- 8.5
CMA / ARV
- ARV (median comp)
- $168,509
- List price
- $157,900
- Delta
- -6.30%
- Verdict
- FAIR
- Comps
- 20 within 1.0 mi
Show comp detail 12 sales within ~0.75 mi
| Address | Dist | Beds/Ba | Sqft | Sold | Price | $/sf | Match |
|---|---|---|---|---|---|---|---|
| 2167 Sherwood Pl | 0.17mi | 3/2.0 | 1,200 (-4%) | 1mo | $209,000 | $174 | 81 |
| 346 Tanglewood Dr | 0.20mi | 3/2.0 | 1,245 (-0%) | 7mo | $200,000 | $161 | 80 |
| 331 Greenwood Dr | 0.35mi | 3/1.5 | 1,275 (+2%) | 0mo | $190,000 | $149 | 78 |
| 2160 Driftwood Dr | 0.21mi | 3/2.0 | 1,200 (-4%) | 9mo | $158,000 | $132 | 72 |
| 379 Greenwood Dr | 0.25mi | 3/1.5 | 1,350 (+8%) | 6mo | $139,900 | $104 | 68 |
| 2085 Pat Ln | 0.20mi | 3/2.0 | 1,122 (-10%) | 11mo | $237,000 | $211 | 61 |
| 2146 Driftwood Dr | 0.19mi | 3/2.0 | 1,406 (+13%) | 8mo | $178,000 | $127 | 59 |
| 375 Nelson Rd | 0.65mi | 3/2.0 | 1,304 (+4%) | 1mo | $195,000 | $150 | 57 |
| 329 West Dr | 0.57mi | 3/2.0 | 1,188 (-5%) | 13mo | $119,000 | $100 | 50 |
| 389 Belvedere Cir | 0.51mi | 4/2.0 (+1) | 1,194 (-4%) | 12mo | $179,000 | $150 | 50 |
| 2383 Trafalgar Dr | 0.74mi | 3/2.0 | 1,333 (+7%) | 11mo | $186,000 | $140 | 41 |
| 303 West Dr | 0.66mi | 3/2.0 | 1,079 (-14%) | 14mo | $145,000 | $134 | 31 |
Match score weights: distance 35% · size 25% · config 20% · recency 20%. Top-matched comps best support the ARV.
Projected returns pro-forma
-3.0% appreciation · 0.05% rent growth · sell at horizon
- IRR
- -10.8%
- Equity multiple
- 0.62×
- Total profit
- $-16,918
- Equity at exit
- $23,543
- IRR
- -6.1%
- Equity multiple
- 0.66×
- Total profit
- $-15,115
- Equity at exit
- $13,652
Cash invested: $44,212 (down + closing). Projections, not guarantees.
Landlord ↔ Tenant lean methodology
- Overall (STATE)
- 90 Strongly Landlord-Friendly
- State Mississippi
- 90 Strongly Landlord-Friendly · R+11
- County
- — inherits STATE
- City
- — inherits STATE
ZIP-level market 39531
- Home prices YoY
- -13.0%
- Rents YoY
- 0.1%
- Active inventory
- 201
- Price-to-rent
- 8.5×
Monthly cashflow live
- Estimated rent
- $1,542 high interval (Pro) →
- Mortgage (P&I)
- −$828
- Tax from tax record
- −$118 /mo · $1,416/yr
- Insurance
- −$66
- HOA
- −$0
- Vacancy / Maint / Mgmt
- −$324
- Net cashflow
- $206
Break-even live
UW: 25.0% down · 7.5% · 30yr · 1.5% tax · 5.0% vac · 8.0% maint · 8.0% mgmt
Financing live
Cash to close
- Down payment
- $39,475
- Closing costs
- $4,737
- Reserves months
- —
- Total cash needed
- —
Loan-product check · same deal, 3 products live
Conventional
25% down · 7.5% · 30yr
- Down + closing
- —
- Monthly P&I
- —
- Monthly cashflow
- —
- DSCR
- —
- Eligible?
- —
Personal DTI + credit; lowest rate.
DSCR
20% down · 8.5% · 30yr
- Down + closing
- —
- Monthly P&I
- —
- Monthly cashflow
- —
- DSCR
- —
- Eligible?
- —
No personal income docs; deal must DSCR.
Hard money
10% down · 12.0% · 12mo
- Down + closing
- —
- Monthly P&I
- —
- Monthly cashflow
- —
- DSCR
- —
- Eligible?
- —
Short-term bridge; refi at stabilization.
Rent comps 20 comps
| Address | Beds | Baths | Sqft | Rent | $/sqft | DOM | Units | Dist |
|---|---|---|---|---|---|---|---|---|
| 310 Abbey Ct Biloxi, MS | 2.0–3.0 | 1.0–2.0 | 1062 | $1,275 | $1.20 | 21d | 17 | 0.40mi |
| 330 Belvedere Dr Biloxi, MS | 3.0 | 1.0 | 1000 | $1,200 | $1.20 | 13d | 1 | 0.47mi |
| 340 Hiller Dr Biloxi, MS | 3.0 | 2.0 | 1447 | $1,749 | $1.21 | 21d | 1 | 0.70mi |
| 390 Bertucci Blvd Biloxi, MS | 3.0 | 2.0 | 1358 | $1,800 | $1.33 | 43d | 1 | 0.72mi |
| 2386 Merlin Cv Biloxi, MS | 3.0 | 2.0 | 1500 | $1,600 | $1.07 | 13d | 1 | 0.75mi |
| 2387 Trafalgar Dr Biloxi, MS | 3.0 | 2.0 | 1375 | $1,700 | $1.24 | 21d | 1 | 0.78mi |
| 495 Popps Ferry Rd Biloxi, MS | 2.0 | 1.5–2.5 | 1455 | $1,850 | $1.27 | 43d | 2 | 0.91mi |
| 2046 Beach Blvd Biloxi, MS | 2.0 | 2.0 | 1152 | $2,200 | $1.91 | 21d | 1 | 1.02mi |
| 1910 Southern Ave Biloxi, MS | 1.0–2.0 | 1.0–1.5 | 725 | $1,200 | $1.66 | 13d | 2 | 1.11mi |
| 2508 Shady Ln Biloxi, MS | 3.0 | 2.0 | 1431 | $2,100 | $1.47 | 43d | 1 | 1.15mi |
| 2068 Beach Blvd Unit 142 Biloxi, MS | 2.0 | 2.0 | 1001 | $1,600 | $1.60 | 13d | 1 | 1.18mi |
| 2068 Beach Blvd Unit 202 Biloxi, MS | 2.0 | 2.0 | 1001 | $1,600 | $1.60 | 43d | 1 | 1.18mi |
| 2068 Beach Blvd Unit 342 Biloxi, MS | 2.0 | 2.0 | 1001 | $1,550 | $1.55 | 13d | 1 | 1.18mi |
| 245 Mc Donnell Ave Biloxi, MS | 2.0 | 1.0 | 775 | $1,595 | $2.06 | 21d | 1 | 1.19mi |
| 245 Mc Donnell Ave Unit I-164 Biloxi, MS | 2.0 | 1.0 | 745 | $1,195 | $1.60 | 43d | 1 | 1.23mi |
| 245 Mc Donnell Ave Unit E-131 Biloxi, MS | 2.0 | 1.0 | 745 | $995 | $1.34 | 43d | 1 | 1.23mi |
| 1737 James Buchanan Dr Biloxi, MS | 3.0 | 2.0 | 1328 | $1,650 | $1.24 | 43d | 1 | 1.32mi |
| 258 Stennis Dr Biloxi, MS | 2.0 | 1.0–2.0 | 1040 | $1,245 | $1.20 | 13d | 1 | 1.39mi |
| 258 Stennis Dr Biloxi, MS | 2.0 | 1.0 | 930 | $1,100 | $1.18 | 43d | 1 | 1.39mi |
| 2436 Beach Blvd Biloxi, MS | 3.0 | 2.0 | 1260 | $975 | $0.77 | 44d | 1 | 1.40mi |
Listing history 23 events
-
2026-06-18days on market $157,900 Active 49 DOM
-
2026-06-17days on market $157,900 Active 48 DOM
-
2026-06-16days on market $157,900 Active 47 DOM
-
2026-06-15days on market $157,900 Active 46 DOM
-
2026-06-14days on market $157,900 Active 44 DOM
-
2026-06-13days on market $157,900 Active 43 DOM
-
2026-06-09days on market $157,900 Active 40 DOM
-
2026-06-08days on market $157,900 Active 39 DOM
-
2026-06-07days on market $157,900 Active 38 DOM
-
2026-06-05days on market $157,900 Active 35 DOM
-
2026-06-03pricedays on market $157,900 Active 34 DOM
-
2026-06-02days on market $164,900 Active 33 DOM
-
2026-06-01days on market $164,900 Active 32 DOM
-
2026-05-31days on market $164,900 Active 31 DOM
-
2026-05-30days on market $164,900 Active 30 DOM
-
2026-04-29$164,900 Active 755-char remark
-
2025-08-29historical
-
2024-12-19historical $1,200
-
2024-12-05historical
-
2024-12-04$182,500 Active
-
2024-11-22$1,200
-
2024-08-22price $182,500
-
2024-06-04$192,500 Active
ⓘ Source: listings_history table (triggers on properties + properties_extension) + one-shot
backfill from property_details.listing_events for pre-trigger history.
Tax reassessment forecast MS · Resets to sale price
- Current annual tax
- $1,416 · $118/mo
- Projected year-2 tax
- $1,416 · $118/mo
- Expected delta
- $0/yr ($0/mo · 0.0%)
ⓘ Screening estimate from a state-policy table — verify with the county assessor before closing.
Climate risk First Street
- Flood 6/10 Major FEMA zone X (unshaded) · 74% chance over 30 yrs
- Wildfire 1/10 Low
- Heat 10/10 Extreme 7 d/yr ≥106°F today · 22 d/yr by 30 yrs out
- Wind 9/10 Extreme 99% chance of damaging wind over 30 yrs
- Air quality 3/10 Moderate 2 unhealthy d/yr today · 3 by 30 yrs out
Nearby sold comps map
Loading sold comps map…
Walkable amenities ~0.75 mi
Loading nearby amenities…
Taxation est. · year 1
- Rental income
- $18,504
- − Mortgage interest
- −$8,845
- − Property taxes
- −$1,416
- − Insurance
- −$790
- − Repairs & maintenance
- −$1,480
- − Management
- −$1,480
- − Depreciation
- −$4,593
- Taxable loss
- −$101
- Est. tax savings @ 24.0%
- +$24
- After-tax cash flow
- $2,500/yr
For passive investors: Depreciation is non-cash, so a rental often shows a tax loss while cash-flowing — sheltering income. Rental losses are passive: they offset passive income freely, and up to $25,000/yr can offset ordinary (W-2) income if you actively participate and your MAGI is under $100k (phasing out to $0 by $150k); unused losses carry forward. On sale, claimed depreciation is recaptured at up to 25%, and gains may owe capital-gains tax (a 1031 exchange can defer both). Figures are a year-1 estimate at your 24.0% rate — not tax advice; consult a CPA.
Schools (NCES district)
- District
- Biloxi Public School District
- NCES district ID
- 2800630
- Math proficiency
- 60% ▼ -7.00%
- Reading proficiency
- 48% ▼ -3.00%
- Median HH income
- $40,608
- Composite
- 45.26/100
- National rank
- #2657
- State rank
- #7 of 130 in MS
Livability — Biloxi
- Score
- 79/100
- State rank
- #6
- US rank
- #2141
Category grades
Schools grade is shown separately in the Schools card above.
Census & demographics
- Census place
- Biloxi, MS
- County
- Harrison County · 178,171 people
- City population
- 63,281
- Metro
- Gulfport-Biloxi, MS
- Population (ZIP)
- 18,918
- Household income
- $54,218
- Rent vs Own
- Severe rent burden
- 1110.0
Population outlook (Harrison County) Hauer SSP2
- Today (2025)
- 228,444 people
- By 2030
- 241,942 · +5.9%
- By 2040
- 267,531 · +17.1%
- By 2050
- 291,062 · +27.4%
- By 2075
- 346,711 · +51.8%
- By 2100
- 378,165 · +65.5%
Race, ethnicity, and origin ACS 2023
- Neighborhood character
- Diverse neighborhood (Simpson 0.60)
- Race & ethnicity
- White 60% Black 18% Two or more races 12% Hispanic / Latino 11% Asian 2%
- Hispanic origin (detail)
- Mexican 5%
- Common ancestry
- Lithuanian 6% Slovak 2% Serbian 1%
- Foreign-born
- 8% · Canada, Vietnam
- Languages at home
- 89% English-only · Spanish 6% Arabic 1% Other Indo-European 1%
Political lean MEDSL · Harrison
- 2024 margin
- Strong R (+28.9) · D 35.0% · R 63.9% · Other 1.1%
- 2008→2024 swing
- -2.9pp toward R · 2008: -26.0pp · 2024: -28.9pp
- All cycles
- 2024: R+28.9 2020: R+25.2 2016: R+30.7 2012: R+26.6 2008: R+26.0
Not yet ingested
- Civics
- —
Market trends
- HPI YoY
- ▼ -28.97%
- Current HPI
- 193.4018
- Rent YoY
- ▬ 0.05%
- Metro
- Gulfport-Biloxi, MS
- State GDP YoY
- —
- F500 in state
- 0
Price history
-18.0% since first listed9 events — show timeline
- 2026-06-03 Price Changed $157,900 MLSU
- 2026-04-29 Listed $164,900 MLSU
- 2025-08-29 Listing Removed — MLSU
- 2024-12-19 Rental Removed $1,200 MLSU
- 2024-12-05 Listing Removed — MLSU
- 2024-12-04 Listed $182,500 MLSU
- 2024-11-22 Listed for Rent $1,200 MLSU
- 2024-08-22 Price Changed $182,500 MLSU
- 2024-06-04 Listed $192,500 MLSU
Property tax history
+1.2%/yrLatest (2025): $1,416 · +4.1% YoY. Source: county tax records.
Cash-flow waterfall
monthlySold comps — $/sqft
last 12 mo · ≤1 miLoading sold comps…