140 W 23rd St Unit 4A · New York, NY
Flood risk 1/10 · Minimal
- FEMA flood zone
- X (unshaded)
- Chance of flooding over 30 yrs
- 0.0%
- Est. flood insurance / yr
- $507 – $1,088
Fire risk 1/10 · Minimal
- Est. fire insurance / yr
- $691 – $1,283
Heat risk 7/10 · Major
- Hot days now (above 99°F)
- 7 days/yr
- Hot days in 30 yrs
- 15 days/yr
Wind risk 6/10 · Moderate
- Chance of severe wind over 30 yrs
- 27.0%
Air-quality risk 4/10 · Minor
- Unhealthy air days now
- 5 days/yr
- Unhealthy air days in 30 yrs
- 7 days/yr
Risk factors via First Street. Map © Google.
Why this score? — see what drove the D- grade
The composite is a weighted blend of 9 inputs, each scored 0–100. Each bar is that input's sub-score; the figure is the points it added to the 100-point composite (weight × sub-score).
- Cash flow +8.0/30.0
- Appreciation +7.7/10.0
- Schools +5.0/10.0
- Rent growth +4.3/5.0
- Livability +3.8/5.0
- 1% rule +3.1/10.0
- Condition / age +2.5/5.0
- DSCR +2.1/10.0
- ARV discount +0.0/15.0
$888,888
🖨 Deal sheet (PDF) 📄 Offer letter ✓ Due diligence
Listing remarks
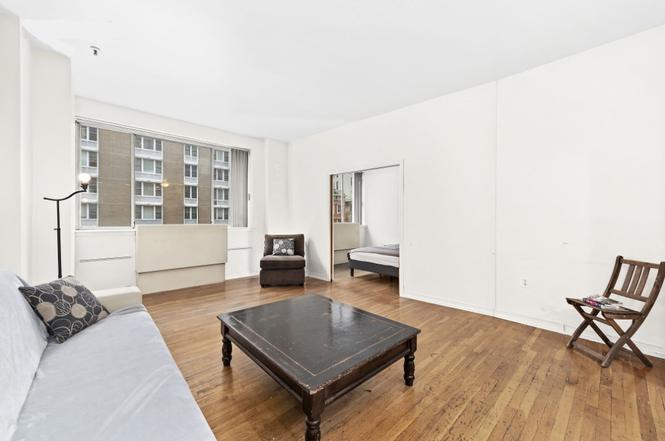
Spacious 1 bedroom with a lot of light, lots of closet spaces, Washer Dryer within the unit, dishwasher. .. Located in in a super quiet elevator building in the middle of everything thing. No doorman but video intercom with double door. Kitchen and bathroom are in original condition. The picture of lobby is prior to its renovation. Dedicated storage available in basement.
Key facts
- Dishwasher
- Video intercom
- $436 HOA
Tags
Property features AI
Finance
- HOA & community: Monthly association fee of $436; Pets allowed in building
Exterior
- Home design: Condominium building (Claret Commons); Entry on level 4
- Construction: Elevator in building
- Exterior features: Private outdoor space (under 60 sqft); Building storage
Interior
- Kitchen: Dishwasher
- Bedrooms: 3 rooms total (includes bedrooms and living areas)
- Flooring: Hardwood floors
- Bathrooms: 1 full bathroom
- Interior features: Unfurnished; Storage; South-facing view
- Laundry & utility: Washer; Dryer; In-unit laundry
Neighborhood map
What this means for you Summary
Snapshot
- This is a 1-bed/1.0-bath single-family listed at $889k.
Deal economics
- At list price, monthly cash flow is $-901 ($-11k/yr) — negative.
- To cash-flow at today's rent, offer at most $759k (14.7% below list).
- To meet the 1% rule (rent ≥ 1% of price), the offer needs to be $719k (19.1% below list).
- Recommended offer: $719k (19.1% below list) — sets the bar for 1% rule.
- Cap rate 5.1% vs local median 2.6% in New York — top-decile yield for the area; either an underpriced asset or a hidden risk that comps aren't pricing in. Stress-test before assuming the spread holds.
Location & tenants
- Location reads 75/100 on livability (#268 in NY, #4,188 nationally) — a middle-class / working-renter tenant base. Strengths: amenities A+, commute A+, health & safety A; Watch: crime F, cost of living F.
- Zoned schools: Elm Tree Elementary School (math 27% / reading 52%, grade F, #1,444 of 2,108 statewide, top 71%, 806 students, 94% FRL); Mark Twain Is 239 For The Gifted And Talented (math 90% / reading 96%, grade A+, #6 of 729 statewide, top 1%, 1,207 students, 44% FRL); Midwood High School (math 94% / reading 96%, grade A+, #83 of 1,100 statewide, top 8%, 4,062 students, 73% FRL).
- Market conditions: Rents rising fast (+7.1%/yr); 465 active listings in the ZIP; 40 comparable units currently listed for rent nearby; rentals leasing fast (median 10d on market — plan ~1-2 weeks tenant-placement turnaround); high-income renter base; 4,467 units permitted in New York County in 2024 (4,463 in 5+ unit buildings).
- At $7,188/mo this rent would consume 59% of the median local household income ($146k/yr) (locally 3446% of renters already pay >50% of income on rent) — very limited rent-growth headroom before tenants either downsize or default.
Forward outlook
- In year one you build about $54k of equity ($6k loan paydown + $48k appreciation (5.3% local appreciation)).
- New York County population projected at +21% by 2050 — long-run rental-demand tailwind backs the buy-and-hold thesis.
- By year 2, paydown + projected appreciation supports a ~$86k cash-out refi (75% LTV) — recoverable capital for the next deal without selling this one.
Negotiation context
- It's been on market 197 days — a 12% lower offer ($782k) is reasonable based on typical stale-listing flexibility.
Risks & watch-outs
- Watch-outs: built in 1888 — expect roof / HVAC / electrical / plumbing capex.
- Climate carrying-cost: major wind risk, 27% chance of damaging wind over 30y; extreme-heat days projected 7→15/yr by 2055 (HVAC capex compounding) — expect insurance premiums to compound above CPI over the hold.
Questions for the listing agent
- What do current leases actually rent for vs. the listed asking? Can we see a recent rent roll and the last 12 months of T-12 income?
- It's been on market 197 days. Have you received any prior offers? Is the seller open to a 19% concession, seller financing, or rate buy-down credit?
- Built in 1888 — when were the roof, HVAC, electrical panel, plumbing, and water heater last replaced?
- What does the HOA fee cover, when was the last increase, and are there any pending special assessments or reserve-fund shortfalls?
- Why hasn't it sold? Are there any deal-killer items the seller is aware of (foundation, flood, title, zoning, code violations)?
- Is there a deadline driving the sale (1031 exchange, divorce, estate, relocation)? That informs how much negotiation room exists.
- Schools are B-rated — typically a magnet for longer-tenancy family renters. What's the average tenant stay here, and is there a school-zone premium baked into asking?
- Crime grade is F in this area — have there been break-ins, vandalism, or insurance claims at this property in the last 3 years? What carrier currently insures it and at what premium?
- The area grade is low — what's the realistic commute time and amenity access for the typical tenant pool here? Any planned neighborhood developments (good or bad) we should know about?
- What's the average days-on-market for RENTAL listings here right now (not sales)? A rising rental-DOM trend means longer vacancies and softer asking-rent achievability than the comps imply.
- What's the recent tenant-quality profile in this submarket — average credit score on applications, eviction rate, late-payment / NSF rate, and stable-employment percentage? A property-management company in the area should have these aggregated.
- How much new for-sale + rental construction is in the pipeline within 1–3 miles? Heavy new supply typically softens prices + rents 12–24 months out; constrained supply supports both.
Investment metrics
- 1% rule
- 0.81% ✗
- Cap rate
- 5.08%
- Cash-on-cash
- -4.34%
- DSCR
- 0.81
- GRM
- 10.3
CMA / ARV
- ARV (on-the-fly)
- $720,275
- Comps found
- 1
Show comp detail 1 sale within ~0.75 mi
| Address | Dist | Beds/Ba | Sqft | Sold | Price | $/sf | Match |
|---|---|---|---|---|---|---|---|
| 142 East 16th St Unit 18C | 0.71mi | 1/1.0 | 570 (-7%) | 12mo | $670,000 | $1,175 | 45 |
Match score weights: distance 35% · size 25% · config 20% · recency 20%. Top-matched comps best support the ARV.
Projected returns pro-forma
5.34% appreciation · 7.06% rent growth · sell at horizon
- IRR
- 11.9%
- Equity multiple
- 1.79×
- Total profit
- $196,013
- Equity at exit
- $522,411
- IRR
- 14.4%
- Equity multiple
- 3.84×
- Total profit
- $705,745
- Equity at exit
- $917,456
Cash invested: $248,889 (down + closing). Projections, not guarantees.
Landlord ↔ Tenant lean methodology
- Overall (CITY)
- 0 Strongly Tenant-Friendly
- State New York
- 15 Strongly Tenant-Friendly · D+10
- County
- — inherits STATE
- City New York
- 0 Strongly Tenant-Friendly · D+34
ZIP-level market 10011
- Home prices YoY
- 2.6%
- Rents YoY
- 7.1%
- Active inventory
- 465
- Price-to-rent
- 10.3×
Monthly cashflow live
- Estimated rent
- $7,188 high interval (Pro) →
- Mortgage (P&I)
- −$4,661
- Tax est. 1.5%
- −$1,111 /mo · $13,333/yr
- Insurance
- −$370
- HOA
- −$436
- Vacancy / Maint / Mgmt
- −$1,509
- Net cashflow
- $-901
Break-even live
Sensitivity live
| Price | -10% $-286 | -5% $-594 | +0% $-901 | +5% $-1,208 | +10% $-1,515 |
|---|---|---|---|---|---|
| Rent | -10% $-1,469 | -5% $-1,185 | +0% $-901 | +5% $-617 | +10% $-333 |
| Rate | -1.0pp $-453 | -0.5pp $-675 | base $-901 | +0.5pp $-1,131 | +1.0pp $-1,365 |
UW: 25.0% down · 7.5% · 30yr · 1.5% tax · 5.0% vac · 8.0% maint · 8.0% mgmt
Financing live
Cash to close
- Down payment
- $222,222
- Closing costs
- $26,667
- Reserves months
- —
- Total cash needed
- —
Loan-product check · same deal, 3 products live
Conventional
25% down · 7.5% · 30yr
- Down + closing
- —
- Monthly P&I
- —
- Monthly cashflow
- —
- DSCR
- —
- Eligible?
- —
Personal DTI + credit; lowest rate.
DSCR
20% down · 8.5% · 30yr
- Down + closing
- —
- Monthly P&I
- —
- Monthly cashflow
- —
- DSCR
- —
- Eligible?
- —
No personal income docs; deal must DSCR.
Hard money
10% down · 12.0% · 12mo
- Down + closing
- —
- Monthly P&I
- —
- Monthly cashflow
- —
- DSCR
- —
- Eligible?
- —
Short-term bridge; refi at stabilization.
Rent comps 40 comps
| Address | Beds | Baths | Sqft | Rent | $/sqft | DOM | Units | Dist |
|---|---|---|---|---|---|---|---|---|
| 120 W 21st St New York, NY | 2.0 | 1.0–2.0 | 676 | $7,070 | $10.46 | 6d | 14 | 0.09mi |
| 160 W 24th St New York, NY | 2.0 | 1.0–2.0 | 731 | $7,896 | $10.79 | 0d | 13 | 0.12mi |
| 180 W 20th St #1202 New York, NY | 2.0 | 1.0–2.0 | 791 | $9,465 | $11.96 | 1d | 3 | 0.17mi |
| 776 6th Ave New York, NY | 2.0 | 1.0–2.0 | 742 | $7,700 | $10.37 | 0d | 19 | 0.17mi |
| 43 W 27th St #1055 New York, NY | 2.0 | 1.0 | 740 | $9,940 | $13.43 | 26d | 1 | 0.26mi |
| 101 W 15th St New York, NY | 1.0 | 1.0 | 562 | $9,550 | $16.98 | 3d | 2 | 0.34mi |
| 244 W 29th St Unit 2149 New York, NY | 1.0 | 1.0 | 490 | $9,720 | $19.84 | 8d | 2 | 0.36mi |
| 130 W 15th St #1383 New York, NY | 1.0–2.0 | 1.0–2.0 | 844 | $8,990 | $10.65 | 1d | 2 | 0.36mi |
| 108 W 15th St #205 New York, NY | 1.0–2.0 | 1.0 | 697 | $6,050 | $8.67 | 5d | 2 | 0.37mi |
| 243 W 28th St #2143 New York, NY | 1.0 | 1.0 | 580 | $8,960 | $15.45 | 20d | 1 | 0.38mi |
| 309 5th Ave New York, NY | 1.0 | 1.0 | 597 | $7,596 | $12.72 | 9d | 13 | 0.52mi |
| 290 3rd Ave #279 New York, NY | 1.0 | 1.0 | 607 | $9,740 | $16.03 | 5d | 2 | 0.62mi |
| 1 Union Sq S #1174 New York, NY | 2.0 | 1.0–2.0 | 775 | $10,120 | $13.06 | 12d | 3 | 0.65mi |
| 290 W 12th St #1592 New York, NY | 1.0–2.0 | 1.0–2.0 | 515 | $7,110 | $13.81 | 9d | 2 | 0.66mi |
| 435 W 31st St New York, NY | 2.0 | 1.0–2.0 | 747 | $7,018 | $9.39 | 0d | 34 | 0.68mi |
| 360 W 34th St New York, NY | 2.0 | 1.0–1.5 | 632 | $6,100 | $9.65 | 9d | 3 | 0.70mi |
| 815 Broadway #204 New York, NY | 1.0 | 1.0 | 522 | $8,250 | $15.80 | 9d | 1 | 0.70mi |
| 535 W 23rd St #1584 New York, NY | 2.0 | 1.0–2.0 | 600 | $8,030 | $13.38 | 1d | 3 | 0.70mi |
| 177 Waverly Pl Unit 1075286P New York, NY | 1.0 | 1.0 | 452 | $10,000 | $22.12 | 26d | 1 | 0.71mi |
| 155 E 31st St #2190 New York, NY | 1.0–2.0 | 1.0–1.5 | 725 | $5,610 | $7.74 | 9d | 2 | 0.75mi |
| 282 11th Ave New York, NY | 2.0 | 1.0–2.0 | 960 | $7,735 | $8.05 | 0d | 1 | 0.76mi |
| 250 E 21st St Unit 8D New York, NY | 1.0 | 1.0 | 688 | $9,525 | $13.84 | 4d | 1 | 0.76mi |
| 141 E 33rd St #1278 New York, NY | 2.0 | 1.0–1.5 | 683 | $6,230 | $9.12 | 9d | 3 | 0.77mi |
| 525 W 28th St New York, NY | 2.0 | 1.0–2.0 | 1116 | $6,612 | $5.92 | 9d | 1 | 0.77mi |
| 87 Perry St New York, NY | 2.0 | 2.0 | 748 | $18,500 | $24.73 | 26d | 1 | 0.77mi |
| 30 Park Ave #1347 New York, NY | 2.0 | 1.0 | 950 | $7,890 | $8.31 | 3d | 3 | 0.78mi |
| 364 6th Ave Unit 1023432P New York, NY | 1.0 | 1.0 | 441 | $9,135 | $20.71 | 24d | 1 | 0.79mi |
| 41 Park Ave New York, NY | 2.0 | 1.0–2.0 | 815 | $6,555 | $8.04 | 9d | 3 | 0.83mi |
| 535 Hudson St #1032 New York, NY | 1.0–2.0 | 1.0 | 550 | $6,030 | $10.96 | 9d | 2 | 0.87mi |
| 101 E 10th St #1153 New York, NY | 1.0–2.0 | 1.0–2.0 | 575 | $6,630 | $11.53 | 1d | 2 | 0.89mi |
| 222 E 34th St #999 New York, NY | 1.0 | 1.0 | 554 | $5,490 | $9.91 | 8d | 1 | 0.91mi |
| 346 E 18th St Unit 1254596P New York, NY | 2.0 | 2.0 | 699 | $12,979 | $18.57 | 24d | 1 | 0.91mi |
| 120 Christopher St #1886 New York, NY | 1.0–2.0 | 1.0 | 574 | $5,640 | $9.82 | 1d | 3 | 0.92mi |
| 112 E 10th St Unit 1021937P New York, NY | 1.0–3.0 | 1.0–2.5 | 1296 | $5,772 | $4.45 | 5d | 2 | 0.93mi |
| 138 E 38th St New York, NY | 3.0 | 1.0–2.0 | 750 | $4,510 | $6.01 | 26d | 4 | 0.94mi |
| 52 Barrow St #2123 New York, NY | 1.0–2.0 | 1.0 | 547 | $6,420 | $11.73 | 12d | 3 | 0.94mi |
| 556 3rd Ave Unit 2244 New York, NY | 1.0 | 1.0 | 500 | $5,640 | $11.28 | 1d | 1 | 0.94mi |
| 556 3rd Ave New York, NY | 1.0 | 1.0 | 580 | $5,240 | $9.03 | 22d | 2 | 0.94mi |
| 556 3rd Ave New York, NY | 1.0 | 1.0 | 540 | $5,635 | $10.44 | 3d | 2 | 0.94mi |
| 140 Charles St Unit 14A New York, NY | 1.0 | 1.0 | 648 | $8,000 | $12.35 | 9d | 1 | 0.96mi |
HOA detail
- Monthly dues
- $436 · $5,232/yr
- Likely covers
- doorman
Listing history 12 events
-
2026-06-21days on market $888,888 Active 197 DOM
-
2026-06-18days on market $888,888 Active 194 DOM
-
2026-06-17days on market $888,888 Active 193 DOM
-
2026-06-15days on market $888,888 Active 191 DOM
-
2026-06-13days on market $888,888 Active 189 DOM
-
2026-06-10days on market $888,888 Active 185 DOM
-
2026-06-08days on market $888,888 Active 184 DOM
-
2026-06-04days on market $888,888 Active 180 DOM
-
2026-06-03days on market $888,888 Active 179 DOM
-
2026-06-01days on market $888,888 Active 177 DOM
-
2026-05-31days on market $888,888 Active 176 DOM
-
2025-12-06$888,888 Active
ⓘ Source: listings_history table (triggers on properties + properties_extension) + one-shot
backfill from property_details.listing_events for pre-trigger history.
Climate risk First Street
- Flood 1/10 Low FEMA zone X (unshaded) · 0% chance over 30 yrs
- Wildfire 1/10 Low
- Heat 7/10 Severe 7 d/yr ≥99°F today · 15 d/yr by 30 yrs out
- Wind 6/10 Major 27% chance of damaging wind over 30 yrs
- Air quality 4/10 Moderate 5 unhealthy d/yr today · 7 by 30 yrs out
Nearby sold comps map
Loading sold comps map…
Walkable amenities ~0.75 mi
Loading nearby amenities…
Taxation est. · year 1
- Rental income
- $86,251
- − Mortgage interest
- −$49,792
- − Property taxes
- −$13,333
- − Insurance
- −$4,444
- − Repairs & maintenance
- −$6,900
- − Management
- −$6,900
- − HOA
- −$5,232
- − Depreciation
- −$25,859
- Taxable loss
- −$26,209
- Est. tax savings @ 24.0%
- +$6,290
- After-tax cash flow
- $-4,518/yr
For passive investors: Depreciation is non-cash, so a rental often shows a tax loss while cash-flowing — sheltering income. Rental losses are passive: they offset passive income freely, and up to $25,000/yr can offset ordinary (W-2) income if you actively participate and your MAGI is under $100k (phasing out to $0 by $150k); unused losses carry forward. On sale, claimed depreciation is recaptured at up to 25%, and gains may owe capital-gains tax (a 1031 exchange can defer both). Figures are a year-1 estimate at your 24.0% rate — not tax advice; consult a CPA.
Schools (NCES district)
No district data.
Livability — New York
- Score
- 75/100
- State rank
- #268
- US rank
- #4188
Category grades
Schools grade is shown separately in the Schools card above.
Census & demographics
- Census place
- New York, NY
- County
- New York County · 1,599,927 people
- City population
- 7,731,280
- Metro
- New York-Newark-Jersey City, NY-NJ-PA
- Population (ZIP)
- 48,277
- Household income
- $145,987
- Rent vs Own
- Severe rent burden
- 3446.0
Population outlook (New York County) Hauer SSP2
- Today (2025)
- 1,825,725 people
- By 2030
- 1,904,611 · +4.3%
- By 2040
- 2,052,719 · +12.4%
- By 2050
- 2,206,601 · +20.9%
- By 2075
- 2,509,427 · +37.4%
- By 2100
- 2,702,933 · +48.0%
Race, ethnicity, and origin ACS 2023
- Neighborhood character
- Predominantly White (68%)
- Race & ethnicity
- White 68% Hispanic / Latino 13% Asian 10% Two or more races 9% Black 4%
- Hispanic origin (detail)
- Mexican 3% Puerto Rican 4% Dominican 1%
- Common ancestry
- Romanian 6% Scotch-Irish 5% Lithuanian 3%
- Foreign-born
- 20% · Canada, China, South Korea
- Languages at home
- 80% English-only · Spanish 8% Other Indo-European 3% Chinese 2%
Political lean MEDSL · New York
- 2024 margin
- Solid D (+64.8) · D 82.4% · R 17.6%
- 2008→2024 swing
- -7.4pp toward R · 2008: 72.2pp · 2024: 64.8pp
- All cycles
- 2024: D+64.8 2020: D+74.5 2016: D+77.2 2012: D+69.6 2008: D+72.2
Not yet ingested
- Civics
- —
Market trends
- HPI YoY
- ▲ 5.34%
- Current HPI
- 208.6913
- Rent YoY
- ▲ 7.06%
- Metro
- New York-Newark-Jersey City, NY-NJ-PA
- State GDP YoY
- ▲ 2.60%
- F500 in state
- 92
Industry mix (Fortune 500 HQ in NY)
| Industry | F500 HQs | Revenue |
|---|---|---|
| Financial Services | 10 | $950B |
|
||
| Consumer Goods | 9 | $162B |
|
||
| Insurance | 4 | $225B |
|
||
| Telecommunications | 2 | $144B |
|
||
| Pharmaceuticals | 2 | $112B |
|
||
| Media / Entertainment | 2 | $69B |
|
||
Price history
1 event — show timeline
- 2025-12-06 Listed $888,888 RLS at REBNY
Cash-flow waterfall
monthlySold comps — $/sqft
last 12 mo · ≤1 miLoading sold comps…