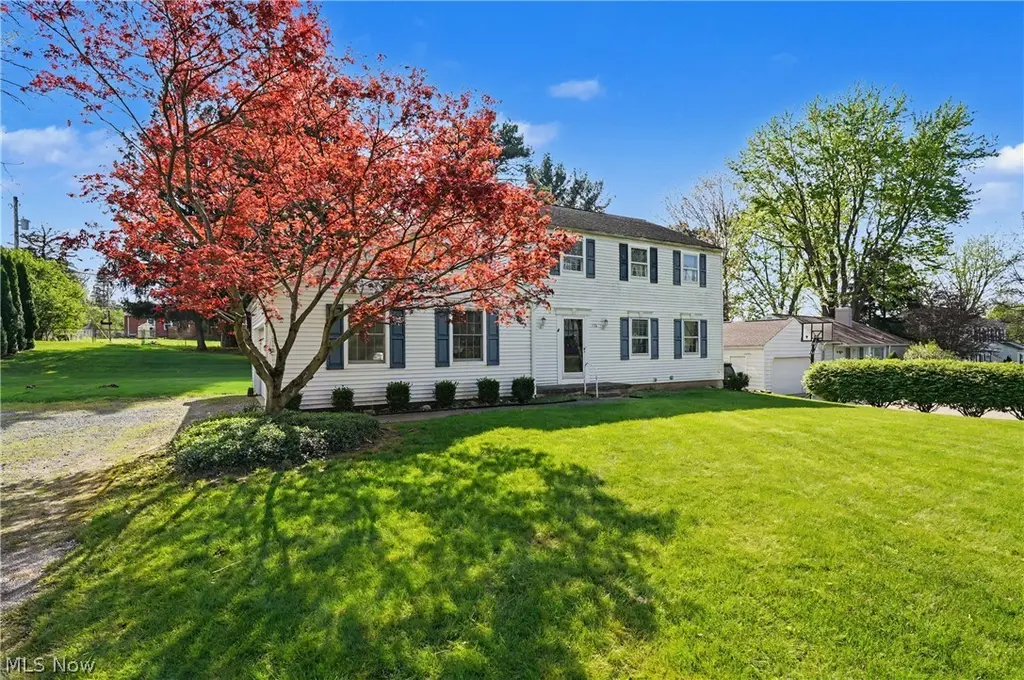
150 Atterbury Blvd · Hudson, OH
Flood risk 5/10 · Moderate
- FEMA flood zone
- X (unshaded)
- Chance of flooding over 30 yrs
- 0.53%
- Est. flood insurance / yr
- $473 – $860
Fire risk 1/10 · Minimal
- Est. fire insurance / yr
- $713 – $1,323
Heat risk 2/10 · Minimal
- Hot days now (above 96°F)
- 7 days/yr
- Hot days in 30 yrs
- 17 days/yr
Wind risk 1/10 · Minimal
- Chance of severe wind over 30 yrs
- —
Air-quality risk 3/10 · Minor
- Unhealthy air days now
- 2 days/yr
- Unhealthy air days in 30 yrs
- 4 days/yr
Risk factors via First Street. Map © Google.
Why this score? — see what drove the D grade
The composite is a weighted blend of 9 inputs, each scored 0–100. Each bar is that input's sub-score; the figure is the points it added to the 100-point composite (weight × sub-score).
- Cash flow +10.0/30.0
- ARV discount +9.8/15.0
- Schools +7.9/10.0
- Livability +4.4/5.0
- 1% rule +2.9/10.0
- DSCR +2.8/10.0
- Rent growth +2.5/5.0
- Condition / age +2.5/5.0
- Appreciation +0.0/10.0
$370,000
🖨 Deal sheet 📄 Offer letter ✓ Due diligence
Listing remarks
If you’re looking for instant equity, look no further! This is a fantastic opportunity in the beautiful city of Hudson. Located on a desirable boulevard just a short distance from downtown, you’ll discover this hidden gem surrounded by substantially higher-priced homes. This 4 bedroom, 3 bath colonial offers approximately 1,849 sq. ft. of living space, plus additional finished space in the lower level. With great bones and endless potential ready for your personal touch. Upon entering the foyer, you’ll find a convenient powder room to the left, a welcoming family room straight ahead, and a spacious living and dining room combination to the right. The dining room is accente
Key facts
- Generous lot
- Private bath
- Primary suite
Tags
Property features AI
Finance
- HOA & community: Community offers curbs, sidewalks, street lights, playground, park, shopping, restaurants, fitness center, laundry facilities, and medical services
Exterior
- Parking: Attached 2-car garage
- Security: Smoke detectors
- Utilities: Public water; Public sewer
- Home design: Northeast-facing; 2 main stories (3 total levels); Entry includes lower-level spaces
- Construction: Vinyl siding; Asphalt roof; Block foundation; Home warranty included; Built according to public records
- Exterior features: Deck; City lot; Lot dimensions approximately 100 x 183
Interior
- Kitchen: Granite counters; Dishwasher; Range; Microwave; Refrigerator
- Bedrooms: Four bedrooms on the second floor
- Flooring: Carpet in bedrooms and dining room; Laminate in family room and kitchen; Ceramic tile in living room; Linoleum in lower-level room
- Bathrooms: Two full bathrooms; One half bathroom; One main-level bathroom
- Heating & cooling: Forced-air gas heating; Central air conditioning
- Interior features: Double-pane windows; Ceiling fans
- Laundry & utility: Washer and dryer; Laundry located in the basement
Neighborhood map
What this means for you Summary
Snapshot
- This is a 4-bed/2.5-bath single-family listed at $370k.
Deal economics
- At list price, monthly cash flow is $-224 ($-3k/yr) — negative.
- To cash-flow at today's rent, offer at most $330k (10.7% below list).
- To meet the 1% rule (rent ≥ 1% of price), the offer needs to be $293k (20.7% below list).
- Recommended offer: $293k (20.7% below list) — sets the bar for 1% rule.
- Cap rate 5.6% vs local median 2.6% in Hudson — top-decile yield for the area; either an underpriced asset or a hidden risk that comps aren't pricing in. Stress-test before assuming the spread holds.
Location & tenants
- Location reads 88/100 on livability (#20 in OH, #196 nationally) — a professional / high-income tenant draw. Strengths: schools A+, crime A+, amenities A+; Watch: commute F, cost of living F.
- Hudson City (suburban): math 84% / reading 88% proficiency, ranked #4 of 656 in OH (top 1%) — strong family-tenant draw, lease renewals of 3-5y typical; only 4% free/reduced lunch — higher-income household profile.
- Market conditions: 95 active listings in the ZIP; high-income renter base; 1,114 units permitted in Summit County in 2024 (397 in 5+ unit buildings).
Forward outlook
- Local home prices are declining (-3.0%/yr); year-one equity from $3k of loan paydown is wiped out by about $11k of value loss. Plan a longer hold.
- Summit County population projected to shrink 6% by 2050 — rents likely to lag national; underwrite the cash flow, not the appreciation.
Negotiation context
- It's been on market 20 days — a 2% lower offer ($364k) is reasonable based on typical stale-listing flexibility.
Risks & watch-outs
- Climate carrying-cost: moderate flood risk — expect insurance premiums to compound above CPI over the hold.
Questions for the listing agent
- What do current leases actually rent for vs. the listed asking? Can we see a recent rent roll and the last 12 months of T-12 income?
- Built in 1972 — when were the roof, HVAC, electrical panel, plumbing, and water heater last replaced?
- Is there a deadline driving the sale (1031 exchange, divorce, estate, relocation)? That informs how much negotiation room exists.
- Schools are A-rated — typically a magnet for longer-tenancy family renters. What's the average tenant stay here, and is there a school-zone premium baked into asking?
- The area grade is low — what's the realistic commute time and amenity access for the typical tenant pool here? Any planned neighborhood developments (good or bad) we should know about?
- What's the average days-on-market for RENTAL listings here right now (not sales)? A rising rental-DOM trend means longer vacancies and softer asking-rent achievability than the comps imply.
- What's the recent tenant-quality profile in this submarket — average credit score on applications, eviction rate, late-payment / NSF rate, and stable-employment percentage? A property-management company in the area should have these aggregated.
- How much new for-sale + rental construction is in the pipeline within 1–3 miles? Heavy new supply typically softens prices + rents 12–24 months out; constrained supply supports both.
Investment metrics
- 1% rule
- 0.79% ✗
- Cap rate
- 5.57%
- Cash-on-cash
- -2.59%
- DSCR
- 0.88
- GRM
- 10.5
CMA / ARV
- ARV (on-the-fly)
- $389,928
- Comps found
- 12
Show comp detail 12 sales within ~0.75 mi
| Address | Dist | Beds/Ba | Sqft | Sold | Price | $/sf | Match |
|---|---|---|---|---|---|---|---|
| 150 Atterbury Blvd | 0.00mi | 4/2.5 | 1,848 (0%) | 1mo | $387,000 | $209 | 99 |
| 114 Brentwood Dr | 0.14mi | 3/2.0 (-1) | 1,835 (-1%) | 10mo | $527,500 | $287 | 77 |
| 276 Atterbury Blvd | 0.36mi | 4/2.5 | 1,876 (+2%) | 13mo | $485,000 | $259 | 70 |
| 41 Plymouth Dr | 0.39mi | 3/2.0 (-1) | 1,861 (+1%) | 7mo | $391,000 | $210 | 68 |
| 273 Boston Mills Rd | 0.34mi | 4/2.5 | 1,920 (+4%) | 15mo | $310,000 | $161 | 65 |
| 123 W Case Dr | 0.51mi | 4/2.5 | 1,800 (-3%) | 12mo | $365,000 | $203 | 62 |
| 60 E Case Dr | 0.36mi | 4/2.5 | 1,802 (-2%) | 23mo | $385,000 | $214 | 60 |
| 49 Owen Brown St | 0.52mi | 4/2.0 | 1,802 (-2%) | 11mo | $365,000 | $203 | 60 |
| 277 Hartford Dr | 0.36mi | 4/2.0 | 2,007 (+9%) | 19mo | $450,000 | $224 | 51 |
| 169 Stratford Rd | 0.21mi | 3/3.5 (-1) | 1,980 (+7%) | 22mo | $583,000 | $294 | 51 |
| 41 W Case Dr | 0.44mi | 3/2.5 (-1) | 2,032 (+10%) | 9mo | $429,200 | $211 | 50 |
| 328 W Streetsboro St | 0.46mi | 4/2.5 | 2,000 (+8%) | 23mo | $322,000 | $161 | 45 |
Match score weights: distance 35% · size 25% · config 20% · recency 20%. Top-matched comps best support the ARV.
Projected returns pro-forma
-3.0% appreciation · 3.0% rent growth · sell at horizon
- IRR
- -20.6%
- Equity multiple
- 0.28×
- Total profit
- $-74,185
- Equity at exit
- $55,168
- IRR
- -13.8%
- Equity multiple
- 0.20×
- Total profit
- $-82,826
- Equity at exit
- $31,991
Cash invested: $103,600 (down + closing). Projections, not guarantees.
Landlord ↔ Tenant lean methodology
- Overall (STATE)
- 73 Landlord-Friendly
- State Ohio
- 73 Landlord-Friendly · R+6
- County
- — inherits STATE
- City
- — inherits STATE
ZIP-level market 44236
- Active inventory
- 95
- Price-to-rent
- 10.5×
Monthly cashflow live
- Estimated rent
- $2,933 medium interval (Pro) →
- Mortgage (P&I)
- −$1,940
- Tax from tax record
- −$447 /mo · $5,362/yr
- Insurance
- −$154
- HOA
- −$0
- Vacancy / Maint / Mgmt
- −$616
- Net cashflow
- $-224
Break-even live
UW: 25.0% down · 7.5% · 30yr · 1.5% tax · 5.0% vac · 8.0% maint · 8.0% mgmt
Financing live
Cash to close
- Down payment
- $92,500
- Closing costs
- $11,100
- Reserves months
- —
- Total cash needed
- —
Loan-product check · same deal, 3 products live
Conventional
25% down · 7.5% · 30yr
- Down + closing
- —
- Monthly P&I
- —
- Monthly cashflow
- —
- DSCR
- —
- Eligible?
- —
Personal DTI + credit; lowest rate.
DSCR
20% down · 8.5% · 30yr
- Down + closing
- —
- Monthly P&I
- —
- Monthly cashflow
- —
- DSCR
- —
- Eligible?
- —
No personal income docs; deal must DSCR.
Hard money
10% down · 12.0% · 12mo
- Down + closing
- —
- Monthly P&I
- —
- Monthly cashflow
- —
- DSCR
- —
- Eligible?
- —
Short-term bridge; refi at stabilization.
Listing history 3 events
-
2026-05-14status Pending
-
2026-04-27historical Contingent
-
2026-04-24$370,000 Active
ⓘ Source: listings_history table (triggers on properties + properties_extension) + one-shot
backfill from property_details.listing_events for pre-trigger history.
Tax reassessment forecast OH · Partial reset (capped growth)
- Current annual tax
- $5,362 · $447/mo
- Projected year-2 tax
- $5,567 · $464/mo
- Expected delta
- +$205/yr (+$17/mo · 3.8%)
ⓘ Screening estimate from a state-policy table — verify with the county assessor before closing.
Climate risk First Street
- Flood 5/10 Major FEMA zone X (unshaded) · 53% chance over 30 yrs
- Wildfire 1/10 Low
- Heat 2/10 Low 7 d/yr ≥96°F today · 17 d/yr by 30 yrs out
- Wind 1/10 Low
- Air quality 3/10 Moderate 2 unhealthy d/yr today · 4 by 30 yrs out
Nearby sold comps map
Loading sold comps map…
Walkable amenities ~0.75 mi
Loading nearby amenities…
Taxation est. · year 1
- Rental income
- $35,200
- − Mortgage interest
- −$20,726
- − Property taxes
- −$5,362
- − Insurance
- −$1,850
- − Repairs & maintenance
- −$2,816
- − Management
- −$2,816
- − Depreciation
- −$10,764
- Taxable loss
- −$9,133
- Est. tax savings @ 24.0%
- +$2,192
- After-tax cash flow
- $-496/yr
For passive investors: Depreciation is non-cash, so a rental often shows a tax loss while cash-flowing — sheltering income. Rental losses are passive: they offset passive income freely, and up to $25,000/yr can offset ordinary (W-2) income if you actively participate and your MAGI is under $100k (phasing out to $0 by $150k); unused losses carry forward. On sale, claimed depreciation is recaptured at up to 25%, and gains may owe capital-gains tax (a 1031 exchange can defer both). Figures are a year-1 estimate at your 24.0% rate — not tax advice; consult a CPA.
Schools (NCES district)
- District
- Hudson City
- NCES district ID
- 3905002
- Math proficiency
- 84% ▼ -7.00%
- Reading proficiency
- 88% ▼ -1.00%
- Median HH income
- $114,390
- Composite
- 78.78/100
- National rank
- #68
- State rank
- #4 of 656 in OH
Livability — Hudson
- Score
- 88/100
- State rank
- #20
- US rank
- #196
Category grades
Schools grade is shown separately in the Schools card above.
Census & demographics
- Census place
- Hudson, OH
- County
- Summit County · 440,783 people
- City population
- 25,941
- Metro
- Akron, OH
- Population (ZIP)
- 25,941
- Household income
- $168,595
- Rent vs Own
- Severe rent burden
- 276.0
Population outlook (Summit County) Hauer SSP2
- Today (2025)
- 546,583 people
- By 2030
- 544,028 · -0.5%
- By 2040
- 531,363 · -2.8%
- By 2050
- 514,923 · -5.8%
- By 2075
- 481,765 · -11.9%
- By 2100
- 432,265 · -20.9%
Race, ethnicity, and origin ACS 2023
- Neighborhood character
- Predominantly White (88%)
- Race & ethnicity
- White 88% Two or more races 4% Black 4% Asian 3% Hispanic / Latino 2%
- Common ancestry
- Romanian 7% Slovak 3% Lithuanian 3%
- Foreign-born
- 6% · Canada, China, South Korea
- Languages at home
- 93% English-only · Other Indo-European 1% Chinese 1% Spanish 1%
Political lean MEDSL · Summit
- 2024 margin
- Lean D (+7.0) · D 53.0% · R 46.0%
- 2008→2024 swing
- -9.6pp toward R · 2008: 16.6pp · 2024: 7.0pp
- All cycles
- 2024: D+7.0 2020: D+9.6 2016: D+8.2 2012: D+14.8 2008: D+16.6
Not yet ingested
- Civics
- —
Market trends
- HPI YoY
- ▼ -238.26%
- Current HPI
- 218.638
- Rent YoY
- —
- Metro
- Akron, OH
- State GDP YoY
- ▲ 1.98%
- F500 in state
- 48
Industry mix (Fortune 500 HQ in OH)
| Industry | F500 HQs | Revenue |
|---|---|---|
| Insurance | 3 | $145B |
|
||
| Industrial Machinery | 3 | $49B |
|
||
| Financial Services | 3 | $24B |
|
||
| Consumer Goods | 2 | $93B |
|
||
| Aerospace / Defense | 2 | $47B |
|
||
| Utilities | 2 | $33B |
|
||
Price history
3 events — show timeline
- 2026-05-14 Pending — MLSNOW
- 2026-04-27 Contingent — MLSNOW
- 2026-04-24 Listed $370,000 MLSNOW
Property tax history
+4.6%/yrLatest (2025): $5,362 · -2.0% YoY. Source: county tax records.
Cash-flow waterfall
monthlySold comps — $/sqft
last 12 mo · ≤1 miLoading sold comps…