 🏷️ Likely Rental
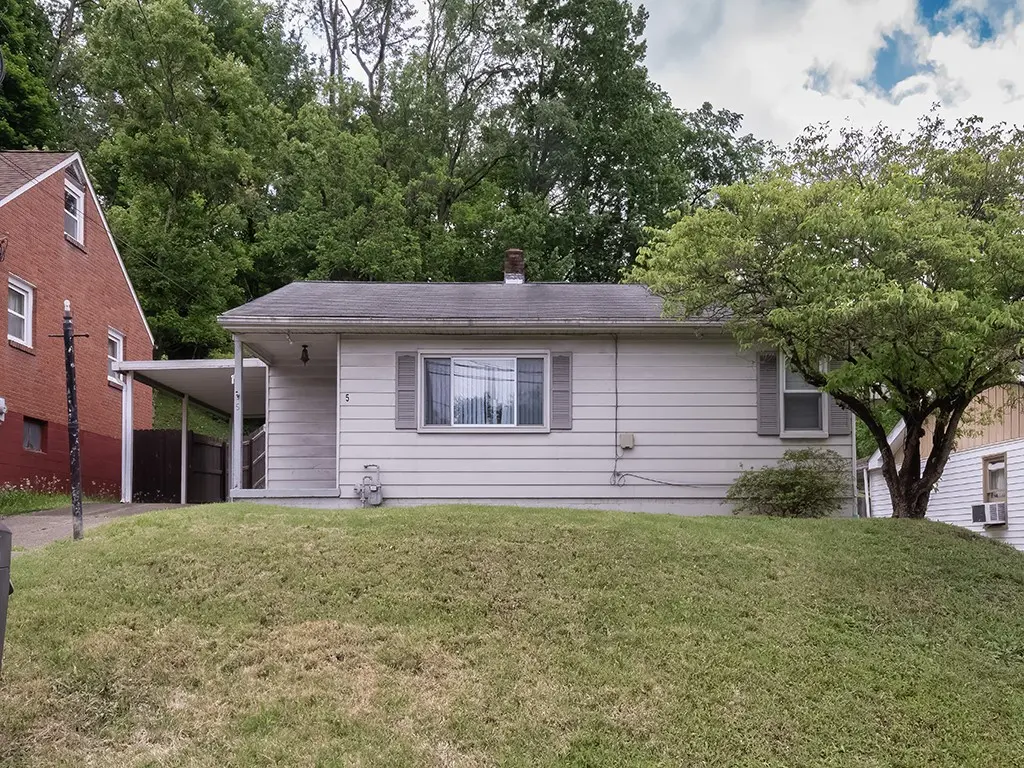
5 Crooked Run Rd · North Versailles, PA
Flood risk 7/10 · Major
- FEMA flood zone
- X (unshaded)
- Chance of flooding over 30 yrs
- 0.77%
- Est. flood insurance / yr
- $507 – $1,088
Fire risk 1/10 · Minimal
- Est. fire insurance / yr
- $511 – $949
Heat risk 3/10 · Minor
- Hot days now (above 96°F)
- 7 days/yr
- Hot days in 30 yrs
- 17 days/yr
Wind risk 2/10 · Minimal
- Chance of severe wind over 30 yrs
- 0.0%
Air-quality risk 4/10 · Minor
- Unhealthy air days now
- 5 days/yr
- Unhealthy air days in 30 yrs
- 7 days/yr
Risk factors via First Street. Map © Google.
Why this score? — see what drove the B grade
The composite is a weighted blend of 9 inputs, each scored 0–100. Each bar is that input's sub-score; the figure is the points it added to the 100-point composite (weight × sub-score).
- Cash flow +28.2/30.0
- ARV discount +15.0/15.0
- DSCR +10.0/10.0
- 1% rule +7.6/10.0
- Rent growth +2.5/5.0
- Livability +2.5/5.0
- Condition / age +2.5/5.0
- Schools +1.8/10.0
- Appreciation +0.0/10.0
$85,000
🖨 Deal sheet 📄 Offer letter ✓ Due diligence
Listing remarks
This charming one-level ranch with covered parking is an excellent opportunity for downsizing, first-time homebuyers, or investors seeking a rental property with strong tenant appeal. The home features 2 bedrooms and 1 full bathroom, along with a comfortable living room and a separate dining room that adds to the functional layout. The kitchen offers practical workspace and convenient access to the covered outdoor area — perfect for grilling, relaxing, or enjoying time outside. The spacious backyard provides plenty of potential to create your own outdoor retreat or entertaining space. With just a few updates and personal touches, this property offers great upside potential and an oppo
Key facts
- Practical workspace
- Covered parking
- Spacious backyard
Tags
Property features AI
Exterior
- Parking: Covered parking (1 space)
- Utilities: Public water; Public sewer
- Home design: Single-story; Resale property
- Construction: Frame construction; Asphalt roof
- Exterior features: Public transportation nearby
Interior
- Kitchen: Refrigerator; Stove; Some gas appliances
- Flooring: Carpet
- Bathrooms: 1 full bathroom
- Heating & cooling: Forced air gas heating
- Interior features: Carpet flooring
Neighborhood map
What this means for you Summary
Snapshot
- This is a 2-bed/1.0-bath single-family listed at $85k.
Deal economics
- At list price, monthly cash flow is $205 ($2k/yr) — positive.
- The deal already cash-flows at list — no discount required.
- Meets the 1% rule at list price ($1k rent vs $85k).
- Recommended offer: $84k (1.5% below list) — sets the bar for market timing.
Location & tenants
- Location reads: area grade B — affects rentability + tenant quality, not the cash-flow math above.
- East Allegheny SD (suburban): math 14% / reading 30% proficiency, ranked #485 of 539 in PA (top 90%) — low school quality limits family demand, transient renter base, plan for 1-2y turnover.
- Market conditions: 31 active listings in the ZIP; 10 comparable units currently listed for rent nearby; rentals at typical pace (median 17d on market — plan ~3-4 weeks tenant-placement turnaround); 2,996 units permitted in Allegheny County in 2024 (1,588 in 5+ unit buildings).
Forward outlook
- Local home prices are declining (-3.0%/yr); year-one equity from $588 of loan paydown is wiped out by about $3k of value loss. Plan a longer hold.
Negotiation context
- It's been on market 23 days — a 2% lower offer ($84k) is reasonable based on typical stale-listing flexibility.
Risks & watch-outs
- Watch-outs: flood insurance adds $66/mo; built in 1951 — expect roof / HVAC / electrical / plumbing capex.
- Climate carrying-cost: major flood risk — expect insurance premiums to compound above CPI over the hold.
Questions for the listing agent
- Built in 1951 — when were the roof, HVAC, electrical panel, plumbing, and water heater last replaced?
- What's the actual annual flood-insurance premium (NFIP or private), and is the property in a SFHA with mandatory coverage?
- Is there a deadline driving the sale (1031 exchange, divorce, estate, relocation)? That informs how much negotiation room exists.
- What's the average days-on-market for RENTAL listings here right now (not sales)? A rising rental-DOM trend means longer vacancies and softer asking-rent achievability than the comps imply.
- What's the recent tenant-quality profile in this submarket — average credit score on applications, eviction rate, late-payment / NSF rate, and stable-employment percentage? A property-management company in the area should have these aggregated.
- How much new for-sale + rental construction is in the pipeline within 1–3 miles? Heavy new supply typically softens prices + rents 12–24 months out; constrained supply supports both.
Investment metrics
- 1% rule
- 1.26% ✓
- Cap rate
- 10.12%
- Cash-on-cash
- 13.66%
- DSCR
- 1.61
- GRM
- 6.6
CMA / ARV
- ARV (on-the-fly)
- $149,940
- Comps found
- 12
Show comp detail 12 sales within ~0.75 mi
| Address | Dist | Beds/Ba | Sqft | Sold | Price | $/sf | Match |
|---|---|---|---|---|---|---|---|
| 339 Foster Rd | 0.14mi | 2/1.0 | 972 (-9%) | 8mo | $112,000 | $115 | 71 |
| 498 Taylor | 0.55mi | 3/1.5 (+1) | 1,068 (-0%) | 1mo | $220,000 | $206 | 66 |
| 300 Taylor St | 0.47mi | 3/1.5 (+1) | 1,120 (+5%) | 5mo | $167,000 | $149 | 59 |
| 113 Robin St | 0.66mi | 2/1.0 | 1,104 (+3%) | 7mo | $118,500 | $107 | 58 |
| 635 Larimer Ave | 0.56mi | 3/2.0 (+1) | 1,100 (+3%) | 4mo | $165,000 | $150 | 57 |
| 1104 Clinton Ave | 0.21mi | 3/2.5 (+1) | 1,157 (+8%) | 16mo | $148,800 | $129 | 53 |
| 315 James St | 0.52mi | 2/1.0 | 1,160 (+8%) | 13mo | $125,000 | $108 | 51 |
| 3812 Alice Ave | 0.63mi | 3/1.0 (+1) | 1,152 (+8%) | 3mo | $161,500 | $140 | 51 |
| 1302 Walnut St | 0.20mi | 3/2.0 (+1) | 1,176 (+10%) | 22mo | $201,000 | $171 | 47 |
| 729 Naysmith Rd | 0.66mi | 2/1.0 | 972 (-9%) | 9mo | $136,000 | $140 | 47 |
| 437 Leslie St | 0.71mi | 2/1.0 | 1,144 (+7%) | 22mo | $42,500 | $37 | 37 |
| 1303 Denning Way | 0.66mi | 3/2.0 (+1) | 1,150 (+7%) | 15mo | $168,000 | $146 | 35 |
Match score weights: distance 35% · size 25% · config 20% · recency 20%. Top-matched comps best support the ARV.
Projected returns pro-forma
-3.0% appreciation · 3.0% rent growth · sell at horizon
- IRR
- -0.8%
- Equity multiple
- 0.97×
- Total profit
- $-699
- Equity at exit
- $12,674
- IRR
- 8.9%
- Equity multiple
- 1.69×
- Total profit
- $16,358
- Equity at exit
- $7,349
Cash invested: $23,800 (down + closing). Projections, not guarantees.
Landlord ↔ Tenant lean methodology
- Overall (STATE)
- 62 Landlord-Friendly
- State Pennsylvania
- 62 Landlord-Friendly · EVEN
- County
- — inherits STATE
- City
- — inherits STATE
ZIP-level market 15137
- Home prices YoY
- -9.2%
- Active inventory
- 31
- Price-to-rent
- 6.6×
Monthly cashflow live
- Estimated rent
- $1,067 high interval (Pro) →
- Mortgage (P&I)
- −$446
- Tax from tax record
- −$91 /mo · $1,093/yr
- Insurance
- −$35
- Flood insurance flood zone
- −$66 /mo · $798/yr
- HOA
- −$0
- Vacancy / Maint / Mgmt
- −$224
- Net cashflow
- $205
Break-even live
UW: 25.0% down · 7.5% · 30yr · 1.5% tax · 5.0% vac · 8.0% maint · 8.0% mgmt
Financing live
Cash to close
- Down payment
- $21,250
- Closing costs
- $2,550
- Reserves months
- —
- Total cash needed
- —
Loan-product check · same deal, 3 products live
Conventional
25% down · 7.5% · 30yr
- Down + closing
- —
- Monthly P&I
- —
- Monthly cashflow
- —
- DSCR
- —
- Eligible?
- —
Personal DTI + credit; lowest rate.
DSCR
20% down · 8.5% · 30yr
- Down + closing
- —
- Monthly P&I
- —
- Monthly cashflow
- —
- DSCR
- —
- Eligible?
- —
No personal income docs; deal must DSCR.
Hard money
10% down · 12.0% · 12mo
- Down + closing
- —
- Monthly P&I
- —
- Monthly cashflow
- —
- DSCR
- —
- Eligible?
- —
Short-term bridge; refi at stabilization.
Rent comps 10 comps
| Address | Beds | Baths | Sqft | Rent | $/sqft | DOM | Units | Dist |
|---|---|---|---|---|---|---|---|---|
| 200 Delaware Ave North Versailles, PA | 3.0 | 1.5 | 1470 | $1,450 | $0.99 | 14d | 1 | 0.79mi |
| 930 Punta Gorda Ave Unit 1 East McKeesport, PA | 1.0 | 1.0 | 700 | $750 | $1.07 | 3d | 1 | 0.81mi |
| 569 Woodmont Ave Unit C East McKeesport, PA | 2.0 | 1.0 | 1000 | $1,000 | $1.00 | 17d | 1 | 0.89mi |
| 569 Woodmont Ave Apt B East McKeesport, PA | 2.0 | 1.0 | 1000 | $1,200 | $1.20 | 17d | 1 | 0.89mi |
| 175 Dix Dr North Versailles Township, PA | 1.0–2.0 | 1.0 | 691 | $1,155 | $1.67 | 3d | 11 | 1.10mi |
| 450 Card Ave Unit 1 Wilmerding, PA | 1.0 | 1.0 | 900 | $700 | $0.78 | 23d | 1 | 1.20mi |
| 210 Westinghouse Ave Unit 210-E Wilmerding, PA | 2.0 | 1.0 | 800 | $999 | $1.25 | 14d | 1 | 1.38mi |
| 210 Westinghouse Ave Unit 210-D Wilmerding, PA | 2.0 | 1.0 | 800 | $999 | $1.25 | 43d | 1 | 1.38mi |
| 215 Grant St Wall, PA | 2.0 | 2.5 | 960 | $750 | $0.78 | 43d | 1 | 1.39mi |
| 1806 Greensburg Ave North Versailles Township, PA | 1.0–2.0 | 1.0 | 750 | $1,015 | $1.35 | 1d | 10 | 1.45mi |
Listing history 13 events
-
2026-06-18days on market $85,000 Active 23 DOM
-
2026-06-17days on market $85,000 Active 22 DOM
-
2026-06-16days on market $85,000 Active 21 DOM
-
2026-06-15days on market $85,000 Active 20 DOM
-
2026-06-13days on market $85,000 Active 18 DOM
-
2026-06-09days on market $85,000 Active 14 DOM
-
2026-06-08days on market $85,000 Active 13 DOM
-
2026-06-07days on market $85,000 Active 12 DOM
-
2026-06-03days on market $85,000 Active 8 DOM
-
2026-06-02days on market $85,000 Active 7 DOM
-
2026-06-01days on market $85,000 Active 6 DOM
-
2026-05-31days on market $85,000 Active 5 DOM
-
2026-05-26$85,000 Active
ⓘ Source: listings_history table (triggers on properties + properties_extension) + one-shot
backfill from property_details.listing_events for pre-trigger history.
Tax reassessment forecast PA · Partial reset (capped growth)
- Current annual tax
- $1,093 · $91/mo
- Projected year-2 tax
- $1,218 · $102/mo
- Expected delta
- +$125/yr (+$10/mo · 11.4%)
ⓘ Screening estimate from a state-policy table — verify with the county assessor before closing.
Climate risk First Street
- Flood 7/10 Severe FEMA zone X (unshaded) · 77% chance over 30 yrs
- Wildfire 1/10 Low
- Heat 3/10 Moderate 7 d/yr ≥96°F today · 17 d/yr by 30 yrs out
- Wind 2/10 Low 0% chance of damaging wind over 30 yrs
- Air quality 4/10 Moderate 5 unhealthy d/yr today · 7 by 30 yrs out
Nearby sold comps map
Loading sold comps map…
Walkable amenities ~0.75 mi
Loading nearby amenities…
Taxation est. · year 1
- Rental income
- $12,809
- − Mortgage interest
- −$4,761
- − Property taxes
- −$1,093
- − Insurance
- −$1,222
- − Repairs & maintenance
- −$1,025
- − Management
- −$1,025
- − Depreciation
- −$2,473
- Taxable income
- $1,210
- Est. tax owed @ 24.0%
- −$290
- After-tax cash flow
- $2,164/yr
For passive investors: Depreciation is non-cash, so a rental often shows a tax loss while cash-flowing — sheltering income. Rental losses are passive: they offset passive income freely, and up to $25,000/yr can offset ordinary (W-2) income if you actively participate and your MAGI is under $100k (phasing out to $0 by $150k); unused losses carry forward. On sale, claimed depreciation is recaptured at up to 25%, and gains may owe capital-gains tax (a 1031 exchange can defer both). Figures are a year-1 estimate at your 24.0% rate — not tax advice; consult a CPA.
Schools (NCES district)
- District
- East Allegheny SD
- NCES district ID
- 4208060
- Math proficiency
- 14% ▼ -13.00%
- Reading proficiency
- 30% ▼ -19.00%
- Median HH income
- $38,748
- Composite
- 18.44/100
- National rank
- #8930
- State rank
- #485 of 539 in PA
Livability — North Versailles
No livability data for this city. (Only ~50 U.S. cities are tracked.)
Census & demographics
- County
- Allegheny County · 1,022,028 people
- City population
- 10,043
- Metro
- Pittsburgh, PA
- Population (ZIP)
- 10,043
- Household income
- $53,632
- Rent vs Own
- Severe rent burden
- 393.0
Population outlook (Allegheny County) Hauer SSP2
- Today (2025)
- 1,250,282 people
- By 2030
- 1,256,482 · +0.5%
- By 2040
- 1,256,318 · +0.5%
- By 2050
- 1,244,169 · -0.5%
- By 2075
- 1,197,693 · -4.2%
- By 2100
- 1,093,187 · -12.6%
Race, ethnicity, and origin ACS 2023
- Neighborhood character
- Predominantly White (77%)
- Race & ethnicity
- White 77% Black 18% Two or more races 2% Asian 2%
- Common ancestry
- Romanian 6% Slovak 3% Lithuanian 1%
- Foreign-born
- 2% · Vietnam
- Languages at home
- 97% English-only · Vietnamese 2%
Political lean MEDSL · Allegheny
- 2024 margin
- Strong D (+20.3) · D 59.7% · R 39.4%
- 2008→2024 swing
- +4.8pp toward D · 2008: 15.5pp · 2024: 20.3pp
- All cycles
- 2024: D+20.3 2020: D+20.4 2016: D+16.4 2012: D+14.4 2008: D+15.5
Not yet ingested
- Civics
- —
Market trends
- HPI YoY
- ▼ -25.43%
- Current HPI
- 252.4089
- Rent YoY
- —
- Metro
- Pittsburgh, PA
- State GDP YoY
- ▲ 1.68%
- F500 in state
- 34
Industry mix (Fortune 500 HQ in PA)
| Industry | F500 HQs | Revenue |
|---|---|---|
| Healthcare | 2 | $309B |
|
||
| Insurance | 2 | $27B |
|
||
| Telecommunications / Media | 1 | $124B |
|
||
| Industrial Distribution | 1 | $22B |
|
||
| Financial Services | 1 | $20B |
|
||
| Chemicals / Materials | 1 | $18B |
|
||
Price history
1 event — show timeline
- 2026-05-26 Listed $85,000 West Penn MLS
Property tax history
-3.5%/yrLatest (2026): $1,093 · +0.0% YoY. Source: county tax records.
Cash-flow waterfall
monthlySold comps — $/sqft
last 12 mo · ≤1 miLoading sold comps…