607 Dale St · Highland Springs, VA
Flood risk 1/10 · Minimal
- FEMA flood zone
- X (unshaded)
- Chance of flooding over 30 yrs
- 0.0%
- Est. flood insurance / yr
- $507 – $1,088
Fire risk 3/10 · Minor
- Est. fire insurance / yr
- $666 – $1,236
Heat risk 8/10 · Major
- Hot days now (above 106°F)
- 7 days/yr
- Hot days in 30 yrs
- 17 days/yr
Wind risk 6/10 · Moderate
- Chance of severe wind over 30 yrs
- 27.0%
Air-quality risk 2/10 · Minimal
- Unhealthy air days now
- 1 days/yr
- Unhealthy air days in 30 yrs
- 2 days/yr
Risk factors via First Street. Map © Google.
Why this score? — see what drove the D grade
The composite is a weighted blend of 9 inputs, each scored 0–100. Each bar is that input's sub-score; the figure is the points it added to the 100-point composite (weight × sub-score).
- Cash flow +12.0/30.0
- ARV discount +10.5/15.0
- Schools +4.9/10.0
- DSCR +3.6/10.0
- Livability +3.6/5.0
- 1% rule +2.8/10.0
- Rent growth +2.5/5.0
- Condition / age +2.5/5.0
- Appreciation +0.0/10.0
$239,000
🖨 Deal sheet (PDF) 📄 Offer letter ✓ Due diligence
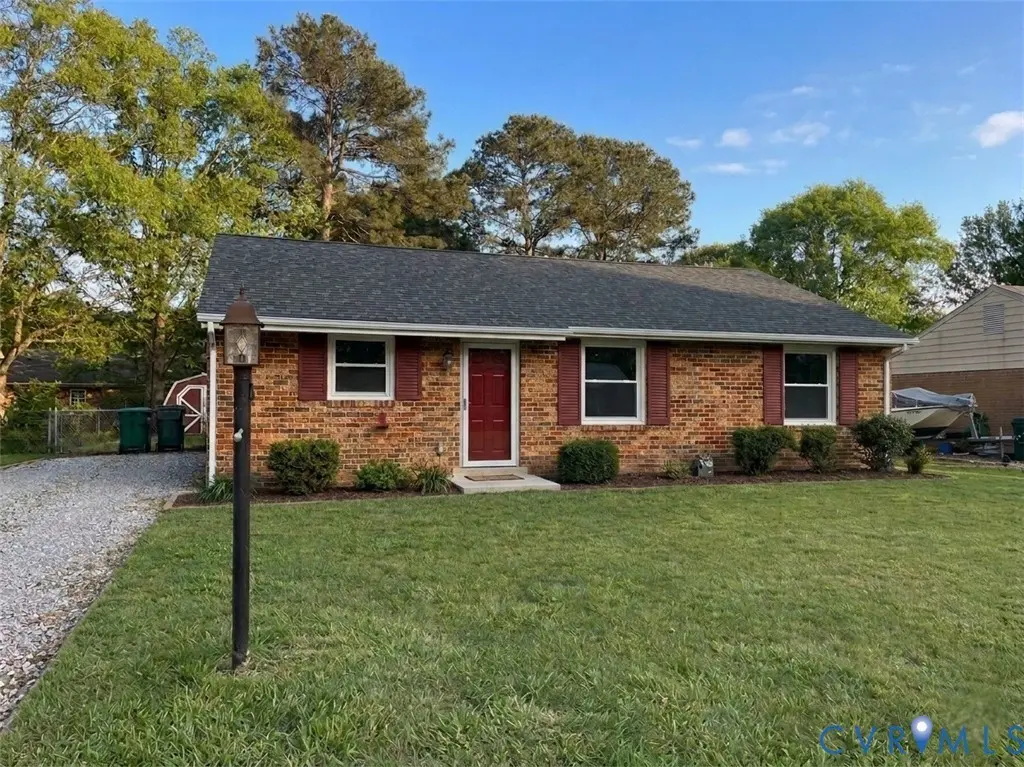
Listing remarks
This inviting rancher offers easy, one level living with a layout that feels both comfortable and practical from the moment you walk in. The living spaces flow naturally, creating a setting that works just as well for everyday routines as it does for gathering with friends or family. With three bedrooms and one and a half baths, the home offers flexibility for a variety of lifestyles. The interior feels manageable in all the right ways, while still providing the space you need. Recent updates include a brand new roof in 2026 and an HVAC system replaced in 2015, giving you added confidence in the home’s overall condition. Out back, the spacious yard creates room to relax, play, or ente
Key facts
- 8,524 sq ft lot
- Built 1977
- Listed 2 days
Property features AI
Exterior
- Utilities: Public water; Public sewer
- Home design: Single-story home; Resale property
- Construction: Brick, block, and concrete construction; Composition/shingle roof; Slab foundation; Built (actual year recorded)
- Exterior features: Fenced backyard
Interior
- Bedrooms: Main level bedroom(s)
- Flooring: Carpet; Laminate
- Bathrooms: 1 full bathroom with tub and shower; 1 half bathroom
- Heating & cooling: Heat pump heating (electric); Central air conditioning
- Interior features: Main-level primary bedroom; Bedroom on main level
- Laundry & utility: Electric water heater
Neighborhood map
What this means for you Summary
Snapshot
- This is a 3-bed/1.5-bath single-family listed at $239k.
Deal economics
- At list price, monthly cash flow is $-56 ($-667/yr) — negative.
- To cash-flow at today's rent, offer at most $229k (4.1% below list).
- To meet the 1% rule (rent ≥ 1% of price), the offer needs to be $185k (22.5% below list).
- Recommended offer: $185k (22.5% below list) — sets the bar for 1% rule.
- Cap rate 6.0% vs local median 4.9% in Highland Springs — meaningfully above typical; check what's discounted (condition, days-on-market, listing class) to confirm the premium yield is real.
Location & tenants
- Location reads 72/100 on livability (#196 in VA) — a middle-class / working-renter tenant base. Strengths: commute A+, cost of living A+, housing A+; Watch: employment C-, amenities F, health & safety F.
- Henrico County Public School District (suburban): math 49% / reading 64% proficiency, ranked #68 of 131 in VA (top 52%) — acceptable for families but not a draw, mixed tenant base, ~2y average lease.
- Zoned schools: Fair Oaks Elementary (math 17% / reading 37%, grade F, #1,029 of 1,108 statewide, top 94%, 379 students, 89% FRL); Elko Middle (math 16% / reading 33%, grade F, #336 of 342 statewide, top 98%, 730 students, 89% FRL); Highland Springs High (math 33% / reading 67%, grade D+, #298 of 319 statewide, top 93%, 2,089 students, 88% FRL) — zoned schools average 88% FRL vs 34% district-wide (54 pts higher); higher-poverty schools than district average — tighter screening recommended.
- Zoned-school proficiency averages 34% at this address vs 56% district-wide (-23 pts) — the specific schools serving this property underperform the Henrico County Public School District average; the district grade overstates school quality for this exact location.
- Market conditions: 63 active listings in the ZIP; 15 comparable units currently listed for rent nearby; rentals at typical pace (median 26d on market — plan ~3-4 weeks tenant-placement turnaround); 1,826 units permitted in Henrico County in 2024 (785 in 5+ unit buildings).
- This rent runs 40% of the median local income ($56k/yr) — at the standard rent-burdened threshold; future hikes will face affordability resistance.
Forward outlook
- Local home prices are declining (-3.0%/yr); year-one equity from $2k of loan paydown is wiped out by about $7k of value loss. Plan a longer hold.
- Henrico County population projected at +21% by 2050 — long-run rental-demand tailwind backs the buy-and-hold thesis.
Negotiation context
- Only 2 days on market — expect competitive offers; lowballing is unlikely to land.
Risks & watch-outs
- Climate carrying-cost: major wind risk, 27% chance of damaging wind over 30y; extreme-heat days projected 7→17/yr by 2055 (HVAC capex compounding) — expect insurance premiums to compound above CPI over the hold.
Questions for the listing agent
- What do current leases actually rent for vs. the listed asking? Can we see a recent rent roll and the last 12 months of T-12 income?
- Built in 1977 — when were the roof, HVAC, electrical panel, plumbing, and water heater last replaced?
- Is there a deadline driving the sale (1031 exchange, divorce, estate, relocation)? That informs how much negotiation room exists.
- The area grade is low — what's the realistic commute time and amenity access for the typical tenant pool here? Any planned neighborhood developments (good or bad) we should know about?
- What's the average days-on-market for RENTAL listings here right now (not sales)? A rising rental-DOM trend means longer vacancies and softer asking-rent achievability than the comps imply.
- What's the recent tenant-quality profile in this submarket — average credit score on applications, eviction rate, late-payment / NSF rate, and stable-employment percentage? A property-management company in the area should have these aggregated.
- How much new for-sale + rental construction is in the pipeline within 1–3 miles? Heavy new supply typically softens prices + rents 12–24 months out; constrained supply supports both.
Investment metrics
- 1% rule
- 0.78% ✗
- Cap rate
- 6.01%
- Cash-on-cash
- -1.00%
- DSCR
- 0.96
- GRM
- 10.7
CMA / ARV
- ARV (median comp)
- $255,872
- List price
- $239,000
- Delta
- -6.59%
- Verdict
- FAIR
- Comps
- 20 within 1.0 mi
Show comp detail 12 sales within ~0.75 mi
| Address | Dist | Beds/Ba | Sqft | Sold | Price | $/sf | Match |
|---|---|---|---|---|---|---|---|
| 607 Dale St | 0.00mi | 3/1.5 | 1,160 (0%) | 1mo | $239,000 | $206 | 99 |
| 325 E Jerald St | 0.13mi | 3/1.5 | 1,160 (0%) | 12mo | $300,000 | $259 | 84 |
| 309 South St | 0.25mi | 3/2.0 | 1,128 (-3%) | 10mo | $300,000 | $266 | 74 |
| 508 E Read St | 0.55mi | 4/1.0 (+1) | 1,152 (-1%) | 1mo | $225,000 | $195 | 65 |
| 107 S Kalmia Ave | 0.54mi | 3/2.0 | 1,152 (-1%) | 12mo | $315,000 | $273 | 62 |
| 2 Pleasant St | 0.47mi | 3/1.5 | 1,056 (-9%) | 2mo | $279,900 | $265 | 61 |
| 398 S Oak Ave | 0.32mi | 3/1.5 | 1,008 (-13%) | 3mo | $255,000 | $253 | 61 |
| 394 S Oak | 0.33mi | 3/1.5 | 1,008 (-13%) | 3mo | $285,000 | $283 | 60 |
| 258 Jennings Rd | 0.54mi | 3/2.0 | 1,224 (+6%) | 10mo | $349,950 | $286 | 56 |
| 114 E Jerald St | 0.41mi | 3/2.0 | 1,036 (-11%) | 14mo | $215,000 | $208 | 50 |
| 111 S Grove Ave | 0.67mi | 3/2.0 | 1,078 (-7%) | 7mo | $250,000 | $232 | 49 |
| 508 Highland Dr | 0.61mi | 3/1.0 | 1,300 (+12%) | 4mo | $270,000 | $208 | 46 |
Match score weights: distance 35% · size 25% · config 20% · recency 20%. Top-matched comps best support the ARV.
Projected returns pro-forma
-3.0% appreciation · 3.0% rent growth · sell at horizon
- IRR
- -18.0%
- Equity multiple
- 0.37×
- Total profit
- $-42,320
- Equity at exit
- $35,636
- IRR
- -10.2%
- Equity multiple
- 0.38×
- Total profit
- $-41,624
- Equity at exit
- $20,664
Cash invested: $66,920 (down + closing). Projections, not guarantees.
Landlord ↔ Tenant lean methodology
- Overall (STATE)
- 55 Moderately Landlord-Leaning
- State Virginia
- 55 Moderately Landlord-Leaning · D+2
- County
- — inherits STATE
- City
- — inherits STATE
ZIP-level market 23075
- Home prices YoY
- -13.6%
- Active inventory
- 63
- Price-to-rent
- 10.7×
Monthly cashflow live
- Estimated rent
- $1,853 high interval (Pro) →
- Mortgage (P&I)
- −$1,253
- Tax from tax record
- −$167 /mo · $1,998/yr
- Insurance
- −$100
- HOA
- −$0
- Vacancy / Maint / Mgmt
- −$389
- Net cashflow
- $-56
Break-even live
Sensitivity live
| Price | -10% $80 | -5% $12 | +0% $-56 | +5% $-123 | +10% $-191 |
|---|---|---|---|---|---|
| Rent | -10% $-202 | -5% $-129 | +0% $-56 | +5% $18 | +10% $91 |
| Rate | -1.0pp $65 | -0.5pp $5 | base $-56 | +0.5pp $-117 | +1.0pp $-180 |
UW: 25.0% down · 7.5% · 30yr · 1.5% tax · 5.0% vac · 8.0% maint · 8.0% mgmt
Financing live
Cash to close
- Down payment
- $59,750
- Closing costs
- $7,170
- Reserves months
- —
- Total cash needed
- —
Loan-product check · same deal, 3 products live
Conventional
25% down · 7.5% · 30yr
- Down + closing
- —
- Monthly P&I
- —
- Monthly cashflow
- —
- DSCR
- —
- Eligible?
- —
Personal DTI + credit; lowest rate.
DSCR
20% down · 8.5% · 30yr
- Down + closing
- —
- Monthly P&I
- —
- Monthly cashflow
- —
- DSCR
- —
- Eligible?
- —
No personal income docs; deal must DSCR.
Hard money
10% down · 12.0% · 12mo
- Down + closing
- —
- Monthly P&I
- —
- Monthly cashflow
- —
- DSCR
- —
- Eligible?
- —
Short-term bridge; refi at stabilization.
Rent comps 15 comps
| Address | Beds | Baths | Sqft | Rent | $/sqft | DOM | Units | Dist |
|---|---|---|---|---|---|---|---|---|
| 339 E Jerald St Henrico, VA | 3.0 | 1.5 | 1160 | $1,950 | $1.68 | 46d | 1 | 0.08mi |
| 901 E 9 Mile Rd Unit a Highland Springs, VA | 2.0 | 1.0 | 800 | $1,312 | $1.64 | 23d | 1 | 0.65mi |
| 118 N Linden Ave Henrico, VA | 3.0 | 1.5 | 1080 | $1,795 | $1.66 | 46d | 1 | 0.93mi |
| 117 N Ivy Ave Henrico, VA | 3.0 | 1.0 | 980 | $1,590 | $1.62 | 5d | 1 | 0.99mi |
| 1005 W Nine Mile Rd Unit J Henrico, VA | 2.0 | 1.0 | 783 | $1,395 | $1.78 | 26d | 1 | 1.08mi |
| 5951 Tiger Lily Ln Richmond, VA | 2.0–3.0 | 2.0 | 1080 | $1,592 | $1.47 | 0d | 8 | 1.09mi |
| 1005 W Nine Mile Rd Henrico, VA | 2.0 | 1.0 | 783 | $1,345 | $1.72 | 46d | 1 | 1.10mi |
| 4815 Oakleys Ln Henrico, VA | 3.0 | 1.0 | 900 | $1,900 | $2.11 | 26d | 1 | 1.12mi |
| 419 Roxana Rd Henrico, VA | 3.0 | 1.5 | 1085 | $2,050 | $1.89 | 5d | 1 | 1.14mi |
| 132 N Elm Ave Henrico, VA | 3.0 | 1.0 | 840 | $1,629 | $1.94 | 46d | 1 | 1.14mi |
| 239 N Mapleleaf Ave Henrico, VA | 3.0 | 1.0 | 980 | $1,750 | $1.79 | 26d | 1 | 1.20mi |
| 205 Bridge St Henrico, VA | 3.0 | 2.0 | 1242 | $1,850 | $1.49 | 12d | 1 | 1.29mi |
| 6 Naglee Ave Sandston, VA | 3.0 | 1.0 | 1000 | $1,995 | $2.00 | 46d | 1 | 1.32mi |
| 1000 E Washington St Henrico, VA | 2.0 | 1.0 | 888 | $2,000 | $2.25 | 5d | 1 | 1.32mi |
| 5194 Gerwyn Cir Unit L5200-58 Sandston, VA | 2.0 | 1.0 | 900 | $1,373 | $1.53 | 26d | 1 | 1.43mi |
Listing history 4 events
-
2026-05-08status Pending 928-char remark
-
2026-05-07$239,000 Active 928-char remark
-
2026-04-26historical $239,000 928-char remark
-
1980-08-01soldstatus $43,747
ⓘ Source: listings_history table (triggers on properties + properties_extension) + one-shot
backfill from property_details.listing_events for pre-trigger history.
Tax reassessment forecast VA · Resets to sale price
- Current annual tax
- $1,998 · $167/mo
- Projected year-2 tax
- $1,998 · $167/mo
- Expected delta
- $0/yr ($0/mo · 0.0%)
ⓘ Screening estimate from a state-policy table — verify with the county assessor before closing.
Climate risk First Street
- Flood 1/10 Low FEMA zone X (unshaded) · 0% chance over 30 yrs
- Wildfire 3/10 Moderate
- Heat 8/10 Severe 7 d/yr ≥106°F today · 17 d/yr by 30 yrs out
- Wind 6/10 Major 27% chance of damaging wind over 30 yrs
- Air quality 2/10 Low 1 unhealthy d/yr today · 2 by 30 yrs out
Nearby sold comps map
Loading sold comps map…
Walkable amenities ~0.75 mi
Loading nearby amenities…
Taxation est. · year 1
- Rental income
- $22,236
- − Mortgage interest
- −$13,388
- − Property taxes
- −$1,998
- − Insurance
- −$1,195
- − Repairs & maintenance
- −$1,779
- − Management
- −$1,779
- − Depreciation
- −$6,953
- Taxable loss
- −$4,855
- Est. tax savings @ 24.0%
- +$1,165
- After-tax cash flow
- $499/yr
For passive investors: Depreciation is non-cash, so a rental often shows a tax loss while cash-flowing — sheltering income. Rental losses are passive: they offset passive income freely, and up to $25,000/yr can offset ordinary (W-2) income if you actively participate and your MAGI is under $100k (phasing out to $0 by $150k); unused losses carry forward. On sale, claimed depreciation is recaptured at up to 25%, and gains may owe capital-gains tax (a 1031 exchange can defer both). Figures are a year-1 estimate at your 24.0% rate — not tax advice; consult a CPA.
Schools (NCES district)
- District
- Henrico County Public School District
- NCES district ID
- 5101890
- Math proficiency
- 49% ▼ -32.00%
- Reading proficiency
- 64% ▼ -12.00%
- Median HH income
- $61,854
- Composite
- 49.25/100
- National rank
- #2031
- State rank
- #68 of 131 in VA
Livability — Highland Springs
- Score
- 72/100
- State rank
- #196
- US rank
- #6085
Category grades
Schools grade is shown separately in the Schools card above.
Census & demographics
- Census place
- Highland Springs, VA
- County
- Henrico County · 334,490 people
- City population
- 8,347
- Metro
- Richmond, VA
- Population (ZIP)
- 8,347
- Household income
- $55,567
- Rent vs Own
- Severe rent burden
- 283.0
Population outlook (Henrico County) Hauer SSP2
- Today (2025)
- 365,885 people
- By 2030
- 384,255 · +5.0%
- By 2040
- 416,688 · +13.9%
- By 2050
- 442,376 · +20.9%
- By 2075
- 488,037 · +33.4%
- By 2100
- 487,430 · +33.2%
Race, ethnicity, and origin ACS 2023
- Neighborhood character
- Majority Black (62%)
- Race & ethnicity
- Black 62% White 29% Two or more races 6% Hispanic / Latino 2%
- Common ancestry
- Slovak 2% Lithuanian 1% Romanian 1%
- Foreign-born
- 7% · Canada
- Languages at home
- 97% English-only · French/Haitian/Cajun 2% Spanish 1%
Political lean MEDSL · Henrico
- 2024 margin
- Strong D (+28.9) · D 63.7% · R 34.8% · Other 1.5%
- 2008→2024 swing
- +16.6pp toward D · 2008: 12.2pp · 2024: 28.9pp
- All cycles
- 2024: D+28.9 2020: D+29.0 2016: D+21.0 2012: D+11.7 2008: D+12.2
Not yet ingested
- Civics
- —
Market trends
- HPI YoY
- ▼ -72.15%
- Current HPI
- 458.732
- Rent YoY
- —
- Metro
- Richmond, VA
- State GDP YoY
- ▲ 2.40%
- F500 in state
- 50
Industry mix (Fortune 500 HQ in VA)
| Industry | F500 HQs | Revenue |
|---|---|---|
| Aerospace / Defense | 4 | $236B |
|
||
| Technology / Defense | 3 | $32B |
|
||
| Financial Services | 2 | $176B |
|
||
| Utilities | 2 | $27B |
|
||
| Insurance | 2 | $25B |
|
||
| Technology | 2 | $15B |
|
||
Price history
+446.3% since first listed6 events — show timeline
- 2026-05-29 Sold (Public Records) $239,000 Public Records
- 2026-05-28 Sold (MLS) $239,000 CVRMLS
- 2026-05-08 Pending — CVRMLS
- 2026-05-07 Listed $239,000 CVRMLS
- 2026-04-26 Coming Soon $239,000 CVRMLS
- 1980-08-01 Sold (Public Records) $43,747 Public Records
Property tax history
+7.6%/yrLatest (2025): $1,998 · +9.9% YoY. Source: county tax records.
Cash-flow waterfall
monthlySold comps — $/sqft
last 12 mo · ≤1 miLoading sold comps…