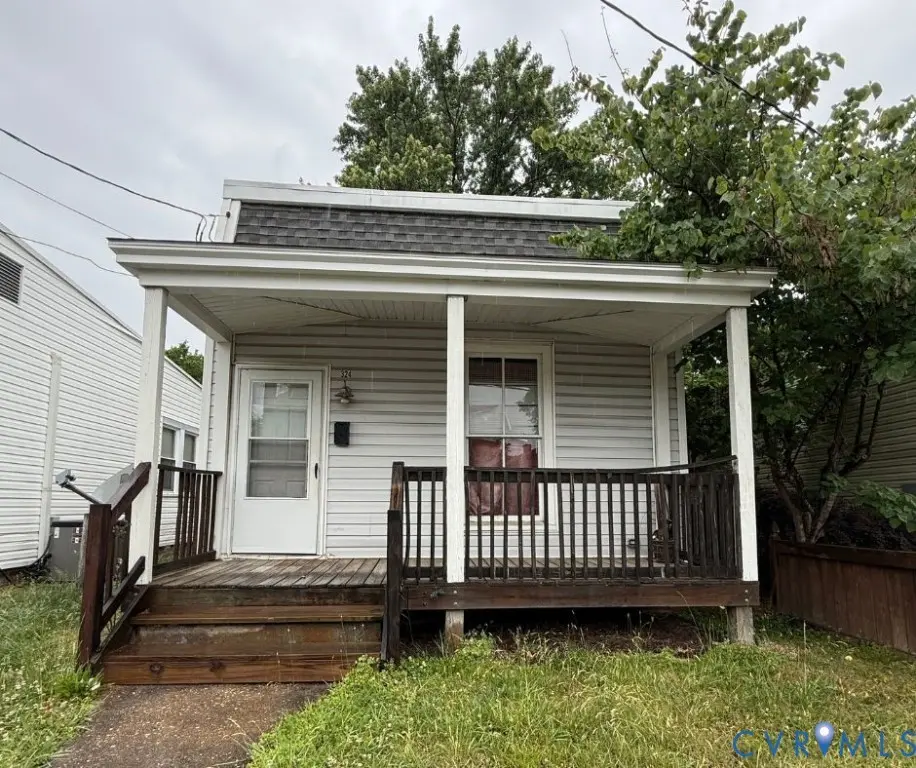
324 Hunt Ave · Richmond, VA
Flood risk 1/10 · Minimal
- FEMA flood zone
- X (unshaded)
- Chance of flooding over 30 yrs
- 0.0%
- Est. flood insurance / yr
- $507 – $1,088
Fire risk 3/10 · Minor
- Est. fire insurance / yr
- $666 – $1,236
Heat risk 8/10 · Major
- Hot days now (above 105°F)
- 7 days/yr
- Hot days in 30 yrs
- 17 days/yr
Wind risk 6/10 · Moderate
- Chance of severe wind over 30 yrs
- 27.0%
Air-quality risk 2/10 · Minimal
- Unhealthy air days now
- 1 days/yr
- Unhealthy air days in 30 yrs
- 3 days/yr
Risk factors via First Street. Map © Google.
Why this score? — see what drove the B grade
The composite is a weighted blend of 9 inputs, each scored 0–100. Each bar is that input's sub-score; the figure is the points it added to the 100-point composite (weight × sub-score).
- Cash flow +26.5/30.0
- ARV discount +15.0/15.0
- DSCR +9.0/10.0
- 1% rule +6.4/10.0
- Rent growth +4.4/5.0
- Livability +4.2/5.0
- Schools +3.3/10.0
- Condition / age +2.5/5.0
- Appreciation +0.0/10.0
$125,000
🖨 Deal sheet 📄 Offer letter ✓ Due diligence
Listing remarks MLS
Investor's special! This home is waiting for an investor to bring it back to life as a cash-flowing rental or potential renovation. Located near bus lines and minutes from interstate in Richmond's North Side. House is being sold as-is.
Key facts
- 4,051 sq ft lot
- Built 1923
- Listed 14 days
Property features AI
Exterior
- Parking: Alley access; No garage; Off-street parking; On-street parking
- Utilities: Public water; Public sewer
- Home design: Single-story home; R-5 zoning
- Construction: Frame construction with drywall and vinyl siding; Flat, metal and shingle roof
- Exterior features: Front porch; Porch
Interior
- Kitchen: Stove; Eat-in kitchen
- Bedrooms: Bedroom located on the main level
- Flooring: Carpet; Vinyl
- Bathrooms: 1 full bathroom with tub and shower
- Heating & cooling: Heat pump heating and cooling; Electric heating; Central air
- Interior features: Thermal windows; Insulated doors; Ceiling fan(s); Eat-in kitchen; Bedroom on main level
- Laundry & utility: Electric water heater
Neighborhood map
What this means for you Summary
Snapshot
- This is a 2-bed/1.0-bath single-family listed at $125k.
Deal economics
- At list price, monthly cash flow is $330 ($4k/yr) — positive.
- The deal already cash-flows at list — no discount required.
- Meets the 1% rule at list price ($1k rent vs $125k).
- Cap rate 9.5% vs local median 3.3% in Richmond — top-decile yield for the area; either an underpriced asset or a hidden risk that comps aren't pricing in. Stress-test before assuming the spread holds.
Location & tenants
- Location reads 84/100 on livability (#33 in VA, #793 nationally) — a professional / high-income tenant draw. Strengths: amenities A+, commute A+, health & safety A+; Watch: crime D-.
- Richmond City Public School District (urban): math 32% / reading 47% proficiency, ranked #123 of 131 in VA (top 94%) — families likely to look elsewhere, expect single-tenant / working-renter base with shorter leases; 74% free/reduced lunch — lower-income household profile, screen leases tightly.
- Market conditions: Rents rising fast (+7.4%/yr); 179 active listings in the ZIP; 12 comparable units currently listed for rent nearby; rentals at typical pace (median 20d on market — plan ~3-4 weeks tenant-placement turnaround); 2,540 units permitted in Richmond city in 2024 (2,077 in 5+ unit buildings).
Forward outlook
- Local home prices are declining (-3.0%/yr); year-one equity from $864 of loan paydown is wiped out by about $4k of value loss. Plan a longer hold.
- Richmond County population projected at +40% by 2050 — long-run rental-demand tailwind backs the buy-and-hold thesis.
- At projected returns (-3.0% appreciation + 7.4% rent growth), your $35k cash investment doubles in ~8 years — after that, you're playing with house money.
Negotiation context
- Only 14 days on market — expect competitive offers; lowballing is unlikely to land.
- 11 sale attempts since 21y ago with the ask held roughly flat each time — persistent listings suggest the price (not the market) is what's stuck; bring a comps-based counter.
- Current owner paid $33k; list at $125k implies a 279% gain — meaningful room to come down on a strong offer.
Risks & watch-outs
- Watch-outs: built in 1923 — expect roof / HVAC / electrical / plumbing capex.
- Climate carrying-cost: major wind risk, 27% chance of damaging wind over 30y; extreme-heat days projected 7→17/yr by 2055 (HVAC capex compounding) — expect insurance premiums to compound above CPI over the hold.
Questions for the listing agent
- Built in 1923 — when were the roof, HVAC, electrical panel, plumbing, and water heater last replaced?
- Is there a deadline driving the sale (1031 exchange, divorce, estate, relocation)? That informs how much negotiation room exists.
- Schools are A-rated — typically a magnet for longer-tenancy family renters. What's the average tenant stay here, and is there a school-zone premium baked into asking?
- Crime grade is D in this area — have there been break-ins, vandalism, or insurance claims at this property in the last 3 years? What carrier currently insures it and at what premium?
- What's the average days-on-market for RENTAL listings here right now (not sales)? A rising rental-DOM trend means longer vacancies and softer asking-rent achievability than the comps imply.
- What's the recent tenant-quality profile in this submarket — average credit score on applications, eviction rate, late-payment / NSF rate, and stable-employment percentage? A property-management company in the area should have these aggregated.
- How much new for-sale + rental construction is in the pipeline within 1–3 miles? Heavy new supply typically softens prices + rents 12–24 months out; constrained supply supports both.
Investment metrics
- 1% rule
- 1.14% ✓
- Cap rate
- 9.46%
- Cash-on-cash
- 11.30%
- DSCR
- 1.50
- GRM
- 7.3
CMA / ARV
- ARV (median comp)
- $227,632
- List price
- $125,000
- Delta
- -45.09%
- Verdict
- UNDERPRICED
- Comps
- 20 within 1.0 mi
Show comp detail 12 sales within ~0.75 mi
| Address | Dist | Beds/Ba | Sqft | Sold | Price | $/sf | Match |
|---|---|---|---|---|---|---|---|
| 324 Hunt Ave | 0.00mi | 2/1.0 | 702 (0%) | 0mo | $114,000 | $162 | 100 |
| 611 Milton St | 0.37mi | 2/1.0 | 720 (+3%) | 1mo | $155,000 | $215 | 78 |
| 506 Hunt Ave | 0.24mi | 2/1.0 | 679 (-3%) | 12mo | $150,000 | $221 | 73 |
| 3607 Edgeton Cir | 0.33mi | 2/1.0 | 720 (+3%) | 13mo | $170,501 | $237 | 70 |
| 3507 Meadowbridge Rd | 0.34mi | 2/1.0 | 686 (-2%) | 13mo | $245,000 | $357 | 69 |
| 3511 Meadowbridge Rd | 0.34mi | 2/1.0 | 680 (-3%) | 14mo | $202,000 | $297 | 68 |
| 3606 Meadowbridge Rd | 0.30mi | 2/1.0 | 679 (-3%) | 15mo | $172,500 | $254 | 68 |
| 105 E Laburnum Ave | 0.35mi | 2/1.0 | 768 (+9%) | 2mo | $160,000 | $208 | 66 |
| 107 E Laburnum Ave | 0.35mi | 2/1.0 | 768 (+9%) | 3mo | $190,000 | $247 | 66 |
| 411 Patrick Ave | 0.11mi | 2/1.0 | 630 (-10%) | 17mo | $235,000 | $373 | 64 |
| 416 Milton St | 0.16mi | 2/1.0 | 807 (+15%) | 24mo | $150,000 | $186 | 48 |
| 210 W Laburnum Ave | 0.61mi | 2/1.0 | 804 (+14%) | 9mo | $150,000 | $187 | 40 |
Match score weights: distance 35% · size 25% · config 20% · recency 20%. Top-matched comps best support the ARV.
Projected returns pro-forma
-3.0% appreciation · 7.43% rent growth · sell at horizon
- IRR
- 5.2%
- Equity multiple
- 1.21×
- Total profit
- $7,330
- Equity at exit
- $18,638
- IRR
- 18.1%
- Equity multiple
- 2.80×
- Total profit
- $63,087
- Equity at exit
- $10,808
Cash invested: $35,000 (down + closing). Projections, not guarantees.
Landlord ↔ Tenant lean methodology
- Overall (STATE)
- 55 Moderately Landlord-Leaning
- State Virginia
- 55 Moderately Landlord-Leaning · D+2
- County
- — inherits STATE
- City
- — inherits STATE
ZIP-level market 23222
- Rents YoY
- 7.4%
- Active inventory
- 179
- Price-to-rent
- 7.3×
Monthly cashflow live
- Estimated rent
- $1,422 high interval (Pro) →
- Mortgage (P&I)
- −$656
- Tax from tax record
- −$86 /mo · $1,032/yr
- Insurance
- −$52
- HOA
- −$0
- Vacancy / Maint / Mgmt
- −$299
- Net cashflow
- $330
Break-even live
UW: 25.0% down · 7.5% · 30yr · 1.5% tax · 5.0% vac · 8.0% maint · 8.0% mgmt
Financing live
Cash to close
- Down payment
- $31,250
- Closing costs
- $3,750
- Reserves months
- —
- Total cash needed
- —
Loan-product check · same deal, 3 products live
Conventional
25% down · 7.5% · 30yr
- Down + closing
- —
- Monthly P&I
- —
- Monthly cashflow
- —
- DSCR
- —
- Eligible?
- —
Personal DTI + credit; lowest rate.
DSCR
20% down · 8.5% · 30yr
- Down + closing
- —
- Monthly P&I
- —
- Monthly cashflow
- —
- DSCR
- —
- Eligible?
- —
No personal income docs; deal must DSCR.
Hard money
10% down · 12.0% · 12mo
- Down + closing
- —
- Monthly P&I
- —
- Monthly cashflow
- —
- DSCR
- —
- Eligible?
- —
Short-term bridge; refi at stabilization.
Rent comps 12 comps
| Address | Beds | Baths | Sqft | Rent | $/sqft | DOM | Units | Dist |
|---|---|---|---|---|---|---|---|---|
| 106 Trafton St Richmond, VA | 2.0 | 1.0 | 720 | $1,600 | $2.22 | 2d | 1 | 0.24mi |
| 106 Trafton St Richmond, VA | 2.0 | 1.0 | 720 | $1,600 | $2.22 | 17d | 1 | 0.24mi |
| 3114 Barton Ave Apt B Richmond, VA | 1.0 | 1.0 | 500 | $962 | $1.92 | 19d | 1 | 0.50mi |
| 3813 Chamberlayne Ave Richmond, VA | 1.0 | 1.0 | 625 | $785 | $1.26 | 43d | 1 | 1.05mi |
| 3503 Seminary Ave Richmond, VA | 1.0 | 1.0 | 670 | $1,100 | $1.64 | 4d | 1 | 1.05mi |
| 3012 Chamberlayne Ave Unit 105 Richmond, VA | 1.0 | 1.0 | 700 | $895 | $1.28 | 43d | 1 | 1.05mi |
| 3012 Chamberlayne Ave Unit 105 Richmond, VA | 1.0 | 1.0 | 700 | $895 | $1.28 | 23d | 1 | 1.05mi |
| 3810 Chamberlayne Ave Unit G Richmond, VA | 2.0 | 1.0 | 750 | $1,095 | $1.46 | 17d | 1 | 1.12mi |
| 3200 Brook Rd Richmond, VA | 1.0–2.0 | 1.0–2.5 | 968 | $2,633 | $2.72 | 1d | 20 | 1.21mi |
| 3916 Chamberlayne Ave Unit 4A Richmond, VA | 1.0 | 1.0 | 580 | $969 | $1.67 | 23d | 1 | 1.28mi |
| 3916 Chamberlayne Ave Unit 4A Richmond, VA | 1.0 | 1.0 | 580 | $969 | $1.67 | 19d | 1 | 1.28mi |
| 2000 Lamb Ave Apt C Richmond, VA | 2.0 | 1.0 | 750 | $1,295 | $1.73 | 43d | 1 | 1.44mi |
Listing history 23 events
-
2026-05-15$125,000 Active 535-char remark
-
2017-08-14soldstatus $33,000
-
2017-08-08soldstatus $33,000 Closed 235-char remark
Show marketing remark (235 chars)
Investor's special! This home is waiting for an investor to bring it back to life as a cash-flowing rental or potential renovation. Located near bus lines and minutes from interstate in Richmond's North Side. House is being sold as-is.
-
2017-07-07status Pending 235-char remark
Show marketing remark (235 chars)
Investor's special! This home is waiting for an investor to bring it back to life as a cash-flowing rental or potential renovation. Located near bus lines and minutes from interstate in Richmond's North Side. House is being sold as-is.
-
2017-06-29status Active 235-char remark
Show marketing remark (235 chars)
Investor's special! This home is waiting for an investor to bring it back to life as a cash-flowing rental or potential renovation. Located near bus lines and minutes from interstate in Richmond's North Side. House is being sold as-is.
-
2017-06-15status Pending 235-char remark
Show marketing remark (235 chars)
Investor's special! This home is waiting for an investor to bring it back to life as a cash-flowing rental or potential renovation. Located near bus lines and minutes from interstate in Richmond's North Side. House is being sold as-is.
-
2017-06-12$45,000 Active 235-char remark
Show marketing remark (235 chars)
Investor's special! This home is waiting for an investor to bring it back to life as a cash-flowing rental or potential renovation. Located near bus lines and minutes from interstate in Richmond's North Side. House is being sold as-is.
-
2009-09-22historical
-
2009-09-22historical
-
2009-09-22historical
-
2008-01-23historical
-
2007-06-26$79,900
-
2007-06-26$79,900
-
2007-05-31historical
-
2007-01-26$88,000
-
2007-01-26$88,000
-
2006-12-31historical
-
2006-05-17$90,000
-
2006-05-17$90,000
-
2005-11-28soldstatus $22,000
-
2005-11-28soldstatus $22,000
-
2005-10-28$25,900
-
2005-10-28$25,900
ⓘ Source: listings_history table (triggers on properties + properties_extension) + one-shot
backfill from property_details.listing_events for pre-trigger history.
Tax reassessment forecast VA · Resets to sale price
- Current annual tax
- $1,032 · $86/mo
- Projected year-2 tax
- $1,032 · $86/mo
- Expected delta
- $0/yr ($0/mo · 0.0%)
ⓘ Screening estimate from a state-policy table — verify with the county assessor before closing.
Climate risk First Street
- Flood 1/10 Low FEMA zone X (unshaded) · 0% chance over 30 yrs
- Wildfire 3/10 Moderate
- Heat 8/10 Severe 7 d/yr ≥105°F today · 17 d/yr by 30 yrs out
- Wind 6/10 Major 27% chance of damaging wind over 30 yrs
- Air quality 2/10 Low 1 unhealthy d/yr today · 3 by 30 yrs out
Nearby sold comps map
Loading sold comps map…
Walkable amenities ~0.75 mi
Loading nearby amenities…
Taxation est. · year 1
- Rental income
- $17,060
- − Mortgage interest
- −$7,002
- − Property taxes
- −$1,032
- − Insurance
- −$625
- − Repairs & maintenance
- −$1,365
- − Management
- −$1,365
- − Depreciation
- −$3,636
- Taxable income
- $2,035
- Est. tax owed @ 24.0%
- −$488
- After-tax cash flow
- $3,466/yr
For passive investors: Depreciation is non-cash, so a rental often shows a tax loss while cash-flowing — sheltering income. Rental losses are passive: they offset passive income freely, and up to $25,000/yr can offset ordinary (W-2) income if you actively participate and your MAGI is under $100k (phasing out to $0 by $150k); unused losses carry forward. On sale, claimed depreciation is recaptured at up to 25%, and gains may owe capital-gains tax (a 1031 exchange can defer both). Figures are a year-1 estimate at your 24.0% rate — not tax advice; consult a CPA.
Schools (NCES district)
- District
- Richmond City Public School District
- NCES district ID
- 5103240
- Math proficiency
- 32% ▼ -24.00%
- Reading proficiency
- 47% ▼ -9.00%
- Median HH income
- $40,276
- Composite
- 33.09/100
- National rank
- #5564
- State rank
- #123 of 131 in VA
Livability — Richmond
- Score
- 84/100
- State rank
- #33
- US rank
- #793
Category grades
Schools grade is shown separately in the Schools card above.
Census & demographics
- Census place
- Richmond, VA
- County
- Richmond City · 178,280 people
- City population
- 287,109
- Metro
- Richmond, VA
- Population (ZIP)
- 26,322
- Household income
- $61,345
- Rent vs Own
- Severe rent burden
- 1325.0
Population outlook (Richmond County) Hauer SSP2
- Today (2025)
- 262,263 people
- By 2030
- 284,503 · +8.5%
- By 2040
- 327,353 · +24.8%
- By 2050
- 367,946 · +40.3%
- By 2075
- 449,560 · +71.4%
- By 2100
- 500,301 · +90.8%
Race, ethnicity, and origin ACS 2023
- Neighborhood character
- Predominantly Black (70%)
- Race & ethnicity
- Black 70% White 21% Two or more races 4% Hispanic / Latino 3% Asian 2%
- Common ancestry
- Lithuanian 1% Italian 1% Serbian 1%
- Foreign-born
- 5% · Canada
- Languages at home
- 95% English-only · Spanish 2% Other Indo-European 1%
Political lean MEDSL · Richmond
- 2024 margin
- Solid D (+66.3) · D 82.0% · R 15.8% · Other 2.2%
- 2008→2024 swing
- +7.2pp toward D · 2008: 59.1pp · 2024: 66.3pp
- All cycles
- 2024: D+66.3 2020: D+68.0 2016: D+63.8 2012: D+55.7 2008: D+59.1
Not yet ingested
- Civics
- —
Market trends
- HPI YoY
- ▼ -288.72%
- Current HPI
- 428.4029
- Rent YoY
- ▲ 7.43%
- Metro
- Richmond, VA
- State GDP YoY
- ▲ 2.40%
- F500 in state
- 50
Industry mix (Fortune 500 HQ in VA)
| Industry | F500 HQs | Revenue |
|---|---|---|
| Aerospace / Defense | 4 | $236B |
|
||
| Technology / Defense | 3 | $32B |
|
||
| Financial Services | 2 | $176B |
|
||
| Utilities | 2 | $27B |
|
||
| Insurance | 2 | $25B |
|
||
| Technology | 2 | $15B |
|
||
Price history
+382.6% since first listed24 events — show timeline
- 2026-05-29 Pending — CVRMLS
- 2026-05-15 Listed $125,000 CVRMLS
- 2017-08-14 Sold (Public Records) $33,000 Public Records
- 2017-08-08 Sold (MLS) $33,000 CVRMLS
- 2017-07-07 Pending — CVRMLS
- 2017-06-29 Relisted — CVRMLS
- 2017-06-15 Pending — CVRMLS
- 2017-06-12 Listed $45,000 CVRMLS
- 2009-09-22 Listing Removed — CVRMLS
- 2009-09-22 Listing Removed — CVRMLS
- 2009-09-22 Listing Removed — CVRMLS
- 2008-01-23 Listing Removed — CVRMLS
- 2007-06-26 Listed $79,900 CVRMLS
- 2007-06-26 Listed $79,900 CVRMLS
- 2007-05-31 Listing Removed — CVRMLS
- 2007-01-26 Listed $88,000 CVRMLS
- 2007-01-26 Listed $88,000 CVRMLS
- 2006-12-31 Listing Removed — CVRMLS
- 2006-05-17 Listed $90,000 CVRMLS
- 2006-05-17 Listed $90,000 CVRMLS
- 2005-11-28 Sold (MLS) $22,000 CVRMLS
- 2005-11-28 Sold (MLS) $22,000 CVRMLS
- 2005-10-28 Listed $25,900 CVRMLS
- 2005-10-28 Listed $25,900 CVRMLS
Property tax history
+1.4%/yrLatest (2022): $1,032 · -8.9% YoY. Source: county tax records.
Cash-flow waterfall
monthlySold comps — $/sqft
last 12 mo · ≤1 miLoading sold comps…