3546 S Ocean Blvd #516 · South Palm Beach, FL
Flood risk 9/10 · Severe
- FEMA flood zone
- AE
- Chance of flooding over 30 yrs
- 0.99%
- Est. flood insurance / yr
- $1,737 – $8,500
Fire risk 1/10 · Minimal
- Est. fire insurance / yr
- $947 – $1,759
Heat risk 9/10 · Severe
- Hot days now (above 104°F)
- 7 days/yr
- Hot days in 30 yrs
- 24 days/yr
Wind risk 10/10 · Severe
- Chance of severe wind over 30 yrs
- 99.0%
Air-quality risk 2/10 · Minimal
- Unhealthy air days now
- 2 days/yr
- Unhealthy air days in 30 yrs
- 2 days/yr
Risk factors via First Street. Map © Google.
Why this score? — see what drove the D grade
The composite is a weighted blend of 9 inputs, each scored 0–100. Each bar is that input's sub-score; the figure is the points it added to the 100-point composite (weight × sub-score).
- Cash flow +7.6/30.0
- Appreciation +7.6/10.0
- ARV discount +7.5/15.0
- 1% rule +6.3/10.0
- Schools +4.3/10.0
- Livability +3.6/5.0
- Rent growth +3.5/5.0
- Condition / age +2.5/5.0
- DSCR +1.7/10.0
$395,000
🖨 Deal sheet 📄 Offer letter ✓ Due diligence
Listing remarks
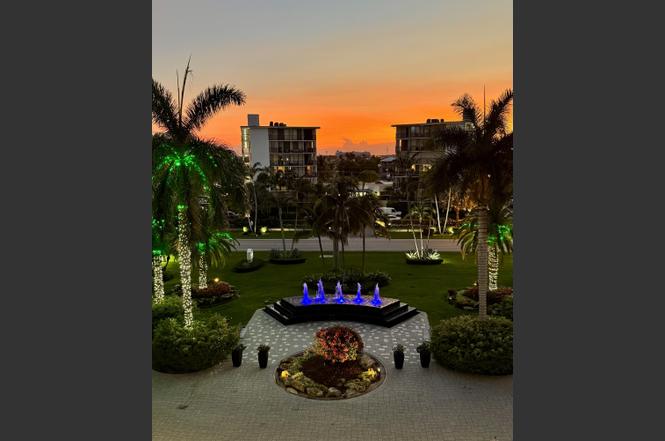
Welcome to The Barclay, an oceanfront community where luxury meets beachfront living. Enjoy sunset views from this spacious, rarely available 1-bedroom with a convertible guest space and 2 full baths, offering a great opportunity to update and personalize to your taste. The Barclay offers resort-style amenities, including a serene pool and pool area, a state-of-the-art fitness center, well-maintained tennis courts, and more, making it easy to relax and unwind in style. Don't miss your chance to own in this desirable beachfront community. Schedule a showing today and experience The Barclay for yourself!
Key facts
- Oceanfront community
- Sunset views
- Serene pool
Tags
Property features AI
Finance
- Financial info: Pets not allowed
- HOA & community: Community amenities: billiard room, elevators, fitness center, game room, laundry, parking, pool, sauna, storage, tennis courts, on-site manager, trash chute, bike storage, business center, community room, library, sidewalks; Monthly association fee (amount provided to MLS) covering cable TV, insurance, grounds maintenance, pest control, sewer, trash, water, common areas, and elevator
Exterior
- Parking: Assigned covered parking including garage and under-building spaces; 1 garage space, 1 covered space; Guest parking available
- Security: Closed circuit camera(s); Key card entry; Security system; Lobby attended
- Utilities: Public water; Public sewer; Cable available; Water and sewer available
- Home design: Condominium; Resale unit; Building faces southwest; 9-story building
- Construction: Concrete construction; Building plans list total building area
- Exterior features: Deck; Ocean access waterfront
Interior
- Kitchen: Dishwasher; Refrigerator; Electric water heater
- Bedrooms: 1 bedroom on the main level
- Flooring: Carpet
- Bathrooms: 2 full bathrooms (both on the main level)
- Heating & cooling: Electric central heating (individual unit); Electric central cooling (individual unit)
- Interior features: Walk-in closets; Closed circuit cameras, key card entry, security system, and attended lobby
- Laundry & utility: Building laundry available; Washer/dryer connections not specified
Neighborhood map
What this means for you Summary
Snapshot
- This is a 1-bed/2.0-bath condo listed at $395k.
Deal economics
- At list price, monthly cash flow is $-900 ($-11k/yr) — negative.
- To cash-flow at today's rent, offer at most $236k (40.2% below list).
- Meets the 1% rule at list price ($4k rent vs $395k).
- Recommended offer: $236k (40.2% below list) — sets the bar for cash-flow.
Location & tenants
- Location reads 72/100 on livability (#340 in FL) — a middle-class / working-renter tenant base. Strengths: crime A+, housing A+, health & safety A+; Watch: schools C-, amenities F, commute F.
- Palm Beach (suburban): math 46% / reading 53% proficiency, ranked #34 of 73 in FL (top 47%) — families likely to look elsewhere, expect single-tenant / working-renter base with shorter leases.
- Market conditions: Rents rising (+3.9%/yr); 447 active listings in the ZIP; 40 comparable units currently listed for rent nearby; rentals at typical pace (median 25d on market — plan ~3-4 weeks tenant-placement turnaround); high-income renter base; 3,974 units permitted in Palm Beach County in 2024 (1,012 in 5+ unit buildings).
- This rent runs 35% of the median local income ($151k/yr) — at the standard rent-burdened threshold; future hikes will face affordability resistance.
Forward outlook
- In year one you build about $23k of equity ($3k loan paydown + $20k appreciation (5.1% local appreciation)).
- Palm Beach County population projected at +30% by 2050 — long-run rental-demand tailwind backs the buy-and-hold thesis.
- By year 2, paydown + projected appreciation supports a ~$37k cash-out refi (75% LTV) — recoverable capital for the next deal without selling this one.
Negotiation context
- It's been on market 88 days — a 6% lower offer ($371k) is reasonable based on typical stale-listing flexibility.
- 4 sale attempts since 26y ago; this cycle's ask has dropped $45k (10%) from the opening price — seller is motivated, your offer sets the floor, not the list.
- Current owner paid $129k; list at $395k implies a 206% gain — meaningful room to come down on a strong offer.
Risks & watch-outs
- Watch-outs: flood insurance adds $427/mo; HOA is 34% of rent.
- Climate carrying-cost: in FEMA flood zone AE (mandatory federal flood insurance); severe wind risk, 99% chance of damaging wind over 30y; extreme-heat days projected 7→24/yr by 2055 (HVAC capex compounding) — expect insurance premiums to compound above CPI over the hold.
Questions for the listing agent
- What do current leases actually rent for vs. the listed asking? Can we see a recent rent roll and the last 12 months of T-12 income?
- It's been on market 88 days. Have you received any prior offers? Is the seller open to a 40% concession, seller financing, or rate buy-down credit?
- Built in 1974 — when were the roof, HVAC, electrical panel, plumbing, and water heater last replaced?
- What's the actual annual flood-insurance premium (NFIP or private), and is the property in a SFHA with mandatory coverage?
- What does the HOA fee cover, when was the last increase, and are there any pending special assessments or reserve-fund shortfalls?
- Any open or pending special assessments — roof, HVAC, plumbing, elevator, façade? What's the per-unit balance and payoff schedule, and is the seller paying it off at close or rolling it to the buyer?
- Why hasn't it sold? Are there any deal-killer items the seller is aware of (foundation, flood, title, zoning, code violations)?
- Is there a deadline driving the sale (1031 exchange, divorce, estate, relocation)? That informs how much negotiation room exists.
- The area grade is low — what's the realistic commute time and amenity access for the typical tenant pool here? Any planned neighborhood developments (good or bad) we should know about?
- What's the average days-on-market for RENTAL listings here right now (not sales)? A rising rental-DOM trend means longer vacancies and softer asking-rent achievability than the comps imply.
- What's the recent tenant-quality profile in this submarket — average credit score on applications, eviction rate, late-payment / NSF rate, and stable-employment percentage? A property-management company in the area should have these aggregated.
- How much new apartment / multifamily construction is in the pipeline within 1–3 miles? Heavy new supply (>2% of stock underway) typically softens rents 12–24 months out; light construction supports rent growth.
Investment metrics
- 1% rule
- 1.13% ✓
- Cap rate
- 4.86%
- Cash-on-cash
- -5.13%
- DSCR
- 0.77
- GRM
- 7.4
CMA / ARV
No comps found within radius.
Projected returns pro-forma
5.12% appreciation · 3.92% rent growth · sell at horizon
- IRR
- 5.7%
- Equity multiple
- 1.38×
- Total profit
- $41,600
- Equity at exit
- $226,603
- IRR
- 8.7%
- Equity multiple
- 2.67×
- Total profit
- $184,697
- Equity at exit
- $393,390
Cash invested: $110,600 (down + closing). Projections, not guarantees.
Landlord ↔ Tenant lean methodology
- Overall (STATE)
- 87 Strongly Landlord-Friendly
- State Florida
- 87 Strongly Landlord-Friendly · R+3
- County
- — inherits STATE
- City
- — inherits STATE
ZIP-level market 33480
- Home prices YoY
- 1.1%
- Rents YoY
- 3.9%
- Active inventory
- 447
- Price-to-rent
- 7.4×
Monthly cashflow live
- Estimated rent
- $4,446 high interval (Pro) →
- Mortgage (P&I)
- −$2,071
- Tax from tax record
- −$230 /mo · $2,763/yr
- Insurance
- −$165
- Flood insurance flood zone
- −$427 /mo · $5,118/yr
- HOA
- −$1,519
- Vacancy / Maint / Mgmt
- −$934
- Net cashflow
- $-900
Break-even live
UW: 25.0% down · 7.5% · 30yr · 1.5% tax · 5.0% vac · 8.0% maint · 8.0% mgmt
Financing live
Cash to close
- Down payment
- $98,750
- Closing costs
- $11,850
- Reserves months
- —
- Total cash needed
- —
Loan-product check · same deal, 3 products live
Conventional
25% down · 7.5% · 30yr
- Down + closing
- —
- Monthly P&I
- —
- Monthly cashflow
- —
- DSCR
- —
- Eligible?
- —
Personal DTI + credit; lowest rate.
DSCR
20% down · 8.5% · 30yr
- Down + closing
- —
- Monthly P&I
- —
- Monthly cashflow
- —
- DSCR
- —
- Eligible?
- —
No personal income docs; deal must DSCR.
Hard money
10% down · 12.0% · 12mo
- Down + closing
- —
- Monthly P&I
- —
- Monthly cashflow
- —
- DSCR
- —
- Eligible?
- —
Short-term bridge; refi at stabilization.
Rent comps 40 comps
| Address | Beds | Baths | Sqft | Rent | $/sqft | DOM | Units | Dist |
|---|---|---|---|---|---|---|---|---|
| 3560 S Ocean Blvd #706 Palm Beach, FL | 2.0 | 2.0 | 1340 | $12,000 | $8.96 | 20d | 1 | 0.05mi |
| 3560 S Ocean Blvd #907 Palm Beach, FL | 2.0 | 2.0 | 1340 | $7,800 | $5.82 | 11d | 1 | 0.05mi |
| 3560 S Ocean Blvd #907 Palm Beach, FL | 2.0 | 2.0 | 1340 | $7,500 | $5.60 | 11d | 1 | 0.05mi |
| 3560 S Ocean Blvd #4 Palm Beach, FL | 2.0 | 2.0 | 1340 | $7,950 | $5.93 | 24d | 1 | 0.05mi |
| 3560 S Ocean Blvd #306 Palm Beach, FL | 2.0 | 2.0 | 1380 | $7,000 | $5.07 | 18d | 1 | 0.05mi |
| 3560 S Ocean Blvd #502 Palm Beach, FL | 2.0 | 2.0 | 1340 | $9,500 | $7.09 | 24d | 1 | 0.05mi |
| 3540 S Ocean Blvd #310 Palm Beach, FL | 1.0 | 1.5 | 785 | $2,100 | $2.68 | 7d | 1 | 0.06mi |
| 3540 S Ocean Blvd #309 Palm Beach, FL | 1.0 | 1.5 | 785 | $2,400 | $3.06 | 5d | 1 | 0.06mi |
| 3540 S Ocean Blvd #612 Palm Beach, FL | 2.0 | 2.0 | 983 | $4,700 | $4.78 | 7d | 1 | 0.06mi |
| 3540 S Ocean Blvd #309 Palm Beach, FL | 1.0 | 1.5 | 785 | $2,300 | $2.93 | 5d | 1 | 0.06mi |
| 3540 S Ocean Blvd #216 Palm Beach, FL | 2.0 | 2.0 | 983 | $2,550 | $2.59 | 22d | 1 | 0.06mi |
| 3540 S Ocean Blvd #208 Palm Beach, FL | 2.0 | 2.0 | 983 | $2,750 | $2.80 | 4d | 1 | 0.06mi |
| 3540 S Ocean Blvd #608 Palm Beach, FL | 2.0 | 2.0 | 983 | $2,950 | $3.00 | 24d | 1 | 0.06mi |
| 3540 S Ocean Blvd Palm Beach, FL | 1.0 | 2.0 | 983 | $4,000 | $4.07 | 24d | 1 | 0.06mi |
| 3520 S Ocean Blvd Unit H404 Palm Beach, FL | 2.0 | 2.0 | 1176 | $5,900 | $5.02 | 24d | 1 | 0.11mi |
| 3580 S Ocean Blvd Unit 6B Palm Beach, FL | 1.0 | 1.5 | 1013 | $2,500 | $2.47 | 15d | 1 | 0.14mi |
| 3500 S Ocean Blvd Palm Beach, FL | 1.0 | 1.0 | 580 | $1,950 | $3.36 | 1d | 3 | 0.16mi |
| 3581 S Ocean Blvd Unit 2B Palm Beach, FL | 1.0 | 1.5 | 940 | $2,900 | $3.09 | 17d | 1 | 0.17mi |
| 3581 S Ocean Blvd Unit 9A Palm Beach, FL | 2.0 | 2.0 | 1192 | $2,600 | $2.18 | 17d | 1 | 0.17mi |
| 3475 S Ocean Blvd #6110 Palm Beach, FL | 1.0 | 1.5 | 891 | $3,500 | $3.93 | 24d | 1 | 0.19mi |
| 3475 S Ocean Blvd #3020 Palm Beach, FL | 2.0 | 2.0 | 1395 | $5,000 | $3.58 | 24d | 1 | 0.19mi |
| 3475 S Ocean Blvd #6150 Palm Beach, FL | 2.0 | 2.0 | 1395 | $8,750 | $6.27 | 24d | 1 | 0.19mi |
| 3475 S Ocean Blvd #1030 Palm Beach, FL | 1.0 | 2.0 | 1395 | $5,500 | $3.94 | 3d | 1 | 0.19mi |
| 3475 S Ocean Blvd #3110 Palm Beach, FL | 1.0 | 1.5 | 891 | $2,600 | $2.92 | 24d | 1 | 0.19mi |
| 3475 S Ocean Blvd Palm Beach, FL | 2.0 | 2.0 | 1395 | $5,850 | $4.19 | 24d | 3 | 0.21mi |
| 3601 S Ocean Blvd Palm Beach, FL | 2.0 | 2.5 | 1408 | $2,900 | $2.06 | 19d | 2 | 0.23mi |
| 3601 S Ocean Blvd #308 Palm Beach, FL | 2.0 | 2.5 | 1408 | $3,250 | $2.31 | 18d | 1 | 0.24mi |
| 3610 S Ocean Blvd Palm Beach, FL | 1.0–3.0 | 1.5–2.0 | 1490 | $4,195 | $2.81 | 24d | 4 | 0.26mi |
| 3456 S Ocean Blvd Apt 705 Palm Beach, FL | 2.0 | 2.0 | 1457 | $3,500 | $2.40 | 24d | 1 | 0.26mi |
| 3605 S Ocean Blvd Palm Beach, FL | 2.0 | 2.0 | 1162 | $3,350 | $2.88 | 24d | 2 | 0.26mi |
| 3460 S Ocean Blvd #4150 Palm Beach, FL | 2.0 | 2.0 | 1436 | $10,500 | $7.31 | 24d | 1 | 0.27mi |
| 3456 S Ocean Blvd #105 Palm Beach, FL | 2.0 | 2.0 | 1482 | $12,000 | $8.10 | 24d | 1 | 0.27mi |
| 3456 S Ocean Blvd #6050 Palm Beach, FL | 2.0 | 2.0 | 1482 | $4,650 | $3.14 | 24d | 1 | 0.27mi |
| 3605 S Ocean Blvd #319 Palm Beach, FL | 2.0 | 2.0 | 1121 | $4,000 | $3.57 | 4d | 1 | 0.28mi |
| 3450 S Ocean Blvd Palm Beach, FL | 1.0–2.0 | 1.0–2.0 | 1236 | $2,750 | $2.22 | 7d | 9 | 0.31mi |
| 3450 S Ocean Blvd Palm Beach, FL | 1.0–2.0 | 1.0–2.0 | 1236 | $2,300 | $1.86 | 3d | 10 | 0.31mi |
| 3450 S Ocean Blvd #8120 Palm Beach, FL | 1.0 | 1.5 | 1008 | $3,500 | $3.47 | 24d | 1 | 0.31mi |
| 3450 S Ocean Blvd #3280 Palm Beach, FL | 1.0 | 1.0 | 952 | $2,500 | $2.63 | 24d | 1 | 0.31mi |
| 3450 S Ocean Blvd #1050 Palm Beach, FL | 1.0 | 1.0 | 952 | $2,950 | $3.10 | 24d | 1 | 0.31mi |
| 3450 S Ocean Blvd #4270 Palm Beach, FL | 1.0 | 1.0 | 924 | $3,250 | $3.52 | 24d | 1 | 0.31mi |
HOA detail condo
- Monthly dues
- $1,519 · $18,228/yr
- Likely covers
- poolgym
- Assessments
- None detected in remarks — confirm with the listing agent.
Listing history 15 events
-
2026-05-20status Pending
-
2026-04-27historical Active Under Contract
-
2026-04-03price $395,000
-
2026-03-15price $425,000
-
2026-02-19$440,000 Active
-
2023-10-17historical
-
2023-02-07$650,000 Active
-
2023-02-02historical
-
2013-09-22historical
-
2001-04-28soldstatus $129,000
-
2001-04-09soldstatus $130,000
-
2001-03-12historical
-
2001-02-03$139,000
-
2000-12-08$139,000
-
1989-03-03soldstatus $116,800
ⓘ Source: listings_history table (triggers on properties + properties_extension) + one-shot
backfill from property_details.listing_events for pre-trigger history.
Tax reassessment forecast FL · Resets to sale price
- Current annual tax
- $2,763 · $230/mo
- Projected year-2 tax
- $3,278 · $273/mo
- Expected delta
- +$515/yr (+$43/mo · 18.7%)
ⓘ Screening estimate from a state-policy table — verify with the county assessor before closing.
Climate risk First Street
- Flood 9/10 Extreme FEMA zone AE · 99% chance over 30 yrs
- Wildfire 1/10 Low
- Heat 9/10 Extreme 7 d/yr ≥104°F today · 24 d/yr by 30 yrs out
- Wind 10/10 Extreme 99% chance of damaging wind over 30 yrs
- Air quality 2/10 Low 2 unhealthy d/yr today · 2 by 30 yrs out
Nearby sold comps map
Loading sold comps map…
Walkable amenities ~0.75 mi
Loading nearby amenities…
Taxation est. · year 1
- Rental income
- $53,351
- − Mortgage interest
- −$22,126
- − Property taxes
- −$2,763
- − Insurance
- −$7,094
- − Repairs & maintenance
- −$4,268
- − Management
- −$4,268
- − HOA
- −$18,228
- − Depreciation
- −$11,491
- Taxable loss
- −$16,887
- Est. tax savings @ 24.0%
- +$4,053
- After-tax cash flow
- $-6,742/yr
For passive investors: Depreciation is non-cash, so a rental often shows a tax loss while cash-flowing — sheltering income. Rental losses are passive: they offset passive income freely, and up to $25,000/yr can offset ordinary (W-2) income if you actively participate and your MAGI is under $100k (phasing out to $0 by $150k); unused losses carry forward. On sale, claimed depreciation is recaptured at up to 25%, and gains may owe capital-gains tax (a 1031 exchange can defer both). Figures are a year-1 estimate at your 24.0% rate — not tax advice; consult a CPA.
Schools (NCES district)
- District
- Palm Beach
- NCES district ID
- 1201500
- Math proficiency
- 46% ▼ -16.00%
- Reading proficiency
- 53% ▼ -4.00%
- Median HH income
- $53,943
- Composite
- 42.72/100
- National rank
- #3160
- State rank
- #34 of 73 in FL
Livability — South Palm Beach
- Score
- 72/100
- State rank
- #340
- US rank
- #5907
Category grades
Schools grade is shown separately in the Schools card above.
Census & demographics
- Census place
- South Palm Beach, FL
- County
- Palm Beach County · 1,438,312 people
- Metro
- Miami-Fort Lauderdale-Pompano Beach, FL
- Population (ZIP)
- 10,924
- Household income
- $150,633
- Rent vs Own
- Severe rent burden
- 213.0
Population outlook (Palm Beach County) Hauer SSP2
- Today (2025)
- 1,637,487 people
- By 2030
- 1,743,255 · +6.5%
- By 2040
- 1,948,712 · +19.0%
- By 2050
- 2,132,979 · +30.3%
- By 2075
- 2,530,027 · +54.5%
- By 2100
- 2,706,979 · +65.3%
Race, ethnicity, and origin ACS 2023
- Neighborhood character
- Predominantly White (89%)
- Race & ethnicity
- White 89% Hispanic / Latino 7% Two or more races 6% Asian 1%
- Hispanic origin (detail)
- Mexican 1% Puerto Rican 1% Cuban 1%
- Common ancestry
- Scotch-Irish 7% Romanian 5% Italian 3%
- Foreign-born
- 20% · Canada, Dominican Republic, China
- Languages at home
- 84% English-only · Spanish 7% Other Indo-European 3% Russian/Polish/Slavic 2%
Political lean MEDSL · Palm Beach
- 2024 margin
- Toss-up / Even · D 50.0% · R 49.2%
- 2008→2024 swing
- -22.1pp toward R · 2008: 22.9pp · 2024: 0.8pp
- All cycles
- 2024: D+0.8 2020: D+12.8 2016: D+15.3 2012: D+17.0 2008: D+22.9
Not yet ingested
- Civics
- —
Market trends
- HPI YoY
- ▲ 5.12%
- Current HPI
- 464.2769
- Rent YoY
- ▲ 3.92%
- Metro
- Miami-Fort Lauderdale-Pompano Beach, FL
- State GDP YoY
- ▲ 3.28%
- F500 in state
- 36
Industry mix (Fortune 500 HQ in FL)
| Industry | F500 HQs | Revenue |
|---|---|---|
| Industrial Technology | 2 | $29B |
|
||
| Insurance | 2 | $17B |
|
||
| Retail | 1 | $60B |
|
||
| Technology Distribution | 1 | $58B |
|
||
| Homebuilding | 1 | $35B |
|
||
| Technology Manufacturing | 1 | $35B |
|
||
Price history
+238.2% since first listed15 events — show timeline
- 2026-05-20 Pending — Beaches MLS
- 2026-04-27 Contingent — Beaches MLS
- 2026-04-03 Price Changed $395,000 Beaches MLS
- 2026-03-15 Price Changed $425,000 Beaches MLS
- 2026-02-19 Listed $440,000 Beaches MLS
- 2023-10-17 Listing Removed — Beaches MLS
- 2023-02-07 Listed $650,000 Beaches MLS
- 2023-02-02 Coming Soon — Beaches MLS
- 2013-09-22 Listing Removed — Beaches MLS
- 2001-04-28 Sold (MLS) $129,000 Beaches MLS
- 2001-04-09 Sold (Public Records) $130,000 Public Records
- 2001-03-12 Listing Removed — Beaches MLS
- 2001-02-03 Listed $139,000 Beaches MLS
- 2000-12-08 Listed $139,000 Beaches MLS
- 1989-03-03 Sold (Public Records) $116,800 Public Records
Property tax history
-0.0%/yrLatest (2025): $2,763 · +3.5% YoY. Source: county tax records.
Cash-flow waterfall
monthlySold comps — $/sqft
last 12 mo · ≤1 miLoading sold comps…