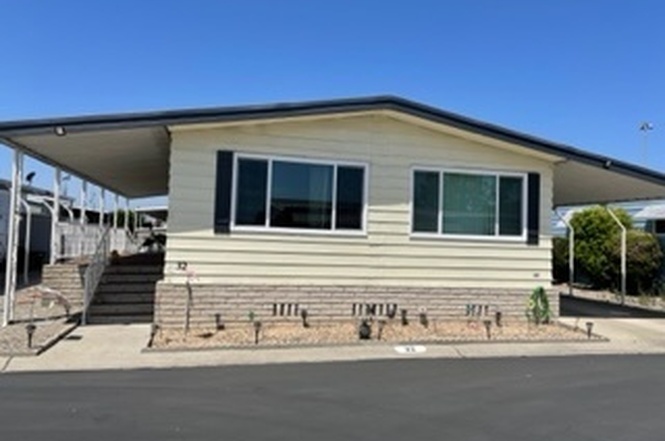
6741 Lincoln Ave #32 · Buena Park, CA
Flood risk 1/10 · Minimal
- FEMA flood zone
- X (shaded)
- Chance of flooding over 30 yrs
- 0.0%
- Est. flood insurance / yr
- $507 – $1,088
Fire risk 1/10 · Minimal
- Est. fire insurance / yr
- $659 – $1,223
Heat risk 5/10 · Moderate
- Hot days now (above 91°F)
- 7 days/yr
- Hot days in 30 yrs
- 23 days/yr
Wind risk 1/10 · Minimal
- Chance of severe wind over 30 yrs
- —
Air-quality risk 5/10 · Moderate
- Unhealthy air days now
- 7 days/yr
- Unhealthy air days in 30 yrs
- 8 days/yr
Risk factors via First Street. Map © Google.
Why this score? — see what drove the B+ grade
The composite is a weighted blend of 9 inputs, each scored 0–100. Each bar is that input's sub-score; the figure is the points it added to the 100-point composite (weight × sub-score).
- Cash flow +30.0/30.0
- ARV discount +12.4/15.0
- 1% rule +10.0/10.0
- DSCR +10.0/10.0
- Schools +5.5/10.0
- Livability +3.4/5.0
- Rent growth +2.8/5.0
- Condition / age +2.5/5.0
- Appreciation +0.0/10.0
$169,500
🖨 Deal sheet 📄 Offer letter ✓ Due diligence
Listing remarks
SELLER WILL CREDIT ONE MONTH SPACE RENT TOWARD'S CLOSING COSTS! This stunning 55+ senior community allows a second occupant aged 18 or older, offering a peaceful lifestyle with on-site management, beautiful landscaping, and convenient access to shopping and public transportation. Inside, you’ll find a comfortable layout with 2 bedrooms and 2 bathrooms. This home is well maintained and thoughtfully updated with care, featuring an updated kitchen and bathrooms, newer central A/C, carpet, and windows, along with a separate laundry area for added convenience, and earthquake braces under the home for added safety. A spacious living room with large front windows offers plenty of natural lig
Key facts
- Covered front porch
- Newer central a/c
- Updated bathrooms
Tags
Property features AI
Finance
- Financial info: Monthly land lease payment (seller-provided amount)
- HOA & community: Land lease community (Buena Villa Mobile Home Estates); Manager approval required; Rent includes gardener and pool; Community features: street lighting, park, community pool (heated)
Exterior
- Parking: Paved carport; Two covered carport spaces (2 total parking spaces)
- Security: Carbon monoxide detector(s); Smoke detector
- Utilities: Natural gas connected; Electricity connected (standard); Private water source; Private sewer; Cable available; Electricity on property
- Home design: Manufactured/mobile home (12' x 60') — mobile home remains; Single-story; Raised foundation with seismic tie down and pier jacks; Has a view
- Construction: Vinyl siding; Drywall walls; Sealed ducting; Synthetic/vinyl combination skirt
- Exterior features: Covered patio and deck; Awning; Rain gutters; Exterior lighting; Storage building; Patio home; Garden area; Back yard; Close to clubhouse; Cul-de-sac lot; Sprinkler system with sprinklers in rear; Yard and lawn
Interior
- Kitchen: Remodeled kitchen; Gas cooktop; Gas range and gas oven; Self-cleaning oven; Microwave; Refrigerator; Dishwasher; Garbage disposal; Utility sink; Gas water heater
- Bedrooms: Primary bedroom; All bedrooms on main level; Two primary bedrooms
- Flooring: Carpet; Laminate
- Bathrooms: Two full bathrooms; Upgraded bathrooms with soaking tub, bathtub and shower; Granite counters in bathrooms
- Heating & cooling: Central cooling; Central furnace heating
- Interior features: Ceiling fan; Living room deck attached; Storage space; Granite counters; Double pane windows; Turnkey condition; One level; Entry through carport; Carbon monoxide and smoke detectors; In-ground community heated spa
- Laundry & utility: Laundry inside; Washer hookup; Gas and electric dryer hookups; 220V in laundry
Neighborhood map
What this means for you Summary
Snapshot
- This is a 2-bed/2.0-bath manufactured listed at $170k.
Deal economics
- At list price, monthly cash flow is $1k ($15k/yr) — positive.
- The deal already cash-flows at list — no discount required.
- Meets the 1% rule at list price ($3k rent vs $170k).
- Recommended offer: $149k (12.0% below list) — sets the bar for market timing.
- Cap rate 15.2% vs local median 2.2% in Buena Park — top-decile yield for the area; either an underpriced asset or a hidden risk that comps aren't pricing in. Stress-test before assuming the spread holds.
Location & tenants
- Location reads 68/100 on livability (#300 in CA) — a middle-class / working-renter tenant base. Strengths: commute A+, employment A+, amenities A; Watch: schools C-, health & safety D, cost of living F.
- Centralia Elementary (suburban): math 59% / reading 63% proficiency, ranked #213 of 1,400 in CA (top 15%) — acceptable for families but not a draw, mixed tenant base, ~2y average lease.
- Market conditions: Rents rising (+1.3%/yr); 47 active listings in the ZIP; 40 comparable units currently listed for rent nearby; rentals leasing fast (median 2d on market — plan ~1-2 weeks tenant-placement turnaround); high-income renter base; 6,974 units permitted in Orange County in 2024 (3,839 in 5+ unit buildings).
Forward outlook
- Local home prices are declining (-3.0%/yr); year-one equity from $1k of loan paydown is wiped out by about $5k of value loss. Plan a longer hold.
- Orange County population projected at +14% by 2050 — modest demand growth; plan on rents tracking national, not racing it.
- At projected returns (-3.0% appreciation + 1.3% rent growth), your $47k cash investment doubles in ~4 years — after that, you're playing with house money.
Negotiation context
- It's been on market 218 days — a 12% lower offer ($149k) is reasonable based on typical stale-listing flexibility.
Risks & watch-outs
- Climate carrying-cost: extreme-heat days projected 7→23/yr by 2055 (HVAC capex compounding) — expect insurance premiums to compound above CPI over the hold.
Questions for the listing agent
- It's been on market 218 days. Have you received any prior offers? Is the seller open to a 12% concession, seller financing, or rate buy-down credit?
- Built in 1976 — when were the roof, HVAC, electrical panel, plumbing, and water heater last replaced?
- Why hasn't it sold? Are there any deal-killer items the seller is aware of (foundation, flood, title, zoning, code violations)?
- Is there a deadline driving the sale (1031 exchange, divorce, estate, relocation)? That informs how much negotiation room exists.
- What's the average days-on-market for RENTAL listings here right now (not sales)? A rising rental-DOM trend means longer vacancies and softer asking-rent achievability than the comps imply.
- What's the recent tenant-quality profile in this submarket — average credit score on applications, eviction rate, late-payment / NSF rate, and stable-employment percentage? A property-management company in the area should have these aggregated.
- How much new for-sale + rental construction is in the pipeline within 1–3 miles? Heavy new supply typically softens prices + rents 12–24 months out; constrained supply supports both.
Investment metrics
- 1% rule
- 1.82% ✓
- Cap rate
- 15.24%
- Cash-on-cash
- 31.96%
- DSCR
- 2.42
- GRM
- 4.6
CMA / ARV
- ARV (on-the-fly)
- $190,080
- Comps found
- 11
Show comp detail 11 sales within ~0.75 mi
| Address | Dist | Beds/Ba | Sqft | Sold | Price | $/sf | Match |
|---|---|---|---|---|---|---|---|
| 6741 Lincoln Ave #108 | 0.08mi | 2/2.0 | 1,500 (+4%) | 0mo | $150,000 | $100 | 89 |
| 6741 Lincoln Ave #165 | 0.08mi | 2/2.0 | 1,422 (-1%) | 14mo | $236,000 | $166 | 83 |
| 6741 Lincoln Ave #26 | 0.00mi | 2/2.0 | 1,590 (+10%) | 1mo | $230,000 | $145 | 82 |
| 6741 Lincoln Ave #24 | 0.08mi | 2/2.0 | 1,440 (0%) | 18mo | $170,000 | $118 | 81 |
| 6741 Lincoln Ave #76 | 0.08mi | 2/2.0 | 1,440 (0%) | 23mo | $189,500 | $132 | 77 |
| 6741 Lincoln Ave #152 | 0.08mi | 3/2.0 (+1) | 1,440 (0%) | 19mo | $185,000 | $128 | 76 |
| 6741 Lincoln Ave #156 | 0.16mi | 2/2.0 | 1,440 (0%) | 21mo | $195,000 | $135 | 75 |
| 6741 Lincoln Ave #114 | 0.12mi | 2/2.0 | 1,440 (0%) | 24mo | $147,500 | $102 | 75 |
| 6741 Lincoln #107 | 0.08mi | 3/2.0 (+1) | 1,300 (-10%) | 1mo | $150,000 | $115 | 74 |
| 6741 Lincoln Ave #155 | 0.08mi | 2/2.0 | 1,600 (+11%) | 7mo | $285,000 | $178 | 72 |
| 6741 Lincoln Ave #28 | 0.00mi | 2/2.0 | 1,640 (+14%) | 15mo | $220,000 | $134 | 65 |
Match score weights: distance 35% · size 25% · config 20% · recency 20%. Top-matched comps best support the ARV.
Projected returns pro-forma
-3.0% appreciation · 1.33% rent growth · sell at horizon
- IRR
- 25.0%
- Equity multiple
- 2.01×
- Total profit
- $48,002
- Equity at exit
- $25,273
- IRR
- 31.8%
- Equity multiple
- 3.64×
- Total profit
- $125,448
- Equity at exit
- $14,655
Cash invested: $47,460 (down + closing). Projections, not guarantees.
Landlord ↔ Tenant lean methodology
- Overall (STATE)
- 18 Strongly Tenant-Friendly
- State California
- 18 Strongly Tenant-Friendly · D+13
- County
- — inherits STATE
- City
- — inherits STATE
ZIP-level market 90620
- Rents YoY
- 1.3%
- Active inventory
- 47
- Price-to-rent
- 4.6×
Monthly cashflow live
- Estimated rent
- $3,083 high interval (Pro) →
- Mortgage (P&I)
- −$889
- Tax est. 1.5%
- −$212 /mo · $2,542/yr
- Insurance
- −$71
- HOA
- −$0
- Vacancy / Maint / Mgmt
- −$647
- Net cashflow
- $1,264
Break-even live
UW: 25.0% down · 7.5% · 30yr · 1.5% tax · 5.0% vac · 8.0% maint · 8.0% mgmt
Financing live
Cash to close
- Down payment
- $42,375
- Closing costs
- $5,085
- Reserves months
- —
- Total cash needed
- —
Loan-product check · same deal, 3 products live
Conventional
25% down · 7.5% · 30yr
- Down + closing
- —
- Monthly P&I
- —
- Monthly cashflow
- —
- DSCR
- —
- Eligible?
- —
Personal DTI + credit; lowest rate.
DSCR
20% down · 8.5% · 30yr
- Down + closing
- —
- Monthly P&I
- —
- Monthly cashflow
- —
- DSCR
- —
- Eligible?
- —
No personal income docs; deal must DSCR.
Hard money
10% down · 12.0% · 12mo
- Down + closing
- —
- Monthly P&I
- —
- Monthly cashflow
- —
- DSCR
- —
- Eligible?
- —
Short-term bridge; refi at stabilization.
Rent comps 40 comps
| Address | Beds | Baths | Sqft | Rent | $/sqft | DOM | Units | Dist |
|---|---|---|---|---|---|---|---|---|
| 3518 W Del Monte Dr Unit 7 Anaheim, CA | 2.0 | 1.5 | 900 | $2,195 | $2.44 | 17d | 1 | 0.26mi |
| 217 S Knott Ave Anaheim, CA | 2.0 | 2.0 | 912 | $2,450 | $2.69 | 1d | 1 | 0.27mi |
| 3401 W Del Monte Dr Anaheim, CA | 2.0 | 1.0 | 880 | $2,375 | $2.70 | 1d | 2 | 0.35mi |
| 7049 Fillmore Dr Buena Park, CA | 3.0 | 2.0 | 1354 | $3,995 | $2.95 | 1d | 1 | 0.36mi |
| 7049 Fillmore Dr Buena Park, CA | 3.0 | 2.0 | 1358 | $3,995 | $2.94 | 4d | 1 | 0.36mi |
| 3320 W Mirano Dr Anaheim, CA | 3.0 | 2.5 | 1591 | $3,850 | $2.42 | 1d | 1 | 0.39mi |
| 3300 W Lincoln Ave Anaheim, CA | 1.0–2.0 | 1.0–2.0 | 809 | $2,800 | $3.46 | 1d | 3 | 0.41mi |
| 145 S Westchester Dr Anaheim, CA | 1.0–2.0 | 1.0 | 800 | $2,595 | $3.24 | 1d | 4 | 0.46mi |
| 6386 Lincoln Ave Buena Park, CA | 1.0 | 1.0 | 900 | $2,400 | $2.67 | 4d | 1 | 0.51mi |
| 6386 Lincoln Ave Buena Park, CA | 1.0 | 1.0 | 900 | $2,400 | $2.67 | 2d | 1 | 0.51mi |
| 3601 W Orange Ave Anaheim, CA | 2.0 | 1.0 | 900 | $2,695 | $2.99 | 1d | 1 | 0.53mi |
| 3233 W Lincoln Ave Anaheim, CA | 1.0–2.0 | 1.0–2.0 | 855 | $2,700 | $3.16 | 1d | 5 | 0.56mi |
| 6490 Crescent Ave Buena Park, CA | 2.0 | 1.0–2.0 | 915 | $2,400 | $2.62 | 1d | 1 | 0.57mi |
| 3931 W Orange Ave Anaheim, CA | 1.0–2.0 | 1.0 | 847 | $2,699 | $3.18 | 1d | 6 | 0.58mi |
| 111 N Western Ave Anaheim, CA | 1.0–2.0 | 1.0 | 846 | $2,140 | $2.53 | 1d | 1 | 0.58mi |
| 6460 Crescent Ave Apt 8 Buena Park, CA | 2.0 | 2.0 | 970 | $2,400 | $2.47 | 1d | 1 | 0.59mi |
| 8291 San Helice Cir Buena Park, CA | 3.0 | 2.0 | 1585 | $3,000 | $1.89 | 15d | 1 | 0.63mi |
| 8291 San Helice Cir Buena Park, CA | 3.0 | 2.0 | 1585 | $3,500 | $2.21 | 2d | 1 | 0.63mi |
| 3428 W Orange Ave Anaheim, CA | 1.0–2.0 | 1.0–2.0 | 800 | $2,650 | $3.31 | 1d | 5 | 0.64mi |
| 3354 W Orange Ave Anaheim, CA | 2.0 | 1.0 | 1060 | $2,400 | $2.26 | 1d | 1 | 0.69mi |
| 6418 Orange Ave Cypress, CA | 1.0–2.0 | 1.0–2.0 | 858 | $2,500 | $2.91 | 1d | 2 | 0.76mi |
| 704 S Knott Ave Anaheim, CA | 2.0 | 1.0 | 880 | $2,250 | $2.56 | 1d | 1 | 0.77mi |
| 7490 Santa Elena Dr Buena Park, CA | 3.0 | 1.5 | 1409 | $6,000 | $4.26 | 1d | 1 | 0.83mi |
| 3625 W Savanna St Anaheim, CA | 2.0 | 2.0 | 1060 | $2,595 | $2.45 | 1d | 1 | 0.88mi |
| 8031 San Huerta Cir Buena Park, CA | 3.0 | 2.0 | 1090 | $3,750 | $3.44 | 2d | 1 | 0.89mi |
| 120 S Grand Ave Unit 84 Anaheim, CA | 2.0 | 1.0 | 875 | $2,725 | $3.11 | 1d | 1 | 0.93mi |
| 6051 Lemon Ave Unit C Cypress, CA | 2.0 | 1.0 | 900 | $2,395 | $2.66 | 10d | 1 | 0.94mi |
| 6051 Lemon Ave Unit C Cypress, CA | 2.0 | 1.0 | 900 | $2,395 | $2.66 | 1d | 1 | 0.94mi |
| 6156 Orange Ave Cypress, CA | 3.0 | 2.5 | 1193 | $3,850 | $3.23 | 1d | 1 | 0.95mi |
| 909 S Knott Ave Anaheim, CA | 1.0–2.0 | 1.0 | 880 | $2,695 | $3.06 | 1d | 1 | 0.97mi |
| 3070 W Del Monte Dr Anaheim, CA | 1.0–2.0 | 1.0 | 858 | $2,650 | $3.09 | 1d | 5 | 0.97mi |
| 6032 Lime Ave Cypress, CA | 3.0 | 2.0 | 1350 | $7,700 | $5.70 | 1d | 1 | 0.98mi |
| 460 N Santa Maria St Anaheim, CA | 3.0 | 2.5 | 1765 | $3,800 | $2.15 | 18d | 1 | 1.06mi |
| 6741 Ball Rd Buena Park, CA | 2.0 | 1.5 | 1000 | $2,495 | $2.50 | 1d | 1 | 1.06mi |
| 3427 W Ball Rd Anaheim, CA | 2.0 | 1.0 | 900 | $2,350 | $2.61 | 24d | 1 | 1.06mi |
| 9951 Holder St Cypress, CA | 3.0 | 1.5 | 1200 | $3,395 | $2.83 | 1d | 3 | 1.09mi |
| 7334 El Domino Way Buena Park, CA | 2.0 | 2.0 | 1050 | $2,700 | $2.57 | 1d | 1 | 1.12mi |
| 9950 Juanita St Cypress, CA | 1.0–2.0 | 1.0 | 820 | $2,935 | $3.58 | 1d | 9 | 1.15mi |
| 2970 W Orange Ave Unit B028 Anaheim, CA | 2.0 | 2.0 | 1100 | $2,880 | $2.62 | 17d | 1 | 1.31mi |
| 3208 W Ravenswood Dr Anaheim, CA | 3.0 | 2.0 | 1636 | $4,000 | $2.44 | 13d | 1 | 1.32mi |
Listing history 10 events
-
2026-06-04days on market $169,500 Active 218 DOM
-
2026-06-03days on market $169,500 Active 217 DOM
-
2026-06-02days on market $169,500 Active 216 DOM
-
2026-06-01days on market $169,500 Active 215 DOM
-
2026-05-31days on market $169,500 Active 214 DOM
-
2026-03-19price $169,500
-
2026-02-15price $179,500
-
2026-01-14price $189,000
-
2025-12-09price $194,900
-
2025-10-29$200,000 Active
ⓘ Source: listings_history table (triggers on properties + properties_extension) + one-shot
backfill from property_details.listing_events for pre-trigger history.
Climate risk First Street
- Flood 1/10 Low FEMA zone X (shaded) · 0% chance over 30 yrs
- Wildfire 1/10 Low
- Heat 5/10 Major 7 d/yr ≥91°F today · 23 d/yr by 30 yrs out
- Wind 1/10 Low
- Air quality 5/10 Major 7 unhealthy d/yr today · 8 by 30 yrs out
Nearby sold comps map
Loading sold comps map…
Walkable amenities ~0.75 mi
Loading nearby amenities…
Taxation est. · year 1
- Rental income
- $36,996
- − Mortgage interest
- −$9,495
- − Property taxes
- −$2,542
- − Insurance
- −$848
- − Repairs & maintenance
- −$2,960
- − Management
- −$2,960
- − Depreciation
- −$4,931
- Taxable income
- $13,261
- Est. tax owed @ 24.0%
- −$3,183
- After-tax cash flow
- $11,988/yr
For passive investors: Depreciation is non-cash, so a rental often shows a tax loss while cash-flowing — sheltering income. Rental losses are passive: they offset passive income freely, and up to $25,000/yr can offset ordinary (W-2) income if you actively participate and your MAGI is under $100k (phasing out to $0 by $150k); unused losses carry forward. On sale, claimed depreciation is recaptured at up to 25%, and gains may owe capital-gains tax (a 1031 exchange can defer both). Figures are a year-1 estimate at your 24.0% rate — not tax advice; consult a CPA.
Schools (NCES district)
- District
- Centralia Elementary
- NCES district ID
- 0608070
- Math proficiency
- 59% ▲ 1.00%
- Reading proficiency
- 63% ▬ 0.00%
- Median HH income
- $66,022
- Composite
- 55.0/100
- National rank
- #2782
- State rank
- #213 of 1400 in CA
Livability — Buena Park
- Score
- 68/100
- State rank
- #300
- US rank
- #10072
Category grades
Schools grade is shown separately in the Schools card above.
Census & demographics
- Census place
- Buena Park, CA
- County
- Orange County · 3,096,323 people
- City population
- 82,592
- Metro
- Los Angeles-Long Beach-Anaheim, CA
- Population (ZIP)
- 46,608
- Household income
- $126,094
- Rent vs Own
- Severe rent burden
- 1075.0
Population outlook (Orange County) Hauer SSP2
- Today (2025)
- 3,477,456 people
- By 2030
- 3,613,117 · +3.9%
- By 2040
- 3,835,945 · +10.3%
- By 2050
- 3,968,736 · +14.1%
- By 2075
- 4,097,053 · +17.8%
- By 2100
- 3,903,633 · +12.3%
Race, ethnicity, and origin ACS 2023
- Neighborhood character
- Diverse neighborhood (Simpson 0.70)
- Race & ethnicity
- Hispanic / Latino 39% Asian 29% White 26% Two or more races 16% Black 2% Native American 1%
- Hispanic origin (detail)
- Mexican 32% Puerto Rican 1%
- Common ancestry
- Iranian 1% Lithuanian 1% Romanian 1%
- Foreign-born
- 32% · Canada, South Korea, Vietnam
- Languages at home
- 53% English-only · Spanish 22% Tagalog/Filipino 8% Korean 5%
Political lean MEDSL · Orange
- 2024 margin
- Toss-up / Even · D 49.7% · R 47.1% · Other 3.2%
- 2008→2024 swing
- +5.2pp toward D · 2008: -2.6pp · 2024: 2.6pp
- All cycles
- 2024: D+2.6 2020: D+9.0 2016: D+7.7 2012: R+8.3 2008: R+2.6
Not yet ingested
- Civics
- —
Market trends
- HPI YoY
- ▼ -964.20%
- Current HPI
- 411.2003
- Rent YoY
- ▲ 1.33%
- Metro
- Los Angeles-Long Beach-Anaheim, CA
- State GDP YoY
- ▲ 3.21%
- F500 in state
- 116
Industry mix (Fortune 500 HQ in CA)
| Industry | F500 HQs | Revenue |
|---|---|---|
| Technology | 27 | $1,492B |
|
||
| Financial Services | 3 | $174B |
|
||
| Retail | 3 | $44B |
|
||
| Insurance | 3 | $26B |
|
||
| Media / Entertainment | 2 | $115B |
|
||
| Pharmaceuticals / Biotech | 2 | $62B |
|
||
Price history
-15.2% since first listed5 events — show timeline
- 2026-03-19 Price Changed $169,500 CRMLS
- 2026-02-15 Price Changed $179,500 CRMLS
- 2026-01-14 Price Changed $189,000 CRMLS
- 2025-12-09 Price Changed $194,900 CRMLS
- 2025-10-29 Listed $200,000 CRMLS
Property tax history
-6.8%/yrLatest (2025): $20 · +2.4% YoY. Source: county tax records.
Cash-flow waterfall
monthlySold comps — $/sqft
last 12 mo · ≤1 miLoading sold comps…